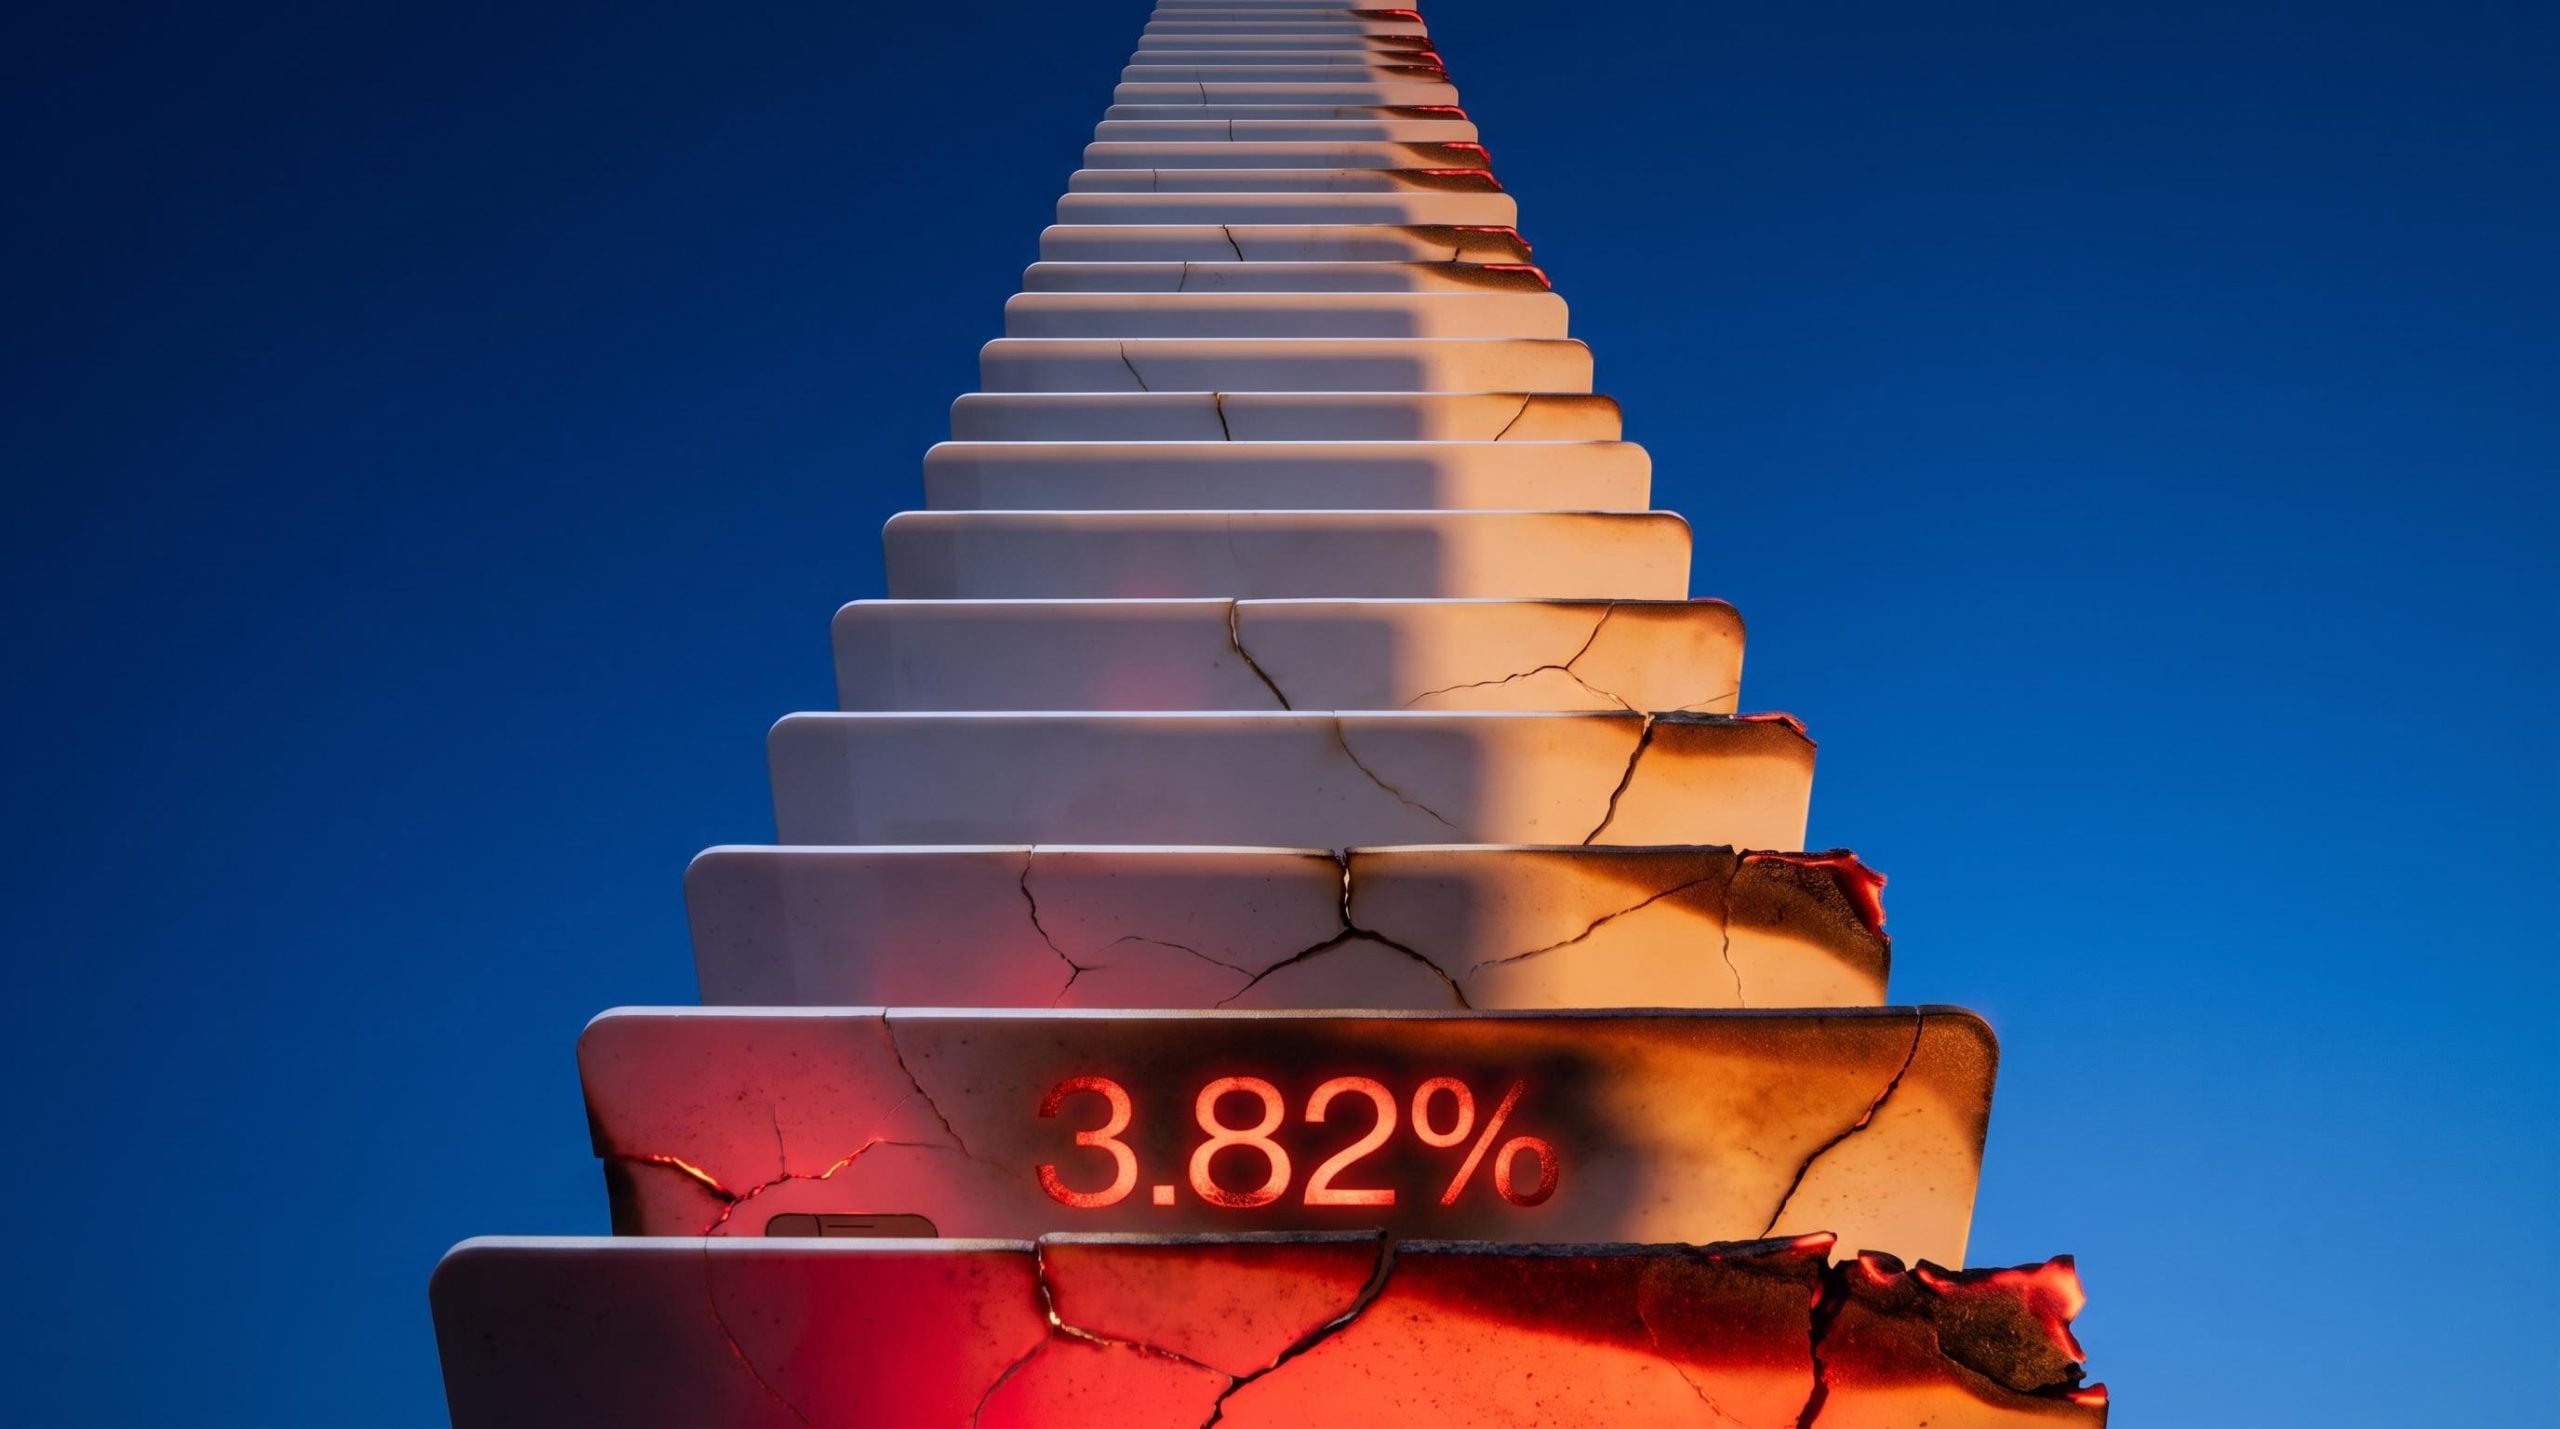
Credit card charge-offs at US commercial banks are running at 3.82% annualised, consumer confidence just dropped to its lowest reading since 2014, and yet the dominant commentary keeps describing this as a simple return to normal. The data and the framing are not telling the same story.
That gap matters because this is not the usual post-cycle tidy-up. The pandemic recovery split the country into two parallel economies, and the stronger one is now starting to drag the weaker one further down. The stress that began among subprime borrowers is climbing the credit ladder, several lender categories are more exposed than their peers, and some institutional investors are already moving defensively.
By the time you finish reading, you will be able to assess whether the consumer credit deterioration unfolding through 2026 is a short-lived speed bump or a structural reset, and what that distinction means if you hold financial sector stocks.
The signals are flashing, but are they telling the same story?
Start with the Federal Reserve’s own numbers, because they are the baseline everything else is measured against. As of Q2 2026, the net charge-off rate on credit card loans at US commercial banks hit 3.82% annualised, with a delinquency rate of 2.85% on balances thirty or more days past due.
The Federal Reserve charge-off data published through FRED is updated quarterly and covers all commercial banks, giving you a direct line to the same baseline figures that analysts and institutional monitors use to benchmark individual lender performance against the system as a whole.
A charge-off is a loan the bank has given up on and written off its books. A delinquency is a loan that is late but not yet abandoned. One measures losses already taken, the other measures losses coming down the pipe.
Across all consumer loans, the picture is softer but still rising: a 2.66% charge-off rate and a 2.62% delinquency rate for the same quarter. Credit cards are leading the deterioration, which is exactly where analysts expect stress to appear first.
Then the forward-looking data arrived to corroborate it. The Conference Board’s Consumer Confidence Index fell 6.7 points to 81.9 in September 2026, down from 88.6 in August.
Consumer confidence hit 81.9 in September 2026, its lowest level since 2014.
The Expectations sub-index, which captures how households feel about the months ahead, dropped to 63.6, its third consecutive monthly decline. Confidence collapsing while delinquencies rise is the balance sheet and the mood reinforcing each other, not two unrelated readings.
Named lenders sharpen the point further. Synchrony Financial, a high-rate card issuer charging close to 20% APR and writing off roughly 5% of its loan book every quarter, reported a 4.16% delinquency rate on balances thirty or more days past due in Q2 2026. Because Synchrony lends to higher-risk customers, its numbers surface trouble before more conservative banks show any.
Add a labour market that is cooling, with non-farm payrolls coming in around 29,000 against analyst expectations closer to 90,000, and you have the final piece.
Here is what the convergence tells you. Deteriorating bank credit metrics, collapsing confidence, and a labour market missing expectations are not isolated data points you weigh separately. They are a feedback loop, which is precisely why institutional monitors watch them as a system rather than in isolation.
The headline charge-off rate captures losses already taken, but consumer debt health across the full household balance sheet tells a more layered story: mortgage delinquencies remain near historic lows and household net worth hit a record $184.1 trillion in Q4 2025, which is precisely why major banks characterise the card deterioration as normalisation rather than crisis.
| Indicator | Reading | Period | Context |
|---|---|---|---|
| Credit card charge-off rate | 3.82% | Q2 2026 | Annualised, losses already taken |
| Credit card delinquency rate | 2.85% | Q2 2026 | 30+ days past due |
| Consumer loan charge-off rate | 2.66% | Q2 2026 | All consumer loans |
| Consumer loan delinquency rate | 2.62% | Q2 2026 | All consumer loans |
| Consumer Confidence Index | 81.9 | Sep 2026 | Lowest since 2014 |
| Synchrony delinquency rate | 4.16% | Q2 2026 | High-rate card bellwether |
When big ASX news breaks, our subscribers know first
Why stress that started in subprime is now climbing the credit ladder
Understanding why the stress is migrating upward requires understanding the conditions that held it down in the first place. The pandemic years were unusual, and the unwinding of that unusualness is the mechanism.
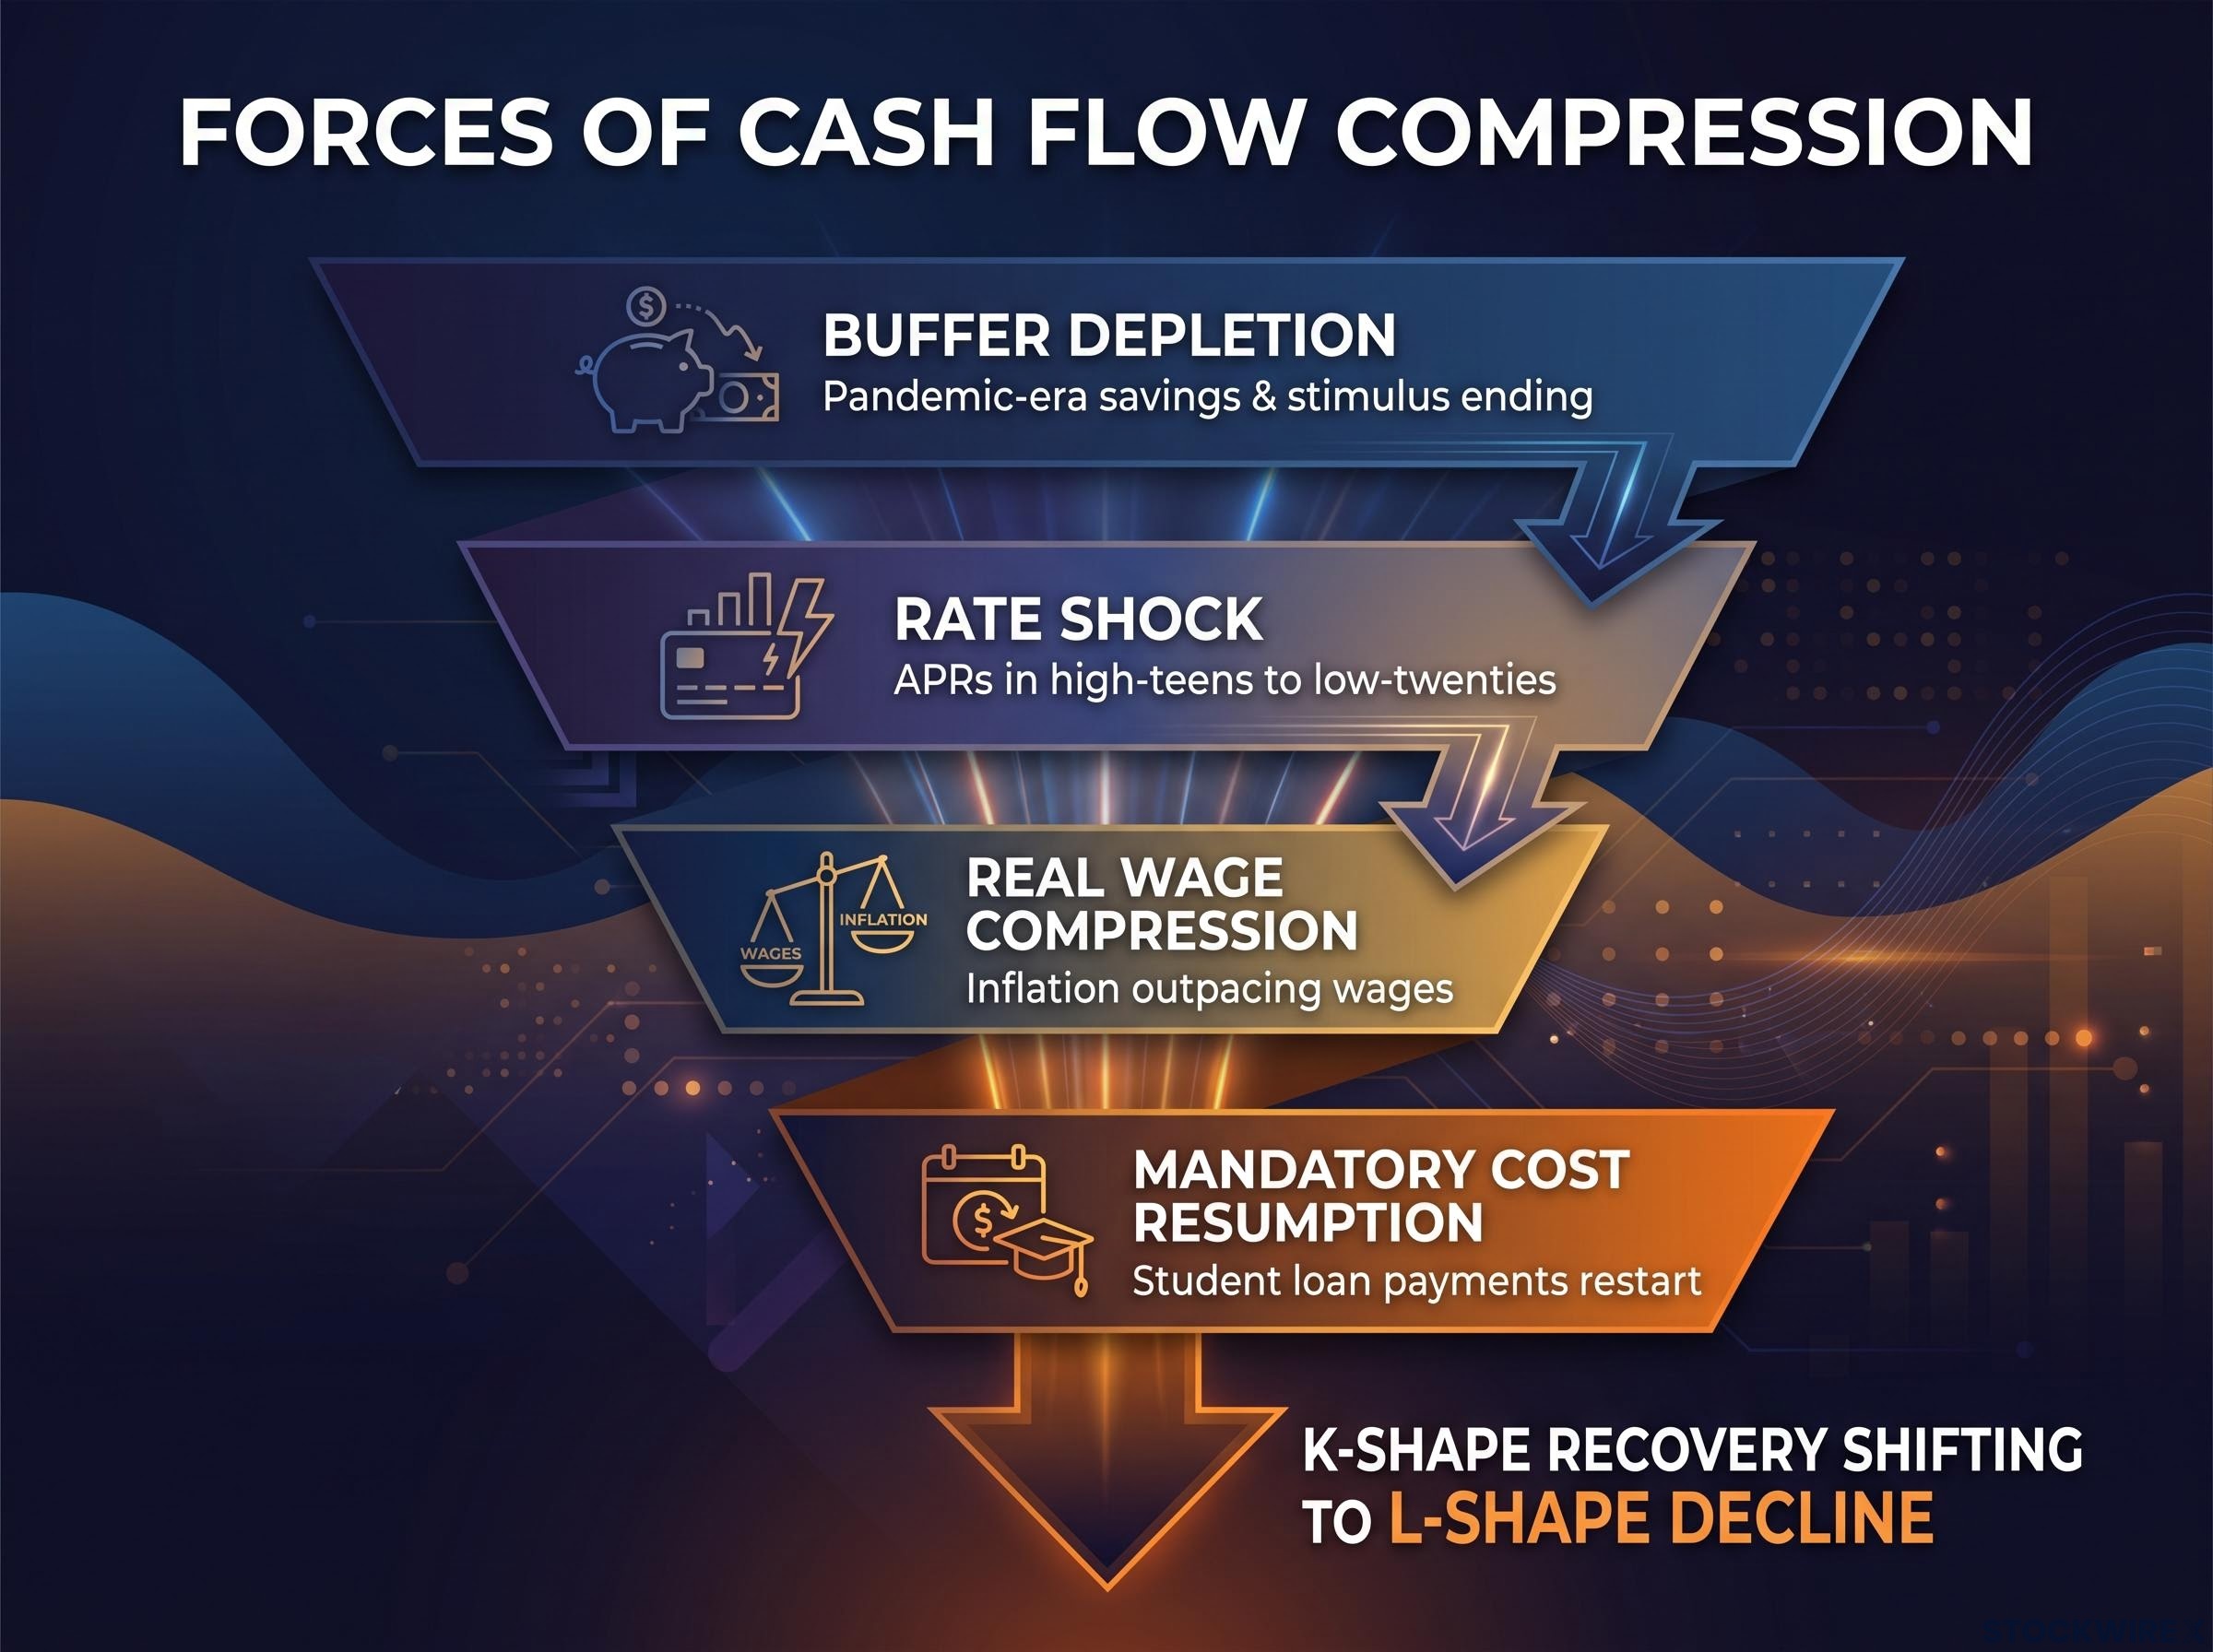
The transmission runs through four structural forces, each compressing household cash flow in a slightly different way:
- Buffer depletion: Pandemic-era excess savings, stimulus transfers, and forbearance programmes pushed delinquencies to abnormally low levels in 2021 and 2022, and as those buffers run dry, lower-income households lose the ability to absorb shocks first.
- Rate shock: Federal Reserve tightening since 2022 drove variable card APRs into the high-teens to low-twenties, turning previously comfortable prime borrowers into near-prime risks once promotional periods end or balances build.
- Real wage compression: Inflation has outpaced wage growth for many middle- and lower-income households, with most consumers estimated to be experiencing everyday inflation on fuel and food in the mid-to-high single-digit range, forcing greater reliance on revolving credit.
- Mandatory cost resumption: The restart of federal student loan payments, alongside rising housing, healthcare, and insurance costs, reprioritises household cash flow even for borrowers whose credit scores still look healthy.
Read those together and the sequence becomes clear. Subprime borrowers break first because they have the least cushion. Once the extraordinary supports are gone, the same pressures reach near-prime buckets, then begin to show up among higher-score cohorts whose credit profiles looked untouchable a year earlier.
Subprime auto delinquencies illustrate the same transmission mechanism operating in a parallel product category: a 32-year high of 6.9% among subprime ABS borrowers, while prime auto borrowers remain near historical norms at approximately 0.4%, confirming that concentrated credit stress and broad recessionary deterioration are two materially different conditions.
This is why institutional monitors treat high-risk lenders as early-warning systems. Chris Whan, author of the Institutional Risk Analyst, tracks the top 100 US banks by assets, those exceeding $10 billion in total assets, using the highest-risk-profile lenders as leading indicators for problems that have not yet surfaced at conservative institutions.
From two-track recovery to single-trajectory decline
The framing that captures this best is the shift from a K-shape to an L-shape. The pandemic recovery was K-shaped: one group of households recovered strongly while another never did, two tracks running in parallel.
What is happening now is the upper track losing its insulation. As rate pressure, cost resets, and buffer depletion reach households that previously looked resilient, the two tracks begin converging into a single downward trajectory.
Here is the part worth holding onto. The migration of stress from subprime to prime is not an anomaly; it is the predictable result of removing emergency policy supports from an economy that never resolved its underlying income and wealth inequality. Prime credit quality is now a lagging indicator of a problem that started years earlier, which means treating prime borrower health as a separate, insulated story leaves you working with an incomplete model.
Which lenders carry the most risk, and what the warning signs look like
Knowing which category a lender belongs to is only the starting point. The same label can describe an institution that has already passed its loss peak and one that is still accelerating, so the goal is knowing which disclosures to check.
Monoline and private-label credit card issuers sit at the top of the risk list. Their business models concentrate almost entirely in unsecured revolving credit, which amplifies loss sensitivity when APRs rise and payment rates slow. Synchrony is the clearest example: a high-rate lender charging close to 20% and writing off roughly 5% of total loans each quarter.
Subprime and near-prime auto lenders and consumer-finance companies are the second-most-exposed group. Their borrowers have thin or impaired credit files, and as used-car prices normalise and collateral support erodes, repossession activity and loss severity both climb.
Fintech and nonbank lenders, including buy-now-pay-later platforms and online personal-loan providers, are structurally fragile for a different reason. They underwrite with limited collateral and depend on capital-markets funding, so weakening investor appetite can choke their ability to roll existing credit.
Within traditional banking, the risk sits with institutions carrying outsized unsecured consumer exposure and thinner capital cushions. The observable signals are above-peer loan growth, lower allowance-coverage ratios, and concentration in economically weaker geographies.
The ABS market as a public early-warning system
Lenders that depend heavily on consumer asset-backed securities (ABS), which are bundles of loans sold to investors as tradable securities, face rollover and mark-to-market risk. The useful part for you is that this risk is publicly observable: spread widening in consumer securitisations and deteriorating subordinate tranche performance are visible signals you do not need insider access to read.
| Lender Type | Primary Risk Driver | Key Warning Signals |
|---|---|---|
| Monoline card issuers | Unsecured revolving concentration | Rising charge-offs, slowing payment rates, more non-prime originations |
| Subprime auto lenders | Collateral erosion as car prices normalise | Elevated repossessions, rising loss severity, wider ABS spreads |
| Fintech / nonbank lenders | Limited collateral, funding dependence | Loss rates outrunning banks, weaker securitisation appetite |
| Consumer-credit-heavy banks | Thin capital, concentrated exposure | Above-peer loan growth, low allowance coverage, weak geographies |
| ABS issuers | Rollover and mark-to-market risk | Spread widening, subordinate tranche losses, tranche downgrades |
The institutional reaction tells you how seriously some professionals take this.
Chris Whan has reduced his financial sector exposure substantially, sold his Charles Schwab holdings, trimmed his Annaly Capital position, and initiated short positions on select bank names. He has described this repositioning as atypical for his approach. This is an attributed institutional action, not a recommendation.
Whan projects the trough in consumer credit conditions for Q2 or Q3 of 2026, with defaults continuing to rise into 2027.
Two interpretations of the same data, and how to monitor which one is winning
The data on deterioration is not seriously disputed. What is contested is the trajectory, and two genuine camps read the same numbers differently.
The cyclical camp, which includes many economists at the Federal Reserve and large banks, sees normalisation. Pandemic supports drove losses to artificially low levels, and the current rise is simply reversion toward long-run averages. Provided the labour market holds, this view expects a mid-cycle credit peak followed by recovery, which favours diversified banks with strong capital and balanced fee income.
The structural camp, consistent with Whan’s framing, sees something more durable. High APRs persist, housing and essential-services costs have reset structurally higher, and deep income and wealth inequality leaves a large slice of households with almost no buffer, keeping losses elevated for years rather than snapping back.
| Dimension | Cyclical view | Structural view |
|---|---|---|
| Core argument | Reversion to normal from abnormal lows | A higher-loss plateau that does not revert |
| Key supporting data | Charge-offs near, not far above, long-run averages | High-teens to low-twenties APRs, structurally higher living costs, $2 trillion deficit pressuring rates |
| Investment implication | Selective, mid-cycle positioning in strong-capital banks | Defensive, selective exposure to consumer-credit-heavy lenders |
| How to tell if correct | Losses crest then recede as labour market holds | Losses plateau high as stress keeps climbing the ladder |
For additional context, the University of Michigan sentiment reading came in at 48.1 in September 2026, down around 7 percentage points year-on-year, though this figure is not independently confirmed and should be treated as supporting colour rather than primary evidence.
Sentiment deterioration is amplified when inflation expectations also rise simultaneously, because households then anticipate both weaker incomes and higher costs. The September 2026 Michigan data showed short-term inflation expectations jumping from 4.0% to 4.6% alongside the headline collapse, a combination that pushes the Fed toward inaction precisely when household stress is accelerating.
What to watch: the indicators that resolve the debate
Rather than outsourcing the judgment to either camp, you can track the evidence yourself. These indicators are ordered by how far ahead they lead:
- Payment rate trends on card portfolios, where deceleration precedes delinquency spikes.
- ABS spread movements and subordinate tranche performance in consumer securitisations.
- Charge-off and delinquency trends at monoline issuers and consumer-finance companies.
- Labour market data, the single most important macro variable for consumer credit.
- Real wage growth versus inflation, which tells you whether households are rebuilding or eroding.
- Conference Board and University of Michigan sentiment, leading signals for spending and credit demand.
The distinction here is not academic. It is the variable that decides whether a financial sector underweight is a one-quarter trade or a multi-year positioning call, and these indicators are what will resolve it first.
What the credit cycle signals now, and where the evidence points next
The data is not ambiguous about deterioration. Charge-offs are elevated, confidence is at a twelve-year low, and the stress is climbing from subprime toward prime exactly as the transmission mechanism predicts. The genuine open question is trajectory, self-correcting or persistent, and the monitoring framework above is the tool for tracking which scenario wins.
Whan’s projected trough for Q2 or Q3 2026 is worth reading carefully. A trough in conditions is the point of maximum new deterioration, not the end of elevated losses, which are expected to continue into 2027.
Credit stress signals are migrating beyond traditional consumer categories: 57% of cash-out mortgage refinancers in Q2 2026 accepted a higher rate to access home equity, and bank lending standards are now at their tightest since 2005, two datapoints that confirm the stress-ladder migration is no longer confined to subprime card and auto borrowers.
The projected trough marks peak deterioration, not peak losses. Defaults are expected to keep rising into 2027 even after conditions stop worsening.
The labour market is the variable that matters most, because even a modest rise in unemployment hits already-stressed households hardest and accelerates the feedback loop. Pick one indicator and start tracking it now. The Federal Reserve publishes quarterly charge-off and delinquency releases, the Conference Board reports monthly, and monoline issuers like Synchrony disclose portfolio metrics each earnings season.
This article is for informational purposes only and should not be considered financial advice. Investors should conduct their own research and consult with financial professionals before making investment decisions. Past performance does not guarantee future results, and forward-looking projections are subject to market conditions and various risk factors.