Most retail traders who blow up on biotech did not get the science wrong. They made a structural mistake long before the trial readout: they sized the position the way they would size a cyclical stock, then watched a clinical failure erase most of that position overnight, with no chance to exit between the prior close and the morning open.
Biotech stocks are not simply more volatile than conventional equities. They operate under a categorically different risk framework. A chip company that misses earnings might fall 15%. A biotech whose Phase 3 trial misses its primary endpoint can fall 70%, 80%, or 92% in a single session, exactly as Sionna Therapeutics and Cassava Sciences did in recent years.
Binary risk profiles in clinical-stage biotech are categorically different from the drawdown pattern of commercial healthcare companies; the Immutep collapse of roughly 90% in a single session following a Phase III discontinuation is the same structural event as the Sionna and Cassava failures, confirming that the overnight gap-down is not an anomaly but the modal adverse outcome for single-asset pre-revenue programmes.
The upside in this sector is real and well documented. So is the structural asymmetry that punishes anyone who treats these stocks like everything else in their portfolio.
This guide covers the specific mechanics experienced biotech traders use to participate in the sector’s upside without exposing themselves to catastrophic single-event losses. You will get a practical framework for position sizing, catalyst timing, technical pattern recognition, and the structural traps that disproportionately catch retail participants off guard.
Why biotech stocks break the rules most traders trade by
Here is the difference that matters. When a semiconductor company disappoints, you can react. There is a market open, a downtrend, a chance to sell into weakness. When a single-asset biotech reports a failed trial, the value of years of research and development evaporates before you can do anything about it, because the damage lands overnight in a gap-down that no stop-loss order can catch.
That last point is the one most traders underestimate. A stop-loss only works if there is trading between your entry and your exit. In an adverse biotech scenario, the stock can gap down anywhere from 40% to 90% between the prior close and the post-news open. There is no price in between for your stop to trigger at, which makes standard sizing based on Average True Range or daily volatility structurally inadequate for this sector.
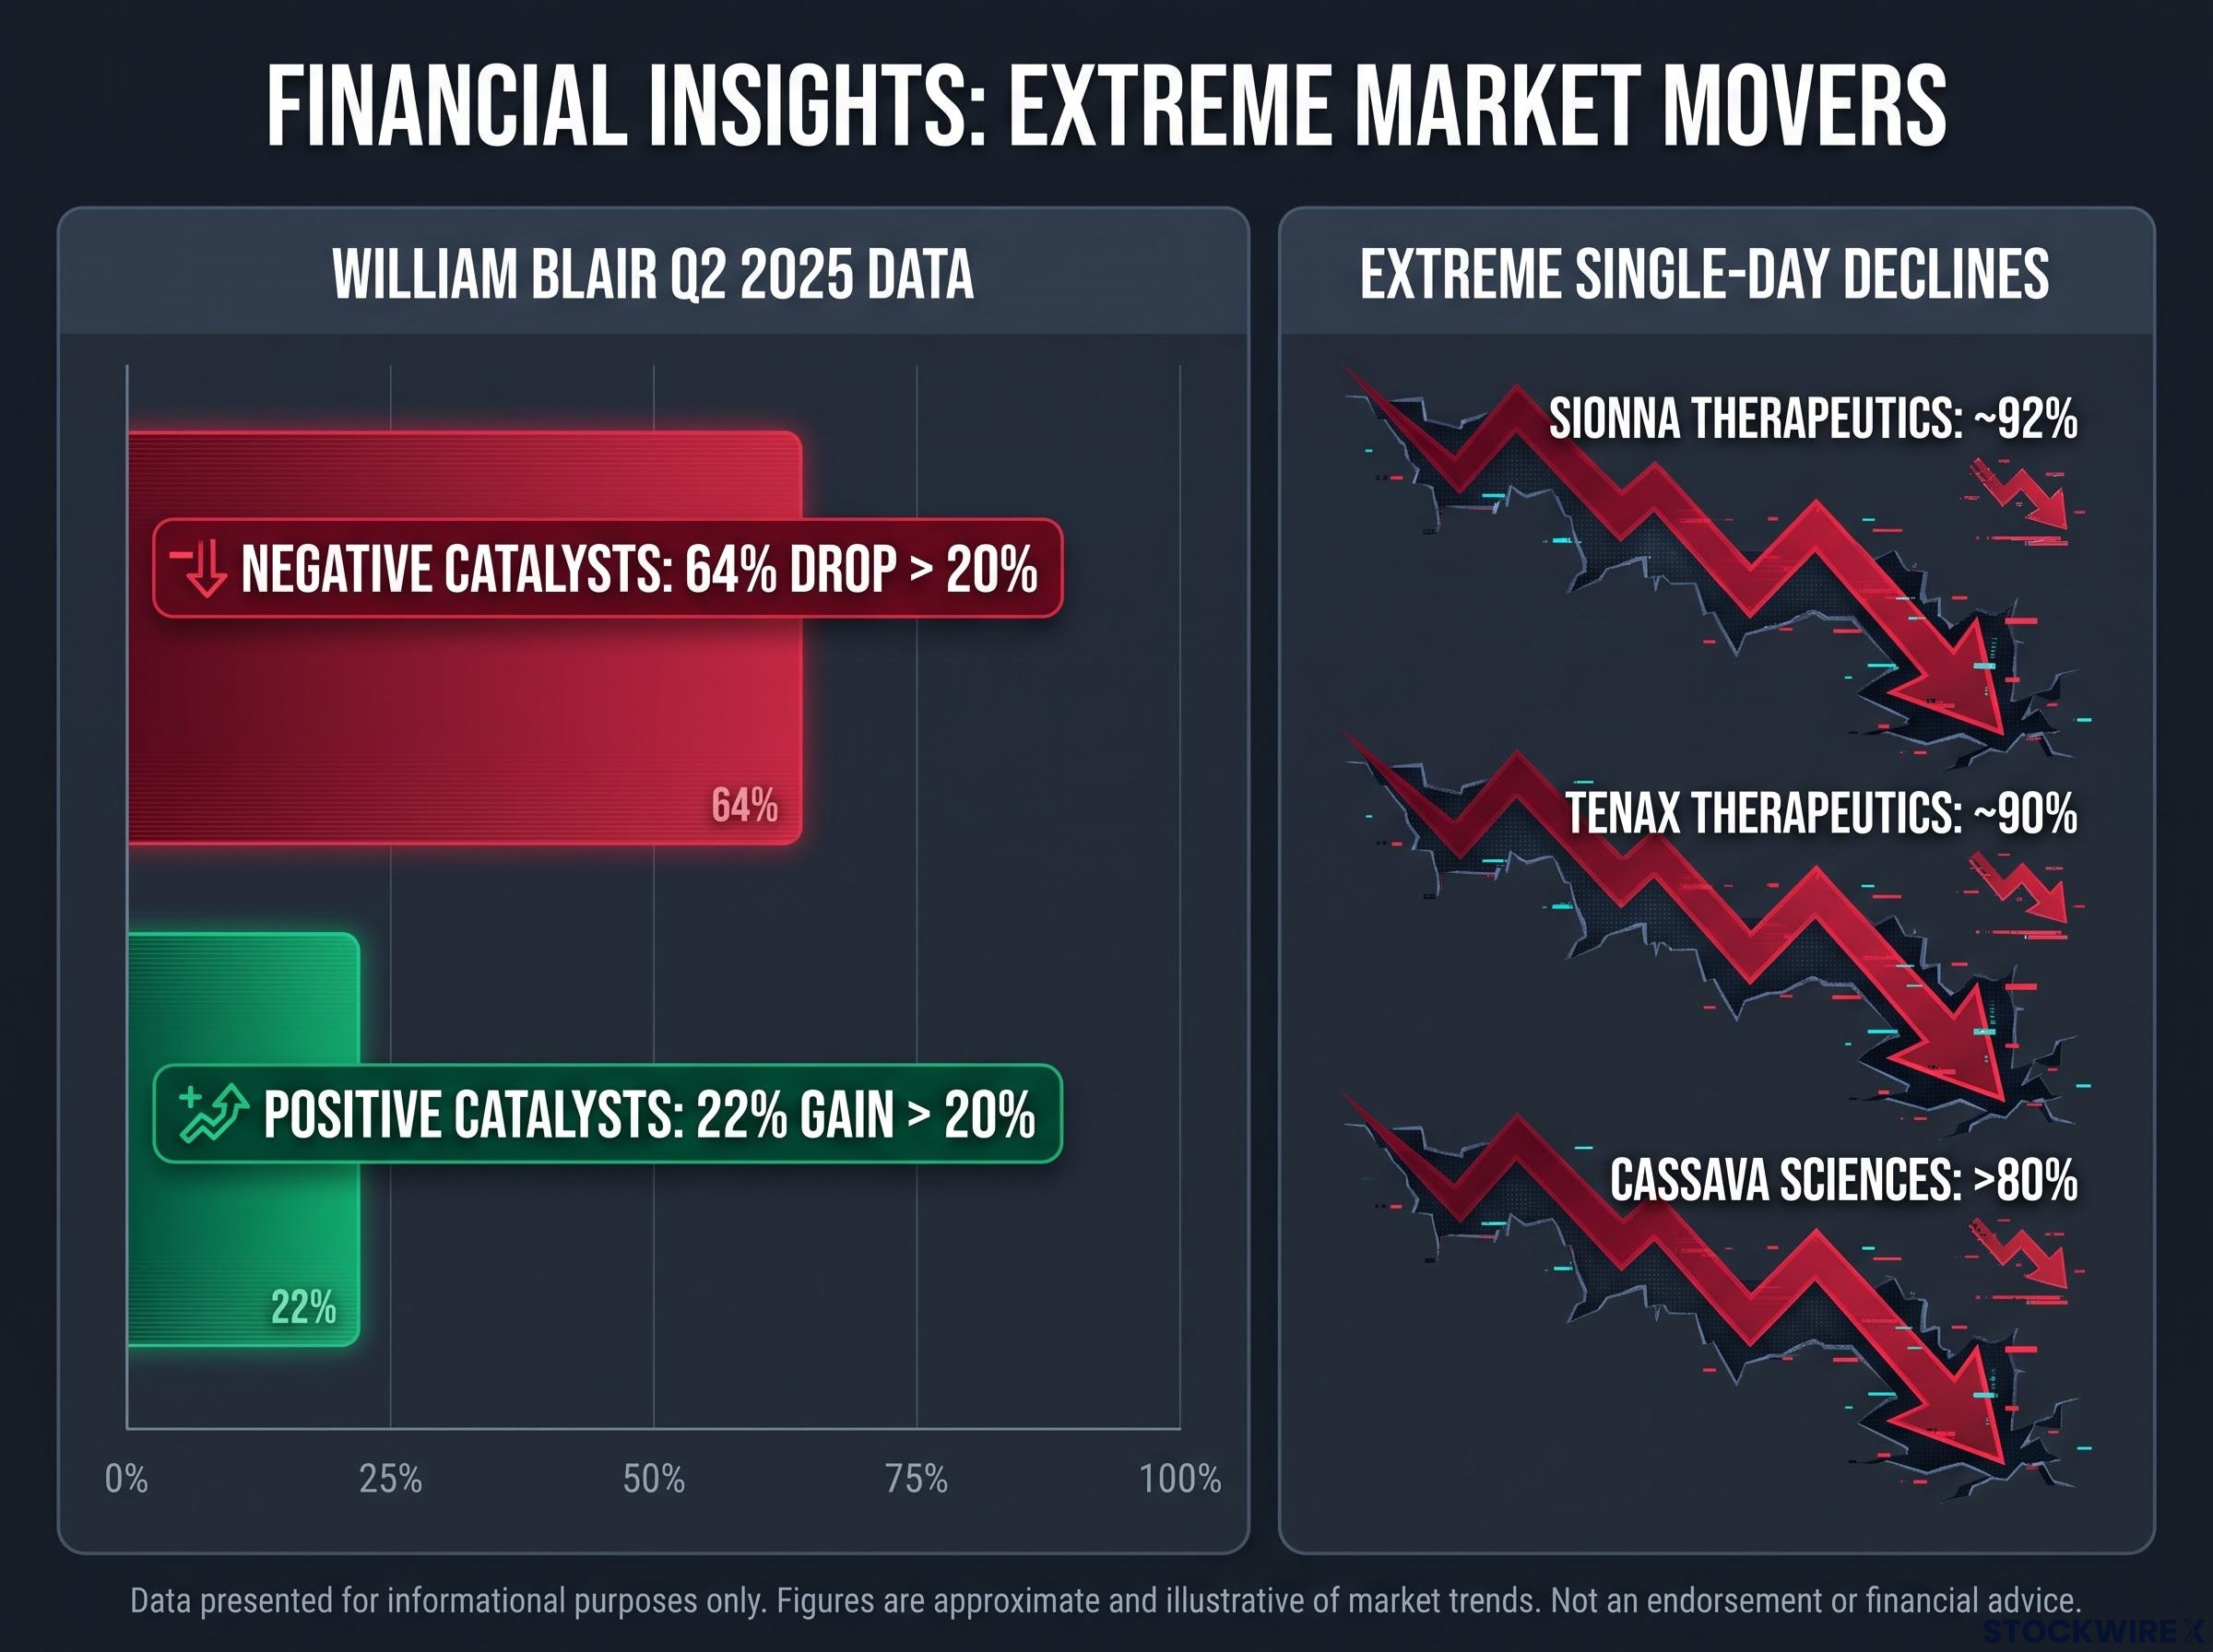
The probabilities make it worse, and this is the core insight. A Q2 2025 biopharma review by William Blair found that negative catalysts punish far more reliably than positive catalysts reward.
The William Blair asymmetry 64% of negative clinical catalysts produced one-day price declines greater than 20%, compared with only 22% of positive catalysts generating equivalent one-day gains.
Recent history shows what that looks like in practice:
- Sionna Therapeutics: late-stage cystic fibrosis trial missed its main goal, stock down approximately 92% in a session.
- Tenax Therapeutics: Phase 3 heart-failure trial failed its primary endpoint, stock down nearly 90%.
- Cassava Sciences: Phase 3 Alzheimer’s trial failed co-primary endpoints, stock down over 80%.
Not every biotech carries this profile. A company with a diversified pipeline and commercial revenue can absorb one failed trial. A single-asset, pre-revenue microcap cannot: one adverse readout takes its enterprise value close to zero.
What this tells you is that biotech risk is not simply larger than the risk in your other holdings. It is different in kind. Your existing risk management toolkit does not need recalibrating for this sector. It needs rebuilding.
When big ASX news breaks, our subscribers know first
What the clinical trial success rates actually tell you
Before you size a single position, you need to know the base rate, and it is almost certainly lower than you think. Most retail traders enter a biotech catalyst trade believing they are backing a likely winner. The data says the opposite.
According to Citeline Biomedtracker, the overall likelihood of approval from Phase 1 fell to 6.7% in 2024, down from 10.4% a decade earlier. That implies a failure rate of 93.3% for a drug entering human trials.
Clinical milestone taxonomy, the ability to distinguish a Type C FDA meeting from a Fast Track Designation or a conference abstract slot, determines whether you are reading a genuine signal or promotional noise, because each milestone type carries a different weight in any credible probability-of-success model.
Other credible sources put the number a little higher, but the story does not change. Bridge BioHealth cited an overall clinical success rate of approximately 7.9% in 2026. MIT biostatistics work and BIO/Informa data place the overall Phase 1-to-approval range somewhere between roughly 7.9% and 14%, depending on the indication and the type of sponsor.
The attrition is not spread evenly. Watching where drugs fail tells you which readouts carry the most risk.
| Phase Transition | Success Rate (BIO/Informa) | Success Rate (MIT/Pharmatica) | Cumulative Approval Probability |
|---|---|---|---|
| Phase 1 to Phase 2 | ~52% | 47-63% | Roughly half survive the first cut |
| Phase 2 to Phase 3 | ~29% | 28-31% | The steepest drop in the stack |
| Phase 3 to FDA filing | ~58% | Not stated | Still fails four times in ten |
| Filing to approval | 86-91% | ~55-58% (approval) | ~7.9% to 14% overall from Phase 1 |
The Phase 2-to-Phase 3 step is where the bulk of programmes die. Only around 29% clear it, which means a Phase 2 readout is statistically the single most dangerous event you can hold through.
Translating base rates into a pre-trade checklist
Turn those numbers into three questions you ask before any biotech position:
- What phase is the programme in, and does the transition data favour it or bury it?
- Is this a single-asset company, where one failure equals near-zero value?
- Does the company have cash runway to survive if this specific trial fails?
If the modal outcome for your catalyst is failure, and for a pre-revenue microcap holding through Phase 2 it is, then your position size has to reflect that probability rather than the optimism baked into the run-up price. That is exactly what the next section builds.
Position sizing for a sector where stop-losses do not work
Start from a single doctrine: size a binary catalyst hold as if the position can go to zero. You already know why. The overnight gap-down makes your stop-loss irrelevant, so the only variable you actually control is how much you put at risk before the readout.
Practitioners who trade this sector for a living do not treat portfolio caps as conservative preferences. Given the gap-down data, they treat them as structural requirements. Here is where three of them draw the line.
| Practitioner / Source | Maximum Single Position | Portfolio-Level Catalyst Cap |
|---|---|---|
| Marc Lichtenfeld | No more than 4% of risk capital | 25% trailing stop keeps a stopped-out loss near 1% of portfolio |
| ClinicalInvestor | 5% maximum per catalyst trade | 15% total across all catalyst-exposed positions |
| Benzinga Pro | 1-3% per position | Diversified basket of 5-10 plays |
Read the ClinicalInvestor numbers carefully, because they contain the interpretation that matters. A single position at 5% targets a worst-case downside of 1-2% of your portfolio. Push that position to 10% and a single gap-down can produce a portfolio-level loss deep enough to take months of gains to recover, even when your read on the science was correct. That recovery cost is the actual risk you are managing.
The consensus from educators such as Dansfera and Thesis Trading AI sharpens the doctrine further: size any position held through a PDUFA date or clinical readout as if you are willing to lose the entire stake, calibrating to a 50-80% overnight drop scenario.
There is a tactical layer on top of the cap. You do not have to hold your full position into the event. Benzinga Pro recommends reducing exposure by 25-50% before the decision date, which locks in run-up gains while keeping you in the trade.
Put those pieces together and you get a repeatable three-step sequence for every catalyst position:
- Establish your initial position within the single-position cap, never above 5%.
- Trim 25-50% into the run-up before the readout date, taking your gains off the table.
- Size whatever remains as a total-loss position, calibrated to a 50-80% drop.
If you want the worst-case number defined in advance, options offer a cleaner structure. A long call ahead of a run-up caps your maximum loss at the premium you pay upfront, turning an unknowable gap-down into a known dollar figure. That is not a shortcut around the framework. It is another way to enforce the same discipline.
Reading the chart: technical patterns that matter in biotech
Now the harder truth about charts. Technical analysis in biotech is not about finding clean setups and trusting them. It is about knowing which patterns hold under which conditions and which collapse entirely when the fundamental thesis breaks. Used that way, a chart is a timing tool. Used as protection, it will fail you at the worst possible moment.
Four patterns are worth knowing, each with the condition that makes it usable:
- Bull flag re-entry: the most actionable post-catalyst recovery setup, but only when the underlying thesis survives, meaning no primary endpoint failure.
- Trendline and Ichimoku cloud support: secondary confirmation tools that identify a last-stand support zone once nearer levels give way.
- Run-up and exhaustion: the “buy the rumour, sell the news” accumulation pattern, powerful ahead of a catalyst and treacherous in crowded Phase 3 names.
- Pre-emptive exit discipline: closing the position entirely 24 to 48 hours before a readout, a chart-based rule rather than a bearish call on the trial.
The Climb Bio case shows why the condition attached to each pattern is not optional. The stock had built an eight-month uptrend, textbook by any chart reading, with a longer-term trendline and an Ichimoku cloud sitting underneath as support. Adverse Phase 1 data broke it instantly. Initial support levels failed, and that final trendline-and-cloud zone became the last thing standing.
What that tells you is direct. Even a pristine eight-month uptrend is not a risk mitigant when a binary catalyst overrides the chart. The pattern told you nothing about the trial, and the trial was the only thing that mattered.
For fixable setbacks, timing changes the calculus. If a company receives a Complete Response Letter, a formal notice from the regulator that an application cannot be approved in its current form, and the cited issues concern manufacturing or labelling rather than efficacy, the stock has a path back.
ClinicalInvestor post-setback protocol Wait 1 to 2 trading days after a fixable regulatory setback for volatility to settle and short-term support to form before entering, rather than averaging down into the initial drop.
For traders who want to profit from the move without betting on direction, defined-risk volatility structures such as straddles and strangles let you participate in an extreme move either way while capping your loss at the premium paid.
The pre-catalyst run-up: timing the entry and managing the exit
The run-up trade has a recognised window: accumulation roughly 6 to 8 weeks ahead of a catalyst, then selling into the final strength regardless of the outcome. The exit discipline is the whole trade. You are capturing anticipation, not the result.
Not all run-ups are equal. An early-stage anticipation run tends to carry lower retail crowding and more reliable technical continuation. A heavily telegraphed Phase 3 name is the opposite: crowded retail positioning, unusual options activity, and parabolic price action are all signs of an exhaustion top forming. When the whole market already knows the readout date, the easy money in the run-up is usually gone, and the crowd is your warning to trim, not your invitation to chase.
The structural traps that catch retail traders in biotech
The failures covered so far are visible, tied to a trial or a regulatory date you can see coming. The traps in this section are the ones you often cannot see until the loss has already happened, and they are where retail traders are most structurally disadvantaged.
Start with dilution, the most common non-catalyst way to lose money here. Small-cap biotechs frequently run on zero revenue and survive on investor funding, which means discounted secondary offerings and warrants that dilute existing shareholders and push the share price down. A drug approval does not protect you if the capital structure is broken. Reported examples such as MannKind, cited as falling around 32% after a discounted raise, and Agentix Corp, described with no revenue, negative equity and a current ratio near 0.05, illustrate the pattern, though both figures should be treated as unverified.
Shareholder dilution mechanics, specifically the NYSE rules governing discounted private placements and the exceptions that allow large deals to bypass a shareholder vote, are the legal layer underneath the capital structure risk that makes some pre-revenue biotechs dangerous even when the science holds.
Delisting risk is the trap most traders never screen for, and the numbers make it a baseline concern rather than an edge case.
The 2025 Nasdaq compliance picture More than 200 of approximately 700 publicly traded biotech companies were trading below net asset value in 2025, placing them at severe delisting and bankruptcy risk.
Then there is information asymmetry. Institutions have real analytical advantages when valuing complex research-and-development assets, which you cannot replicate from headlines. Research describes an asymmetric ownership paradox: retail buying overshoots fundamental value on the way up, and institutional selling amplifies the fall when clinical reality lands short of the story.
Here are the four structural risks to screen before you enter, each with one thing you can actually check:
- Dilution and secondaries: check cash runway and recent raise history for discounted offerings.
- Delisting and compliance: check whether the stock trades below net asset value and its Nasdaq bid-price standing.
- Information asymmetry: check short interest, float, and cash burn, not just the science headline.
- Narrative premium inflation: check whether a rare-disease or oncology story has pushed valuation beyond what the trial probabilities justify.
What the delisting statistic really tells you is that in any given year, a meaningful slice of the biotech universe is not just a risky trade but a potential total loss from structural causes that have nothing to do with the trial. Screening for that before entry is as important as reading the trial design itself.
Trading biotech with a framework that matches its actual risk profile
You now have the framework. What happens next depends on whether you apply it consistently or selectively, and selective application is precisely where most biotech traders come undone.
The shift that matters is conceptual. Biotech is not a high-risk version of conventional equity trading. It is a distinct discipline with its own sizing rules, its own pre-trade checklist, and its own post-catalyst protocols. Treat it that way and the sector becomes a manageable risk category rather than an all-or-nothing bet.
The upside is worth pursuing under specific conditions: a position sized within the framework, a thesis that already accounts for the failure probability, and a pre-defined response for both a win and a loss. Miss any one of those and you are speculating, not trading.
Apply this five-point protocol to every biotech position before you open it:
- Screen the structure for dilution risk and Nasdaq compliance.
- Assess the clinical stage against the base-rate probability data.
- Size the position within the 15% total portfolio cap for catalyst-exposed holdings.
- Decide your pre-event trim in advance.
- Pre-define your response for both outcomes of the readout.
Keep the base rate in view. Even with optimal sizing and timing, the roughly 7.9% to 14% approval odds mean most of your catalyst bets will resolve as losses. The goal is not to pick winners. It is to survive the losses at a scale that lets the eventual winners compound. Defined-risk options remain the cleanest way to participate in a binary event when you want your maximum loss known upfront.
For readers wanting to apply structured options techniques to catalyst events beyond simple straddles, our dedicated guide to defined-risk options structures covers calendar spread construction, front-to-back IV ratio thresholds, and the position-sizing discipline that determines whether the structural edge survives execution costs.
This framework is not a system for picking winners. It is a system for staying in the game long enough to be holding when a winner arrives.
This article is for informational purposes only and should not be considered financial advice. Investors should conduct their own research and consult with financial professionals before making investment decisions. Past performance does not guarantee future results, and the probability figures and price movements referenced here are subject to market conditions and various risk factors.