How to Spot AI Investment Scams Before They Cost You Money
6 hrs ago


In July 2024, an economic indicator with a perfect track record stretching back to 1970 fired for the first time outside a recession. The Sahm Rule, a real-time recession detector designed by Federal Reserve economist Claudia Sahm, crossed its 0.50 percentage point threshold, triggering alarm among economists and market participants. No recession followed. Sahm herself called it a “false positive,” a rare public disavowal from an indicator’s own creator.
The episode was not isolated. The yield curve had been inverted for a record-setting stretch without a recession arriving. The Conference Board’s Leading Economic Index had also been flashing warnings that never materialised. Something structural was distorting the signals, and that something turns out to be a labour supply shock that violated the foundational assumptions these tools were built on.
What follows explains how the Sahm Rule works, why it broke down in 2024, what specific supply-side mechanics caused the failure, and how practitioners should interpret recession indicators when the structural environment has shifted away from the demand-shock conditions those tools were designed to detect.
The Sahm Rule’s calculation is straightforward, which is part of why it became so widely trusted. The indicator triggers when a single condition is met:
The Federal Reserve Bank of St. Louis tracks the reading in real time via the FRED series SAHMREALTIME, making it one of the most accessible recession signals available to both policymakers and the public.
Sahm developed the rule in 2019 as part of research into automatic fiscal stabilisers. The policy intent was specific: if a recession is starting, fiscal support (such as direct stimulus payments) should deploy automatically and immediately, rather than waiting months or years for the National Bureau of Economic Research to officially date the downturn. The rule was the trigger mechanism, designed for speed over precision.
Sahm’s 2019 Hamilton Project paper establishes the 0.50 percentage point threshold as a deliberately conservative trigger, chosen to minimise false negatives in a policy context where late fiscal deployment was considered more costly than early deployment.
What made it distinctive was not the calculation but the measurement approach. The rule tracks the change in unemployment rather than the absolute level. A country can have 4% unemployment and be fine, or 4% unemployment and be entering a contraction. What matters is the direction and pace of the move from a recent low. Even modest upward shifts of half a percentage point had, historically, always coincided with recessionary conditions.
Every recession from 1970 through 2019 followed a broadly similar template: demand falls, employers cut headcount, unemployment rises, and the economy contracts. The Sahm Rule was calibrated to this demand-shock pattern. Because layoff-driven unemployment rises are sharp and self-reinforcing (job losses reduce spending, which causes more job losses), the 0.50 percentage point threshold proved both reliable and timely across five decades of U.S. recessions.
That unblemished record is what made July 2024 so striking.
The Sahm Rule reading reached 0.53 percentage points in July 2024, breaching the 0.50 threshold for the first time since the pandemic recession of 2020. By the rule’s own logic, a recession was underway.
Sahm’s response was swift and unusually direct for the creator of an economic indicator defending her own work.
“If the Sahm Rule was going to fail, it’s going to be this time.” — Claudia Sahm, Business Insider/Fortune, August 2024
She characterised the reading as a “false positive” and identified the specific cause: unemployment was rising not because employers were firing workers, but because more people were entering the labour force and searching for jobs. The mechanism pushing the unemployment rate upward in 2024 was fundamentally different from the mechanism the rule was built to detect.
The distinction matters for anyone using the indicator:
Sahm proposed no formal revision to the threshold but recommended that practitioners contextualise future readings with supplementary data, including job leavers and new entrants. By March 2026, the FRED SAHMREALTIME reading had fallen to 0.20, well below the trigger point, confirming the 2024 signal had been transient rather than the onset of contraction.
The labour force expansion of 2023 to 2024 was substantial. Bureau of Labor Statistics estimates for 2025 placed net migration at approximately 2.5 million per year, a figure large enough to shift national labour market aggregates in ways that prior decades of data had not prepared recession indicators to handle.
The mechanism is sequential. Newly arrived workers enter job searches. While they search, they are counted as unemployed. If enough new entrants are searching simultaneously, the national unemployment rate rises, not because anyone lost a job, but because the denominator of the labour force expanded faster than hiring could absorb it.
The Sahm Rule’s 12-month comparison window is particularly vulnerable to this dynamic. It measures how far the current unemployment rate has moved from its recent low. If the recent low was artificially depressed, as it was in 2022-2023 due to pandemic-era labour shortages, then even modest upward movement from supply-side additions can breach the 0.50 percentage point threshold.
Analysts have estimated that immigration-driven effects may structurally elevate the raw unemployment rate baseline by 0.2-0.4 percentage points relative to prior cycles. That margin alone accounts for a significant share of the 0.53 reading that triggered the rule in July 2024.
Labour force participation tells a different story from the headline unemployment rate: a rising participation rate can push the U3 figure upward even when layoff activity is negligible, which is precisely the decomposition the Fed’s own policymakers have been signalling they prioritise over the raw monthly payrolls print.
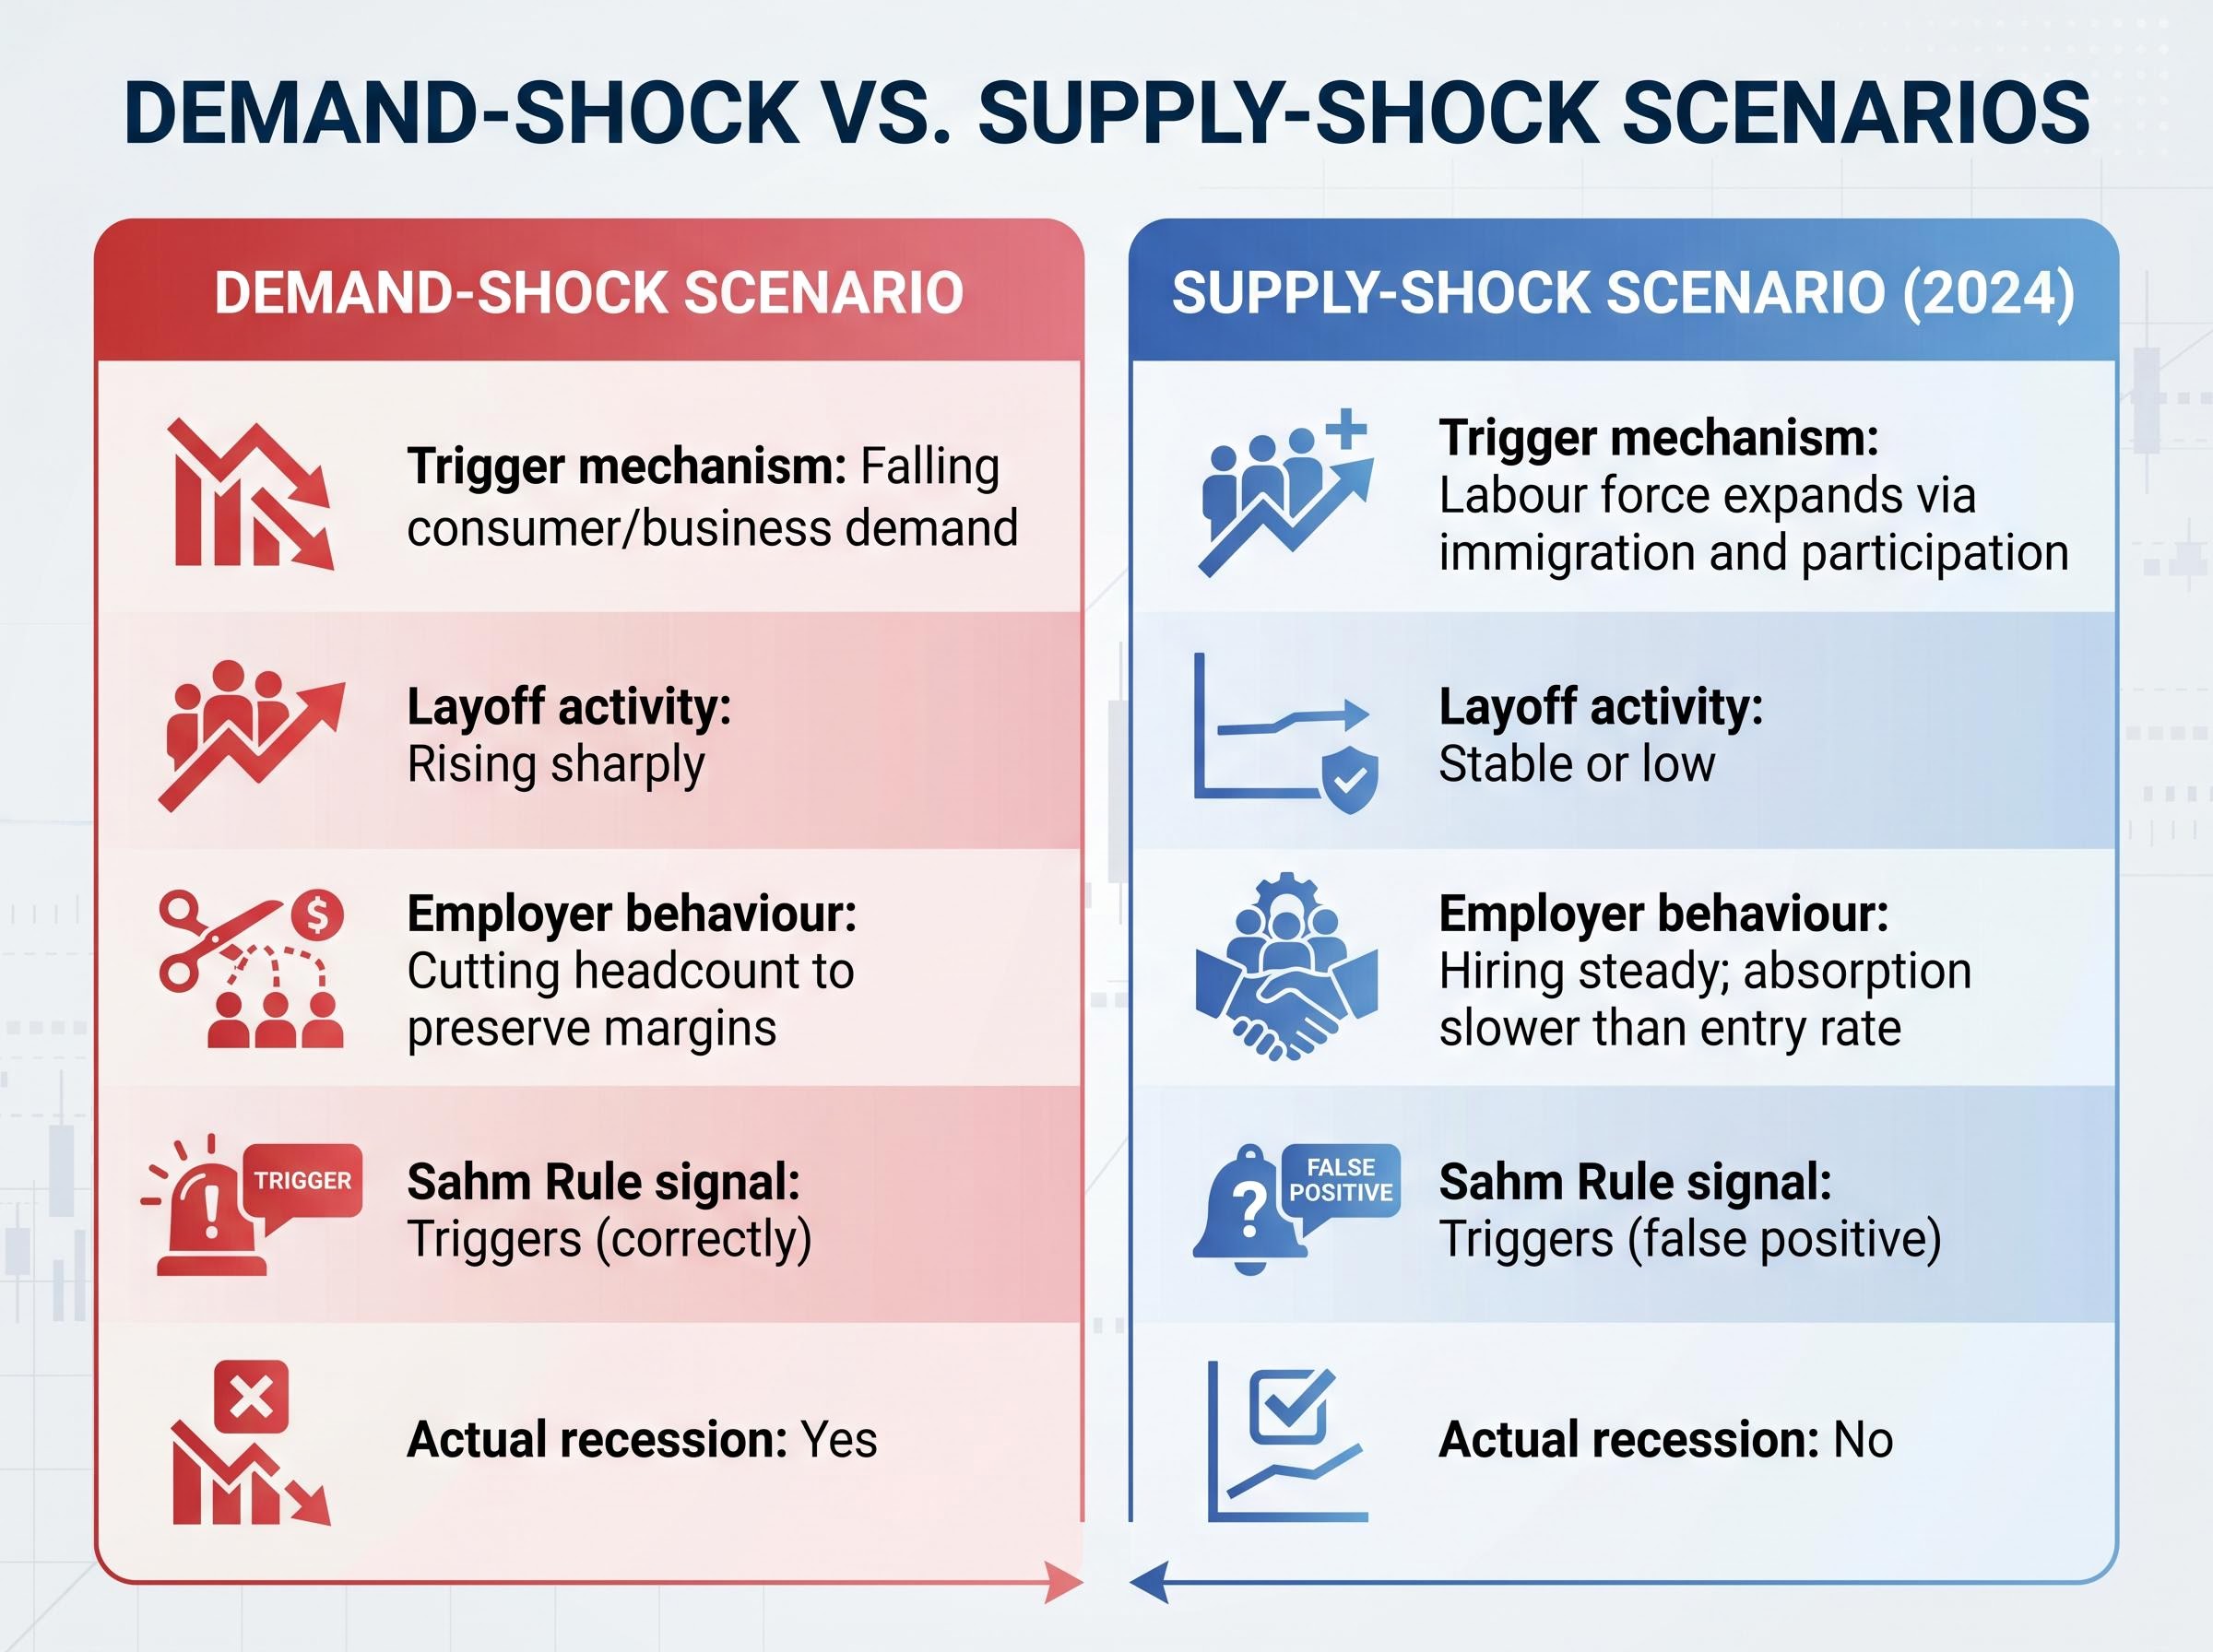
| Factor | Demand-Shock Scenario | Supply-Shock Scenario (2024) |
|---|---|---|
| Trigger mechanism | Falling consumer/business demand | Labour force expands via immigration and participation |
| Layoff activity | Rising sharply | Stable or low |
| Employer behaviour | Cutting headcount to preserve margins | Hiring steady; absorption slower than entry rate |
| Sahm Rule signal | Triggers (correctly) | Triggers (false positive) |
| Actual recession | Yes | No |
The post-pandemic labour shortage compressed unemployment to levels that created an unusually sensitive starting point for the rule’s 12-month comparison window. When the unemployment rate sits near historic lows, any upward movement, regardless of cause, covers more of the 0.50 percentage point gap required to trigger the indicator.
The rule’s measurement window is calibrated to normal unemployment cycles. A pandemic-compressed floor made the threshold easier to breach on any upward move, and the immigration-driven supply surge provided exactly that upward pressure.
The 2023-2024 labour market occupied an unusual configuration that no single indicator captured cleanly. Unemployment insurance initial claims remained very low, confirming that widespread layoffs were not occurring. At the same time, the hiring rate was depressed, creating a labour market in stasis: few workers were being fired, but few were being hired either.
The unemployment rate stabilised in the 4.0-4.2% range through early 2025 (BLS data for January through April 2025), with the labour force participation rate at 62.8% as of January 2025. That stabilisation is itself informative. A demand-driven recession produces accelerating unemployment, not a plateau. The flattening was consistent with a supply-absorption episode: new entrants gradually finding positions while the overall rate settled at a modestly higher equilibrium.
The divergence between hard and soft data became one of the defining interpretive challenges of 2024 and early 2025: strong payroll prints and low claims coexisted with deteriorating consumer sentiment surveys, creating exactly the kind of conflicting signal environment that makes mechanical reliance on any single indicator unreliable.
By March 2026, the FRED SAHMREALTIME reading had declined to 0.20, confirming the 2024 trigger was self-correcting rather than the leading edge of contraction.
| Date | Sahm Rule reading | Unemployment rate (U3) | Status |
|---|---|---|---|
| July 2024 | 0.53 | Rising (supply-driven) | Threshold breached; false positive |
| January 2025 | Declining | 4.0% | Signal fading; no recession |
| March 2026 | 0.20 | Stable range | Well below threshold |
Several indicators remained more coherent through the 2024 supply disruption. Greg Ip of the Wall Street Journal cited the JOLTS quits-to-layoffs ratio, noting that a ratio above approximately 1.5 may indicate underlying labour market health even when the headline unemployment rate is ticking upward. The Beveridge curve (the relationship between job vacancies and unemployment) and payroll growth also continued to signal an economy that was absorbing new workers rather than shedding existing ones.
Claudia Sahm herself, writing from New Century Advisors in 2025, recommended tracking “excess entrants,” defined as job seekers minus quits, as a more informative signal than raw unemployment rate movement in high-immigration periods. That decomposition would have avoided the 2024 false positive entirely.
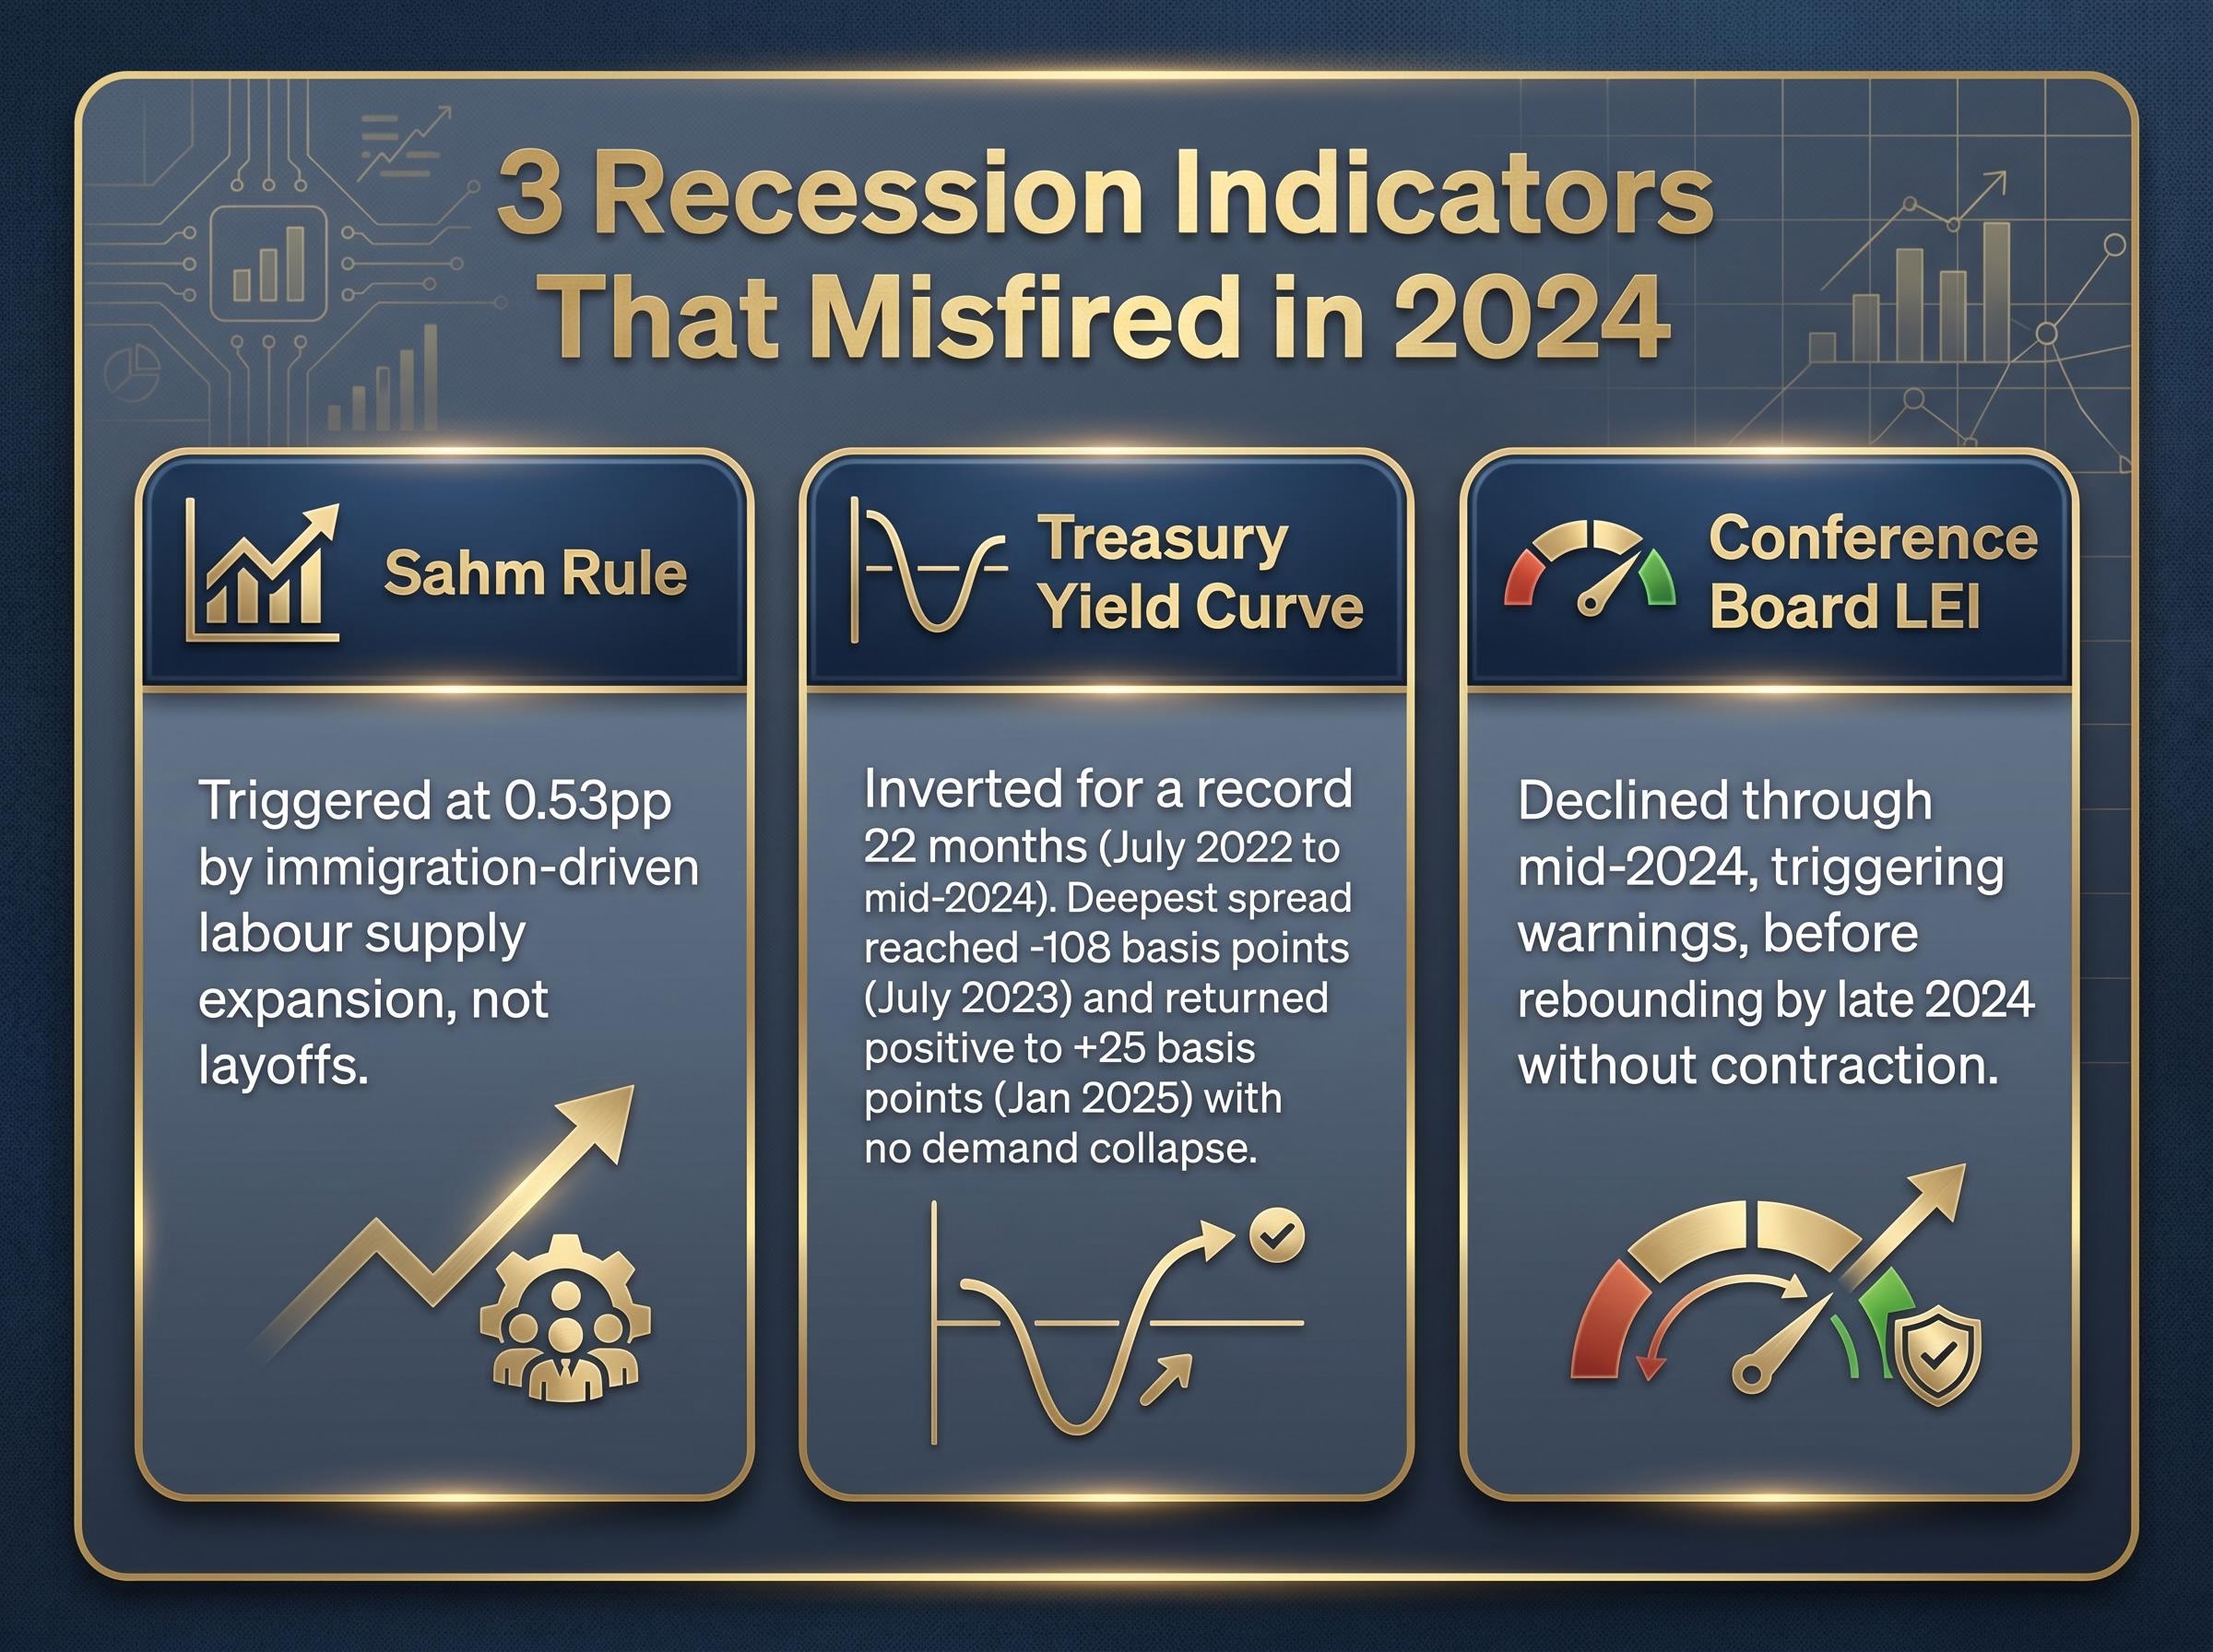
The Sahm Rule was not the only respected indicator to misfire in 2024. The U.S. Treasury yield curve inverted in July 2022 and remained inverted for approximately 22 months by mid-2024, the longest sustained inversion on record. At its deepest point, around July 2023, the 10-year minus 2-year spread reached approximately -108 basis points.
The yield curve’s recession-predictive logic assumes a specific transmission mechanism: tighter monetary conditions suppress demand, demand weakness becomes visible in hiring and output, and a contraction follows. In 2024, supply-side resilience muted that transmission. The economy absorbed historically aggressive rate hikes without the demand collapse those hikes were expected to produce.
By January 2025, the spread had returned to positive territory at approximately +25 basis points, without a recession having materialised.
Dallas Fed President Lorie Logan observed that supply-side resilience muted what the yield curve signal would historically have predicted, a pattern consistent with the broader failure of demand-calibrated indicators during this period.
When multiple indicators fail simultaneously, the lesson is about the environment, not the individual tools. Three widely followed signals all fired false positives in 2024, each for the same structural reason:
The common cause across all three was a supply-side disruption that these demand-era tools were not designed to accommodate.
The Sahm Rule has not been formally revised. The 0.50 percentage point threshold remains unchanged, and the indicator continues to be tracked in real time via FRED. What has changed is how practitioners use it.
The 2024 episode shifted professional practice toward contextual interpretation rather than mechanical triggering. When the rule fires, the first question is no longer “is a recession starting?” It is: what kind of unemployment is driving this signal?
Chicago Fed President Austan Goolsbee has advocated moving beyond unemployment-rate-centric rules entirely in supply-disrupted environments, favouring broader measures such as a vacancy-to-unemployed ratio or a broad mismatch index. Sahm herself (New Century Advisors, 2025) has recommended tracking “excess entrants” as a complement to the raw reading.
The practitioner community has converged on a contextual check process when the Sahm Rule triggers:
Complementary indicators now elevated in post-2024 practitioner frameworks include:
Some researchers have proposed raising the effective threshold to 0.60-0.70 percentage points for post-2020 data, though this remains a research-community discussion rather than an institutionally adopted change. The broader direction is toward hybrid composite indicators combining Sahm readings with PMI data, JOLTS, immigration-adjusted labour force participation, and financial stability indices.
The Sahm Rule’s 2024 failure is not a reason to discard a historically reliable tool. It is a reason to upgrade the interpretive framework around it.
Sector-level decoupling from aggregate economic performance has become a recurring feature of the post-pandemic macro environment, where housing, labour, and financial markets have each moved on their own structural trajectories rather than the synchronised cycles that calibrated most recession-detection frameworks.
The Sahm Rule did not fail because it was poorly designed. It was applied in an environment that violated its foundational assumptions. Every recession from 1970 to 2019 was demand-driven. The 2024 episode was supply-driven. The indicator performed exactly as its mechanics dictate; the economy simply was not doing what those mechanics were built to detect.
The dual lessons are clear. Supply-shock eras require decomposition-first thinking: separating layoff-driven from entrant-driven unemployment before applying any demand-calibrated framework. And no single indicator should be used as a mechanical trigger when structural conditions are in flux.
As of March 2026, the Sahm Rule reading stands at 0.20, signalling no active recession warning. The 2024 episode is now best understood as an identified edge case, one that has clarified rather than undermined the indicator’s long-term value.
This article is for informational purposes only and should not be considered financial advice. Investors should conduct their own research and consult with financial professionals before making investment decisions.
The Sahm Rule is a real-time recession detection tool created by Federal Reserve economist Claudia Sahm that triggers when the 3-month moving average of the national unemployment rate rises 0.50 percentage points or more above its 12-month low, a threshold that correctly identified every U.S. recession from 1970 through 2019.
The Sahm Rule triggered in July 2024 at a reading of 0.53 because unemployment was rising due to immigration-driven labour force expansion rather than employer layoffs, a supply-side dynamic the indicator was not designed to detect, and Sahm herself publicly called it a false positive.
Investors should cross-check the trigger against unemployment insurance initial claims, the JOLTS quits-to-layoffs ratio, and labour force participation trends; if claims are low and the quits ratio is above approximately 1.5, the signal is more likely supply-side noise than the start of a demand-driven contraction.
After peaking at 0.53 in July 2024, the FRED SAHMREALTIME reading declined steadily and reached 0.20 by March 2026, well below the 0.50 threshold, confirming the 2024 signal was transient and no recession followed.
The U.S. Treasury yield curve inverted for a record 22 months without a recession materialising, and the Conference Board Leading Economic Index declined through mid-2024 before rebounding without contraction, with all three failures sharing the same root cause: supply-side structural changes that demand-calibrated tools were not built to handle.