
Fletcher Building returns to profit as FY26 earnings rebound
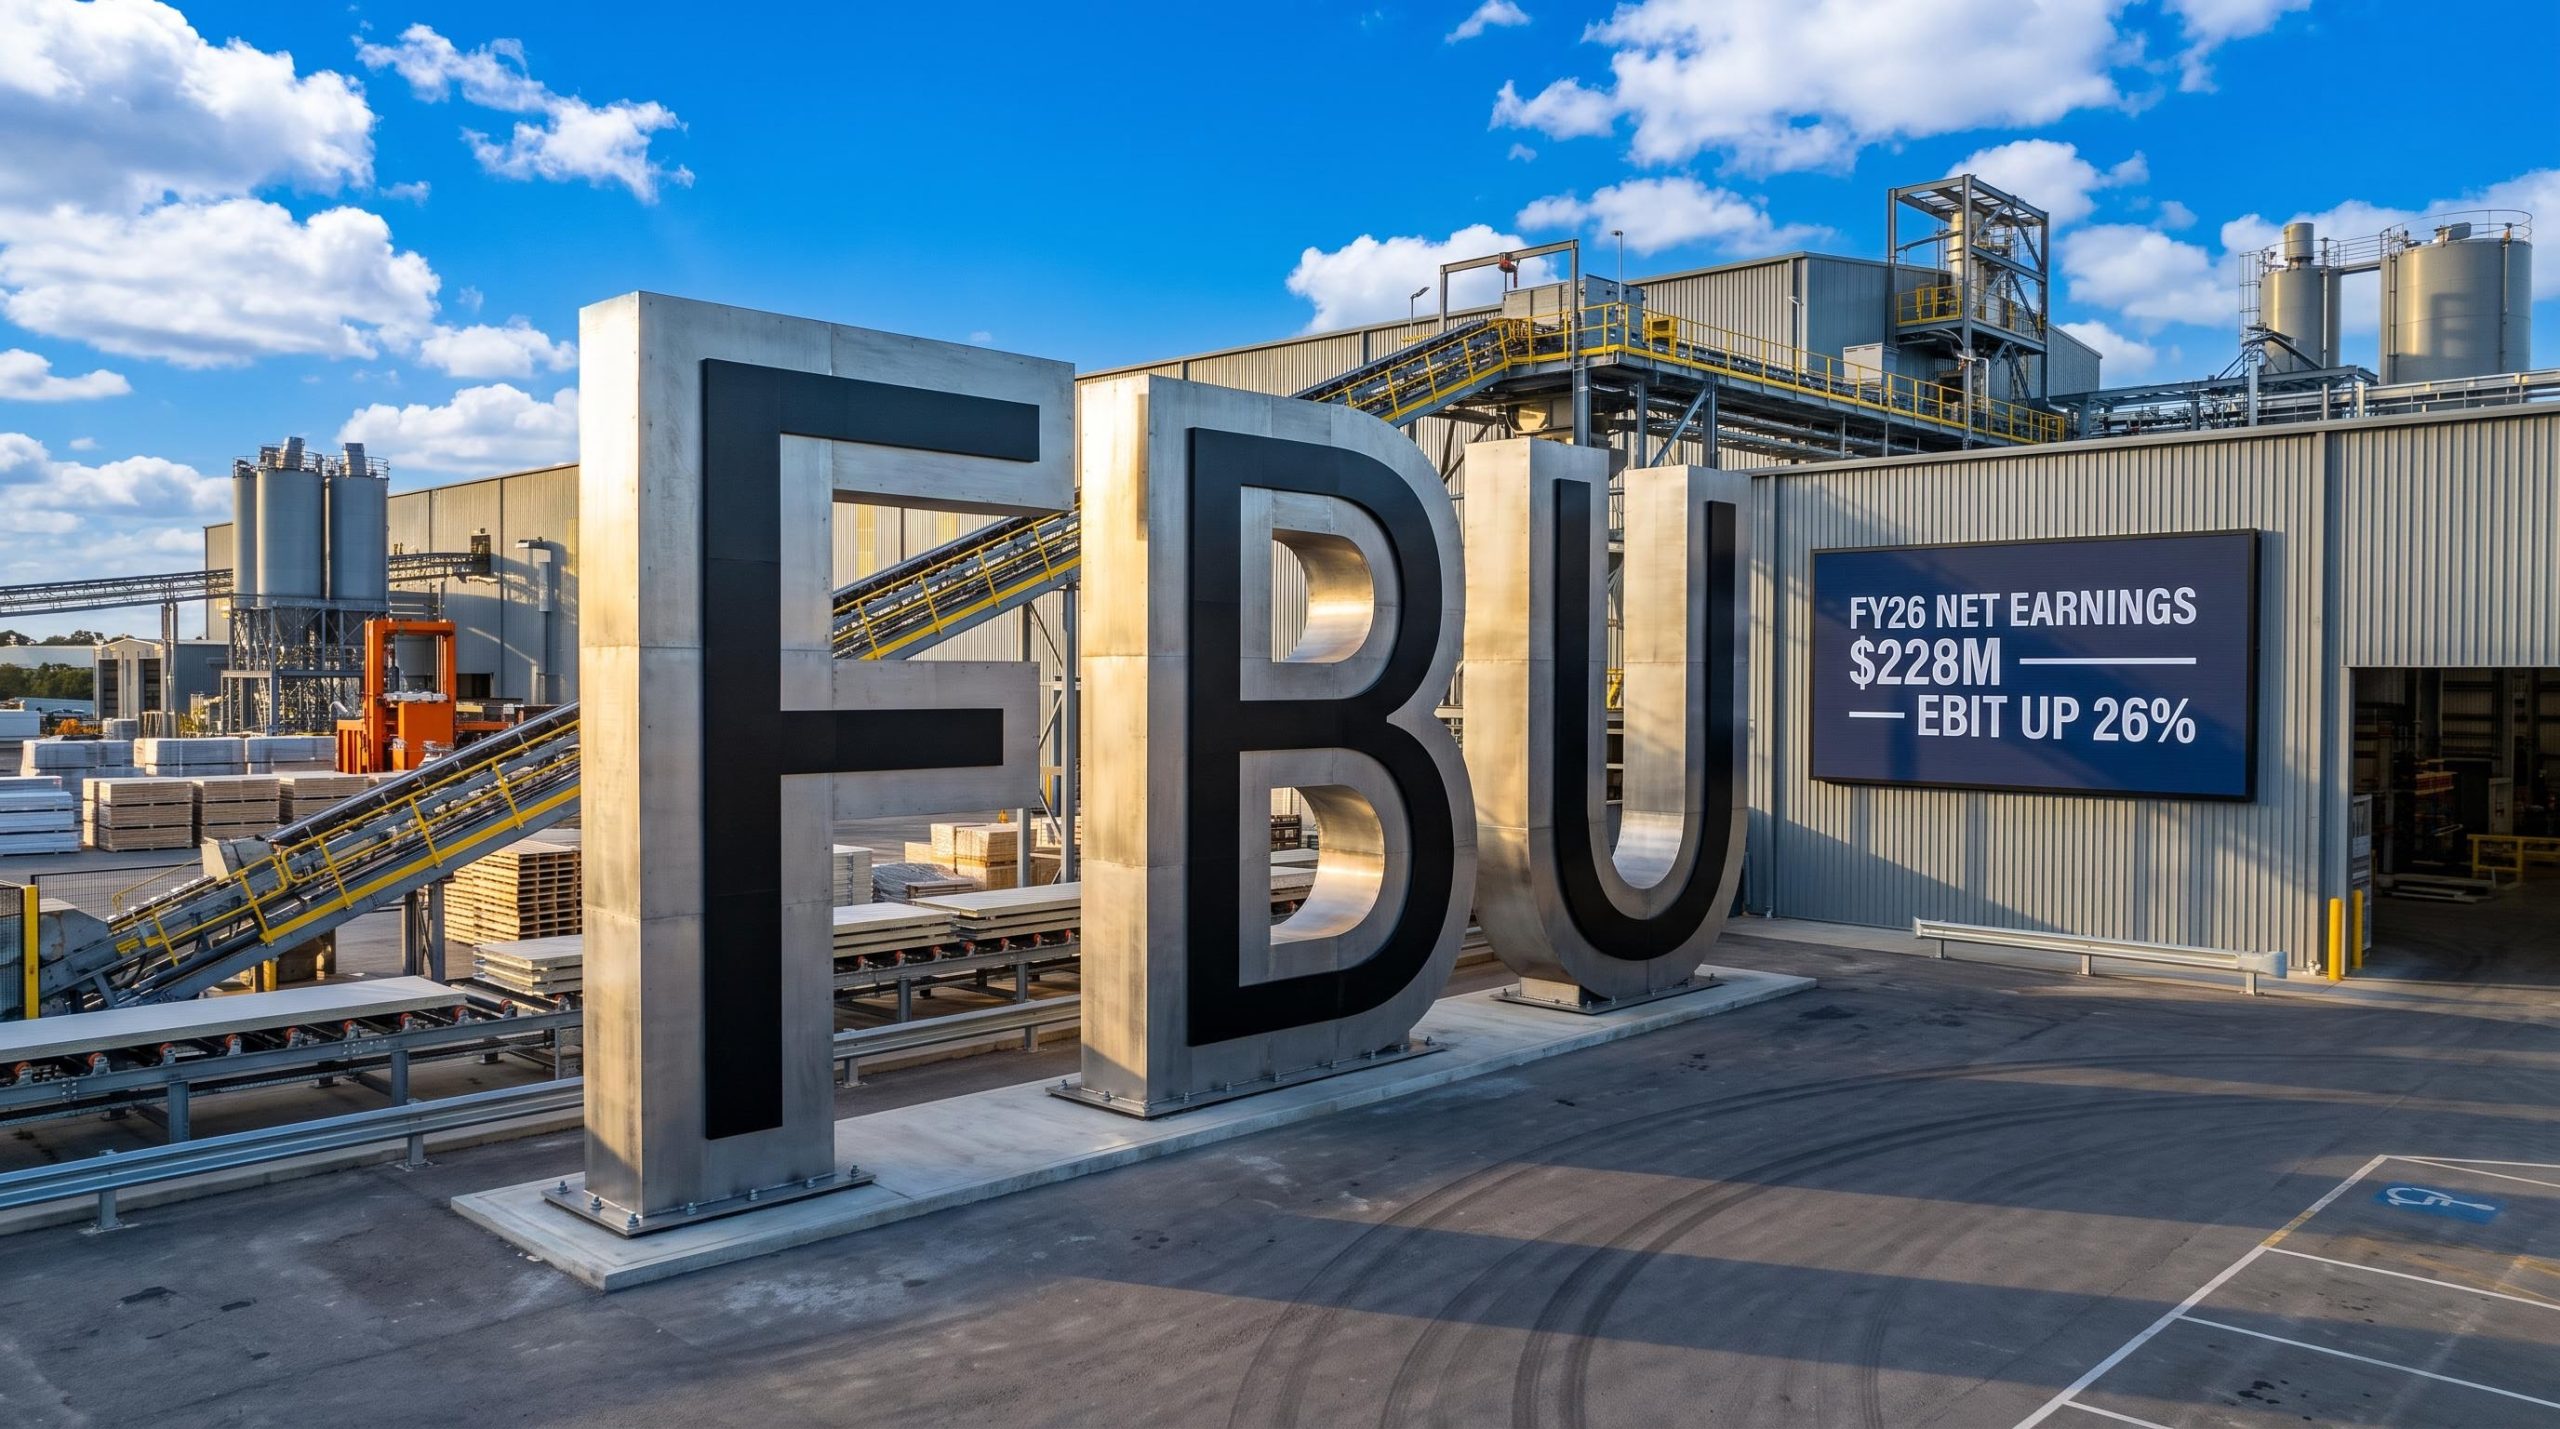
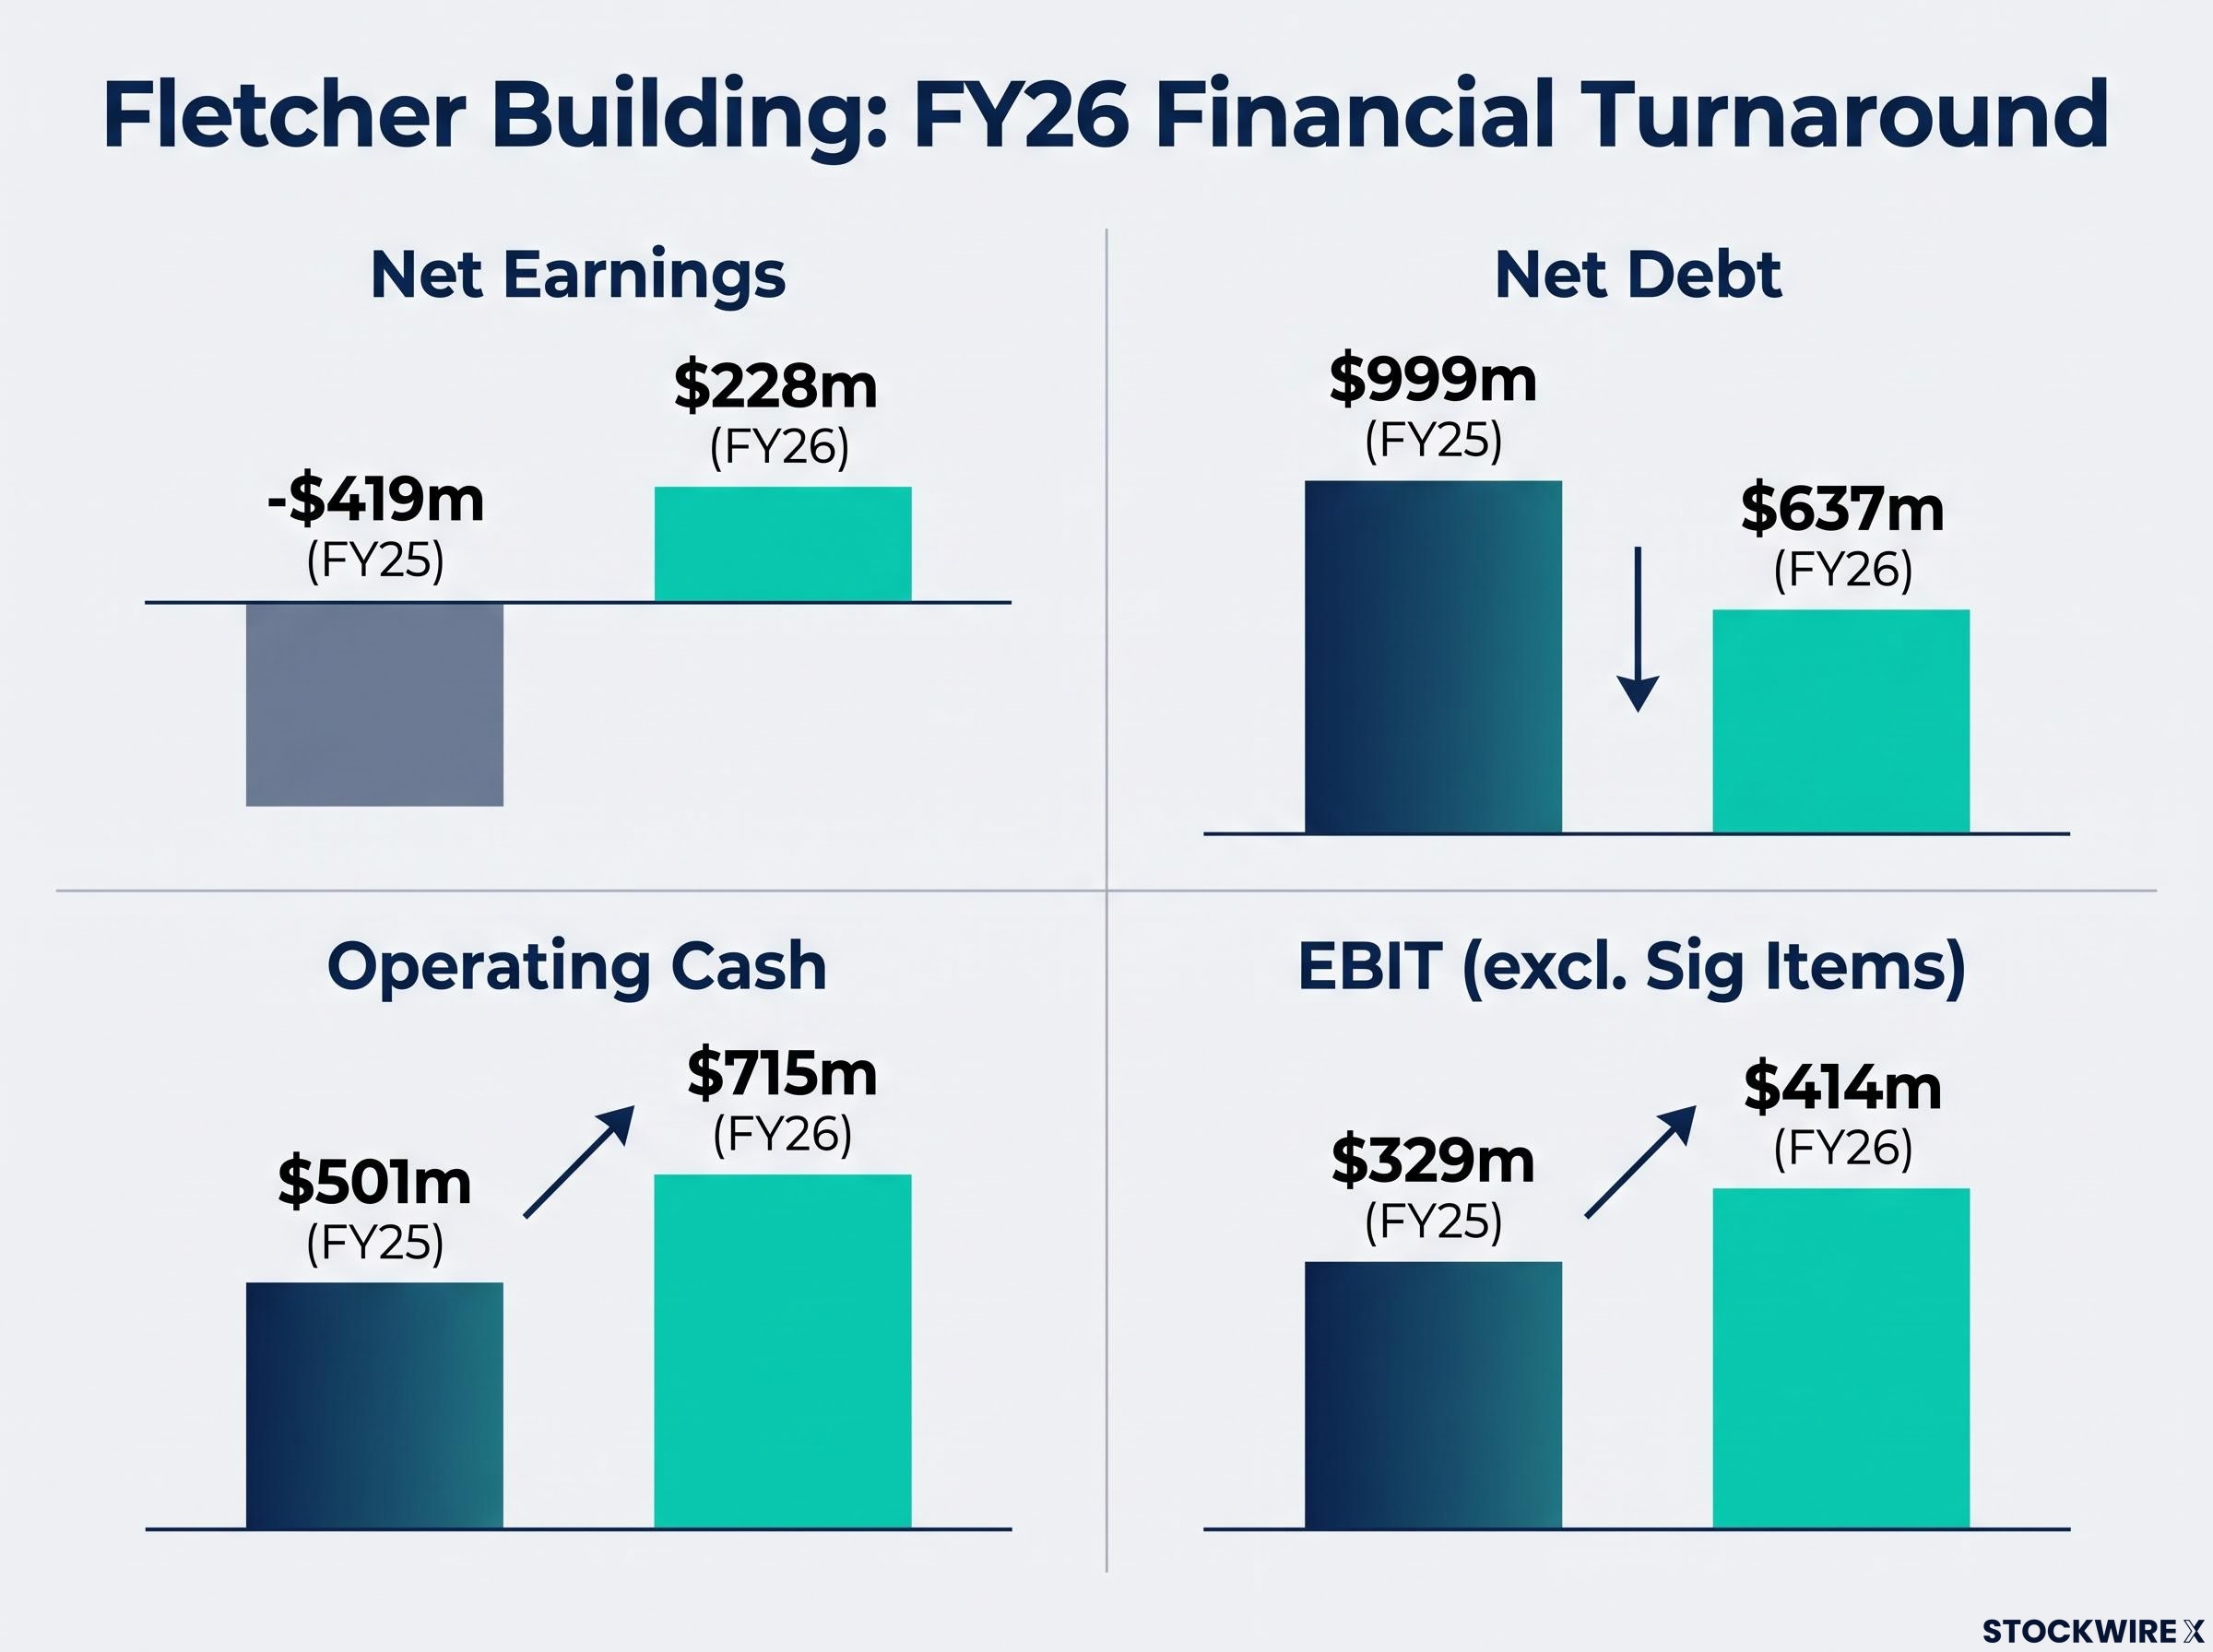
Fletcher Building (ASX/NZX: FBU) returned to profit in its FY26 results, recording net earnings of $228 million for the 12 months to 30 June 2026, a $647 million turnaround from the FY25 net loss of $419 million.
EBIT from continuing operations before Significant Items reached $414 million, up 26% ($85 million) on the prior year. The result followed a strategic reset built around portfolio simplification, headlined by the divestment of the Construction division.
For investors, the FY26 outcome frames Fletcher Building as a turnaround story with a materially repaired balance sheet and a leaner operating base heading into an expected demand recovery.
When big ASX news breaks, our subscribers know first
FY26 financial results at a glance
The dominant theme across the FY26 results was the year-on-year swing. Group revenue from continuing operations rose 7.3% to $6.0 billion, while EBIT margin expanded to 6.9% from 5.9%.
Net earnings of $228 million delivered earnings per share of 21.2 cents, against a 41.4 cent loss in FY25. This marked the first positive EPS since FY23. Net cash from operating activities improved to $715 million, up $214 million, and net debt was cut to $637 million from $999 million.
EBIT finished approximately 3% above the July guidance range, with the variance primarily attributable to the finalisation of employee-related provisions.
| Metric | FY26 | FY25 | Change |
|---|---|---|---|
| Revenue | $6.0b | $5.59b | +7.3% |
| EBIT (continuing, before Sig Items) | $414m | $329m | +$85m |
| EBIT margin | 6.9% | 5.9% | +100bps |
| Net earnings | $228m | -$419m | +$647m |
| Net cash from operating activities | $715m | $501m | +$214m |
| Net debt | $637m | $999m | -$362m |
| ROIC | 5.3% | 4.1% | +120bps |
Andrew Reding, Managing Director & CEO
“Fletcher Building is significantly more resilient than it was twelve months ago… the strategic reset we set out last year is now starting to deliver tangible results.”
The strategic reset behind the turnaround
The recovery was underpinned by a deliberate strategic reset centred on portfolio simplification. Over FY26, the Group divested non-core operating units, most notably the Construction division, with its New Zealand construction businesses sold to VINCI and completed on 29 May 2026.
The Construction division sale to VINCI, completed on 29 May 2026, removed FBU’s exposure to the high-risk, project-delivery business model that had historically contributed to contract disputes, cost overruns, and working capital pressure across the group.
Additional divestments spanned Reinforcing & Wire, NX2 and CSP, alongside site closures including MADE by Laminex and Clever Core. Proceeds were directed towards strengthening the balance sheet, with net debt reduced to $637 million and Group gearing after hedging falling to 15% from 22%.
Key completed turnaround actions included:
-
Construction division divested; Reinforcing & Wire divested, with the transaction expected to close in Q1 FY27
-
Frame & Truss repurposed to the former Clever Core site, delivering an approximate $100 million cash benefit
-
Simplified capital structure and USPP exit
-
Vivid Living retirement operations classified as held for sale
The result is a leaner, more cash-focused business positioned for the next stage of recovery.
How core divisions performed
Core manufacturing divisions led the improvement, offsetting softer conditions in the residential cycle.
Manufacturing divisions led the improvement
Light Building Products delivered EBIT before Significant Items of $246 million, up 22%, with margin expanding 110bps to 10.7%. Winstone Wallboards volumes rose 4%, while Laminex AU domestic volumes increased 6%.
Heavy Building Materials recorded EBIT of $108 million, up 8%. The steel businesses generated approximately $10 million of EBIT in the second half, continuing to outperform the broader market.
Distribution returned to profit in 2H
Distribution EBIT of $12 million was down 37% for the full year, but the division returned to profitability in 2H FY26, delivering $15.8 million of EBIT in the half. Frame & Truss internal production grew 27%, and the new Cavendish Drive plant became operational, providing an approximate 40% uplift in finished product output per direct labour hour.
Residential softened on a subdued market
Residential took 536 units to profit, compared to 666 in FY25, a reduction of 130 units. EBIT of $42 million was down 21%, at an 8.8% margin, reflecting a subdued property market.
| Division | Gross Revenue | EBIT (ex Sig Items) | EBIT Margin | ROIC |
|---|---|---|---|---|
| Light Building Products | $2,305m | $246m | 10.7% | 7.2% |
| Heavy Building Materials | $2,033m | $108m | 5.3% | 5.1% |
| Distribution | $1,577m | $12m | 0.8% | 1.4% |
| Residential | $478m | $42m | 8.8% | 3.7% |
Manufacturing resilience is helping to offset a weak construction and residential cycle.
Understanding ROIC — why it matters to investors
Return on Invested Capital (ROIC) measures how efficiently a company generates profit from the capital deployed across its business. A higher ROIC indicates that each dollar invested is working harder to produce earnings.
Fletcher Building’s management repeatedly flags this metric. Group ROIC (before Significant Items) improved to 5.3% from 4.1%, yet management acknowledged returns remain below acceptable levels.
For the investment case, the rising ROIC signals that the turnaround is beginning to convert into better capital efficiency. Management has been candid that there is, in their own words, still more work to do to achieve targeted returns.
A stronger balance sheet and cash position
Net cash from operating activities reached $715 million, up $214 million, reflecting higher earnings across core operations and lower Construction legacy cash outflows.
Net debt was cut by $362 million to $637 million, driven by divestment proceeds and surplus property land sales. The key contributors to the reduction were:
Surplus property land sales contributed meaningfully to the debt reduction, with the Felix Street Auckland property alone generating $53.5 million in proceeds and an $11 million EBIT gain while also avoiding approximately $30 million in capital expenditure that would otherwise have been required.
-
Net divestment proceeds of $296 million
-
Surplus property land sales
-
Improved operating cash generation
Total liquidity stood at approximately $1.2 billion, including undrawn credit lines of $1 billion, with an average interest rate on debt of 6.1% including line fees.
FY27 capital expenditure is expected to step down materially to approximately $170 million, from $288 million, consistent with a shift to a capital-disciplined, cash-focused business. The Board did not declare an FY26 dividend, with policy to be reset once the Group is generating positive free cashflow and net debt sits in the lower half of the target range.
Outlook: positioned for recovery from 2027
Market volumes recovered gradually through the second half of FY26. However, management cautioned that the uncertain economic, political and geopolitical backdrop is expected to weigh on performance in the first half of FY27.
A meaningful recovery in underlying volumes is not expected until calendar year 2027. Management pointed to positive infrastructure exposure in both New Zealand and Australia as a tailwind, including a strong Australian pipeline spanning transport, energy, water and Olympic facilities.
Andrew Reding, Managing Director & CEO
“Our priorities remain clear: maintain cost and capital discipline, complete the remaining legacy workstreams, and position the Group to capture upside once demand improves.”
For investors, Fletcher Building presents as a leveraged recovery play on the New Zealand and Australian building cycle, entering an expected 2027 upturn with a de-risked balance sheet.
Stay Ahead on ASX Industrials News
Get FREE breaking ASX announcements delivered to your inbox within minutes of release, complete with in-depth analysis already done for you. Over 20,000 active subscribers trust Big News Blast to keep them ahead of the market. Click the “Free Alerts” button to start receiving real-time coverage the moment market-moving news breaks.