
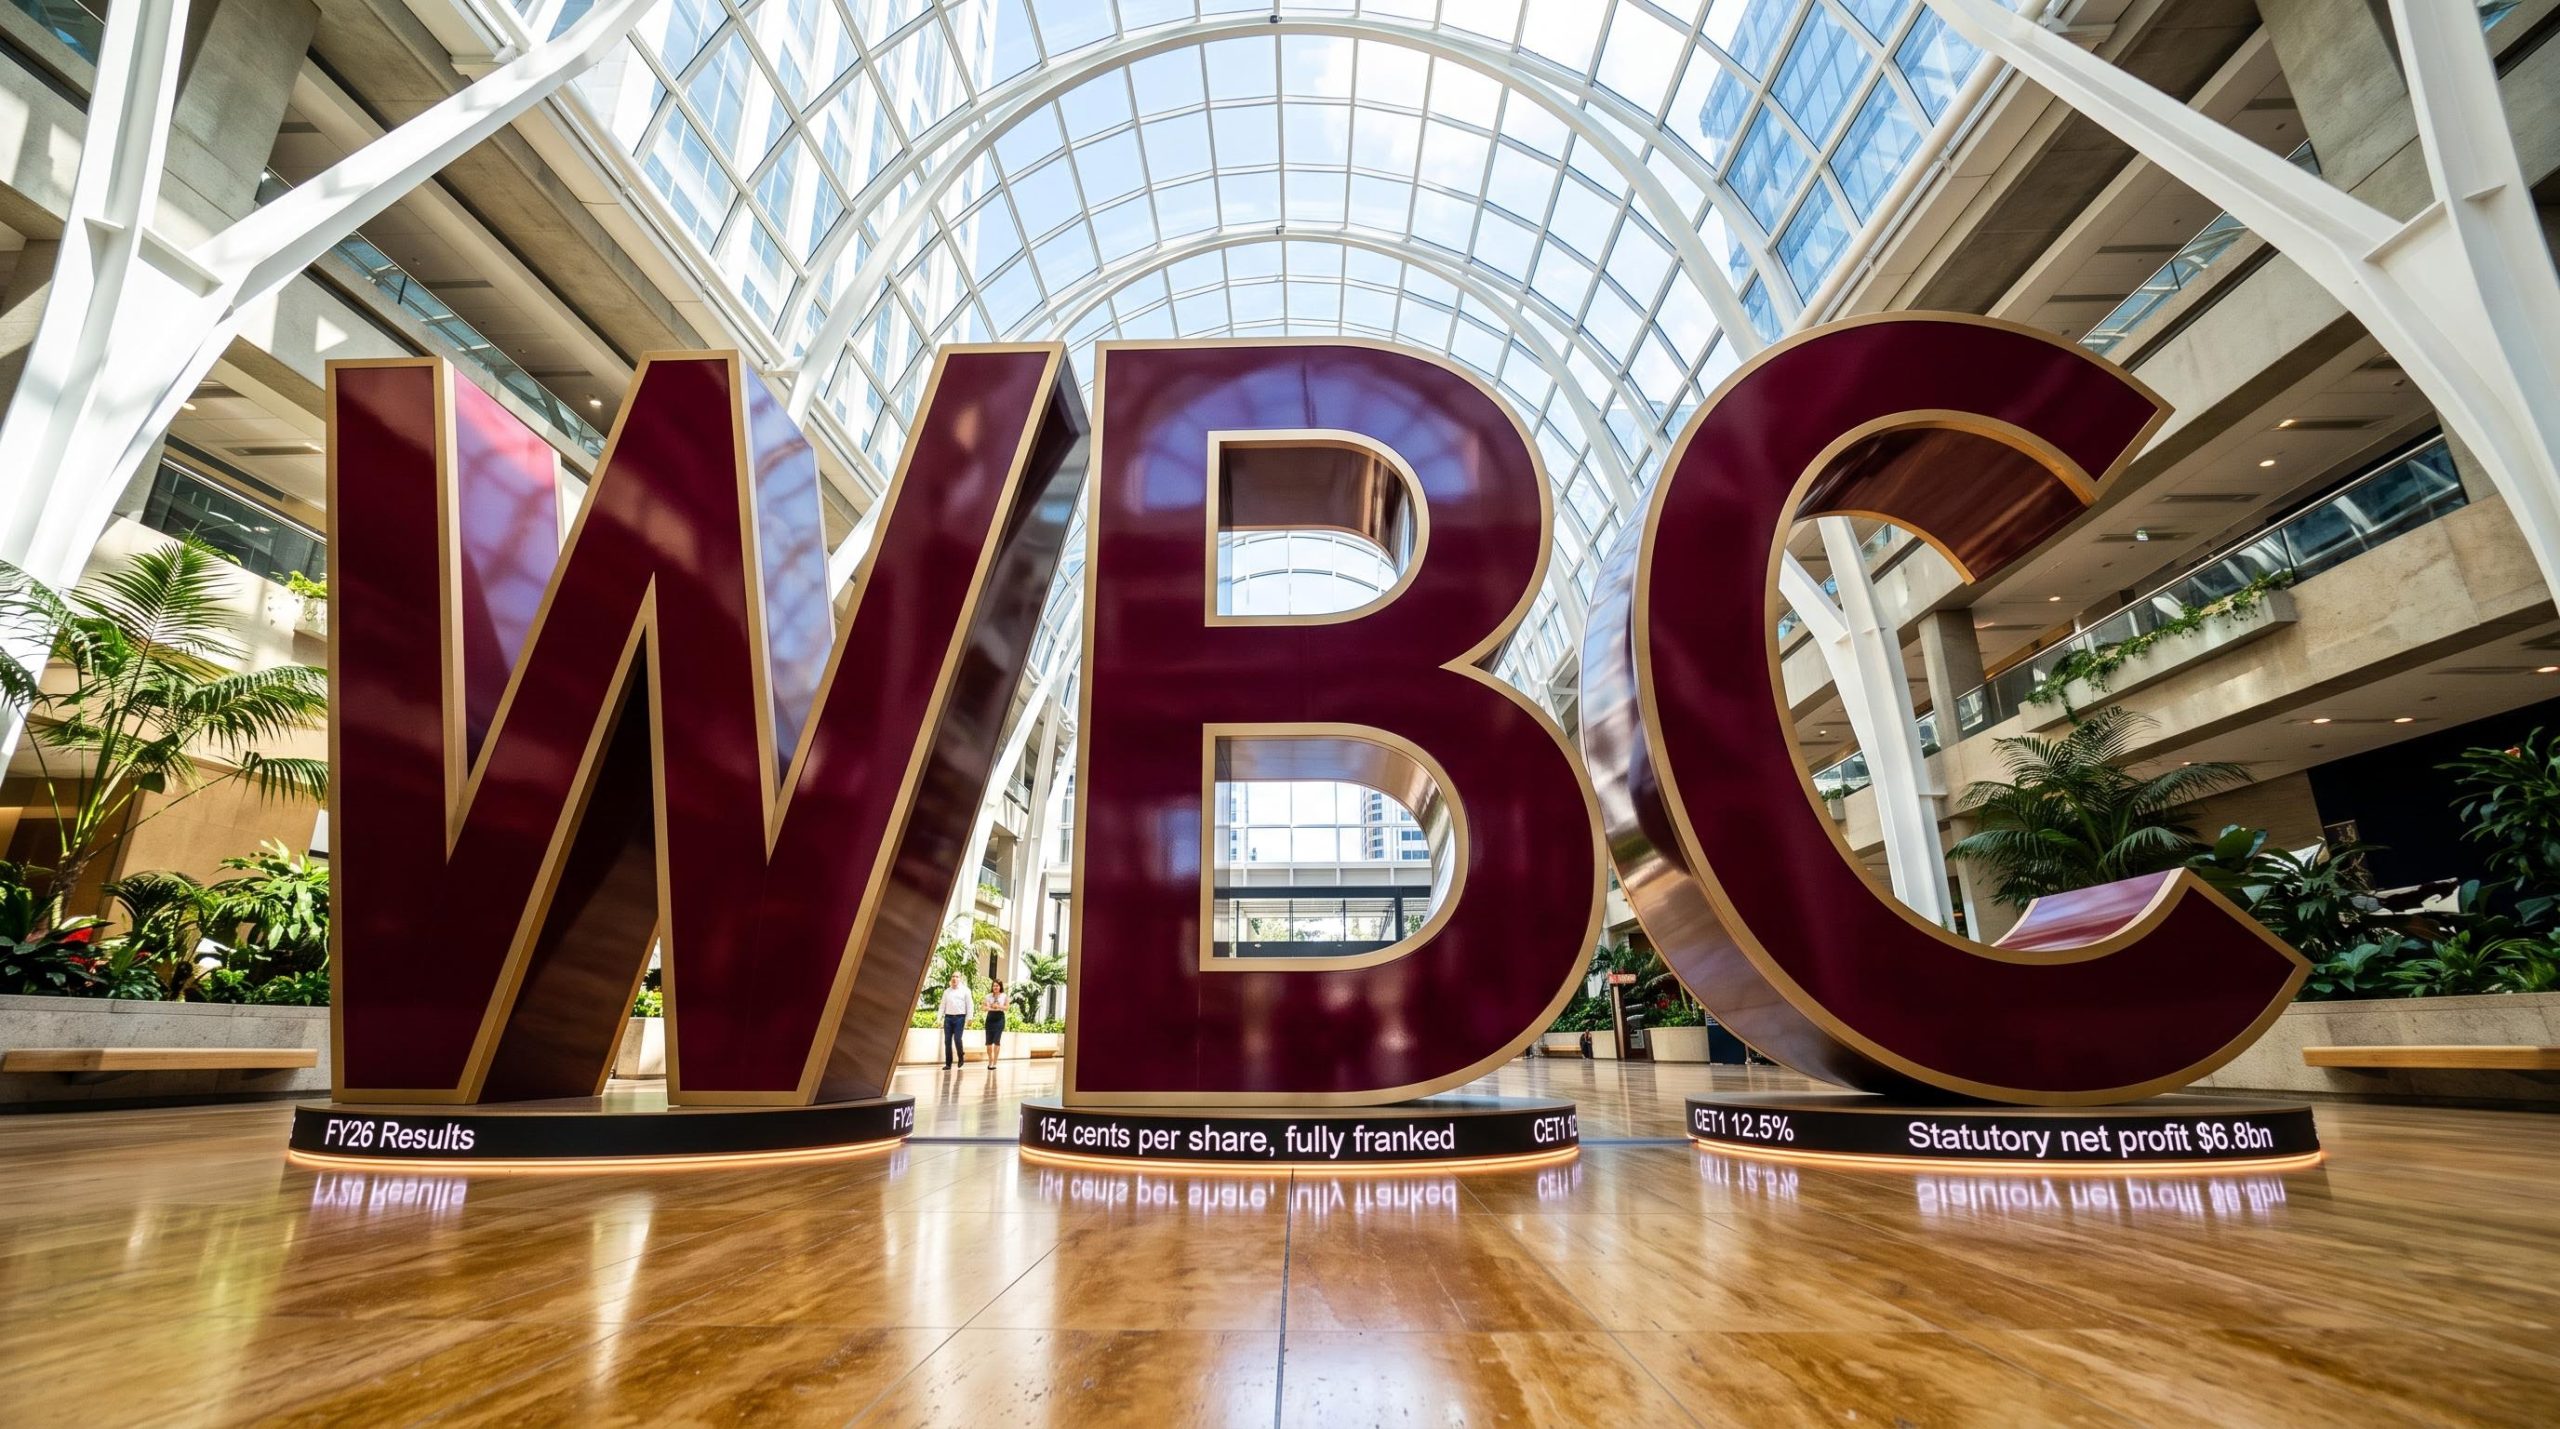
FY26 results: $6.8bn statutory profit and a 154c dividend
Westpac Banking Corporation delivered a statutory net profit of $6.8bn for FY26, the year ended September 2026, down 1% on FY25. Net profit excluding Notable Items was $7.0bn, flat on the prior year, according to the full year result released on 2 November 2026.
Shareholders received total dividends of 154 cents per share, fully franked, up 1% on FY25. That includes a final dividend of 77 cents per share, equating to a payout ratio of 77% on a statutory net profit basis and 75% excluding Notable Items.
Anthony Miller, Chief Executive Officer
“This year we’ve built momentum across the bank, delivering a solid result while investing in Westpac’s transformation…”
Key headline measures for the year:
- CET1 capital ratio: 12.5%, above the target of 11.25% in normal operating conditions
- Pre-provision profit: up 4% to $10.9bn
- ROTE excluding Notable Items: 11.1%, up 14bps on FY25
When big ASX news breaks, our subscribers know first
Balance sheet momentum driven by business lending
Deposits and lending growth
Deposits grew 6% and loans grew 5%, reflecting what Westpac described as solid deposit growth across all segments and a tilt to Business and Institutional lending. Customer deposits rose from $723.0bn at Sep-25 to $745.2bn at Mar-26 and $766.2bn at Sep-26. Loans moved from $856.4bn to $890.3bn and then $901.3bn across the same dates.
Business lending increased 12%, including strong growth in the target sectors of agriculture, health and professional services. Institutional lending rose 18%, supported by lending to existing customers and strong credit demand across sectors including energy, infrastructure and resources.
Australian housing loans, excluding RAMS, increased 7%, or 1.1x the APRA housing system. Business and Institutional deposits increased 4% and 14% respectively, while Australian household deposit growth was 1.0x the APRA system.
Financial summary table
The table below shows the result excluding Notable Items.
| Metric | FY26 | FY25 | Movement |
|---|---|---|---|
| Net interest income | $19,687M | $19,473M | 1% |
| Operating expenses | $11,781M | $11,916M | (1%) |
| Pre-provision profit | $10,927M | $10,548M | 4% |
| Impairment charges | $864M | $424M | 104% |
| Net interest margin (NIM) | 1.87% | 1.94% | (7 bps) |
| Expense to income ratio | 51.88% | 53.04% | (116 bps) |
Costs fell 1% and the expense to income ratio improved by 116bps. Against that, NIM compressed by 7bps and impairment charges more than doubled, up 104%.
Segment pre-provision profit
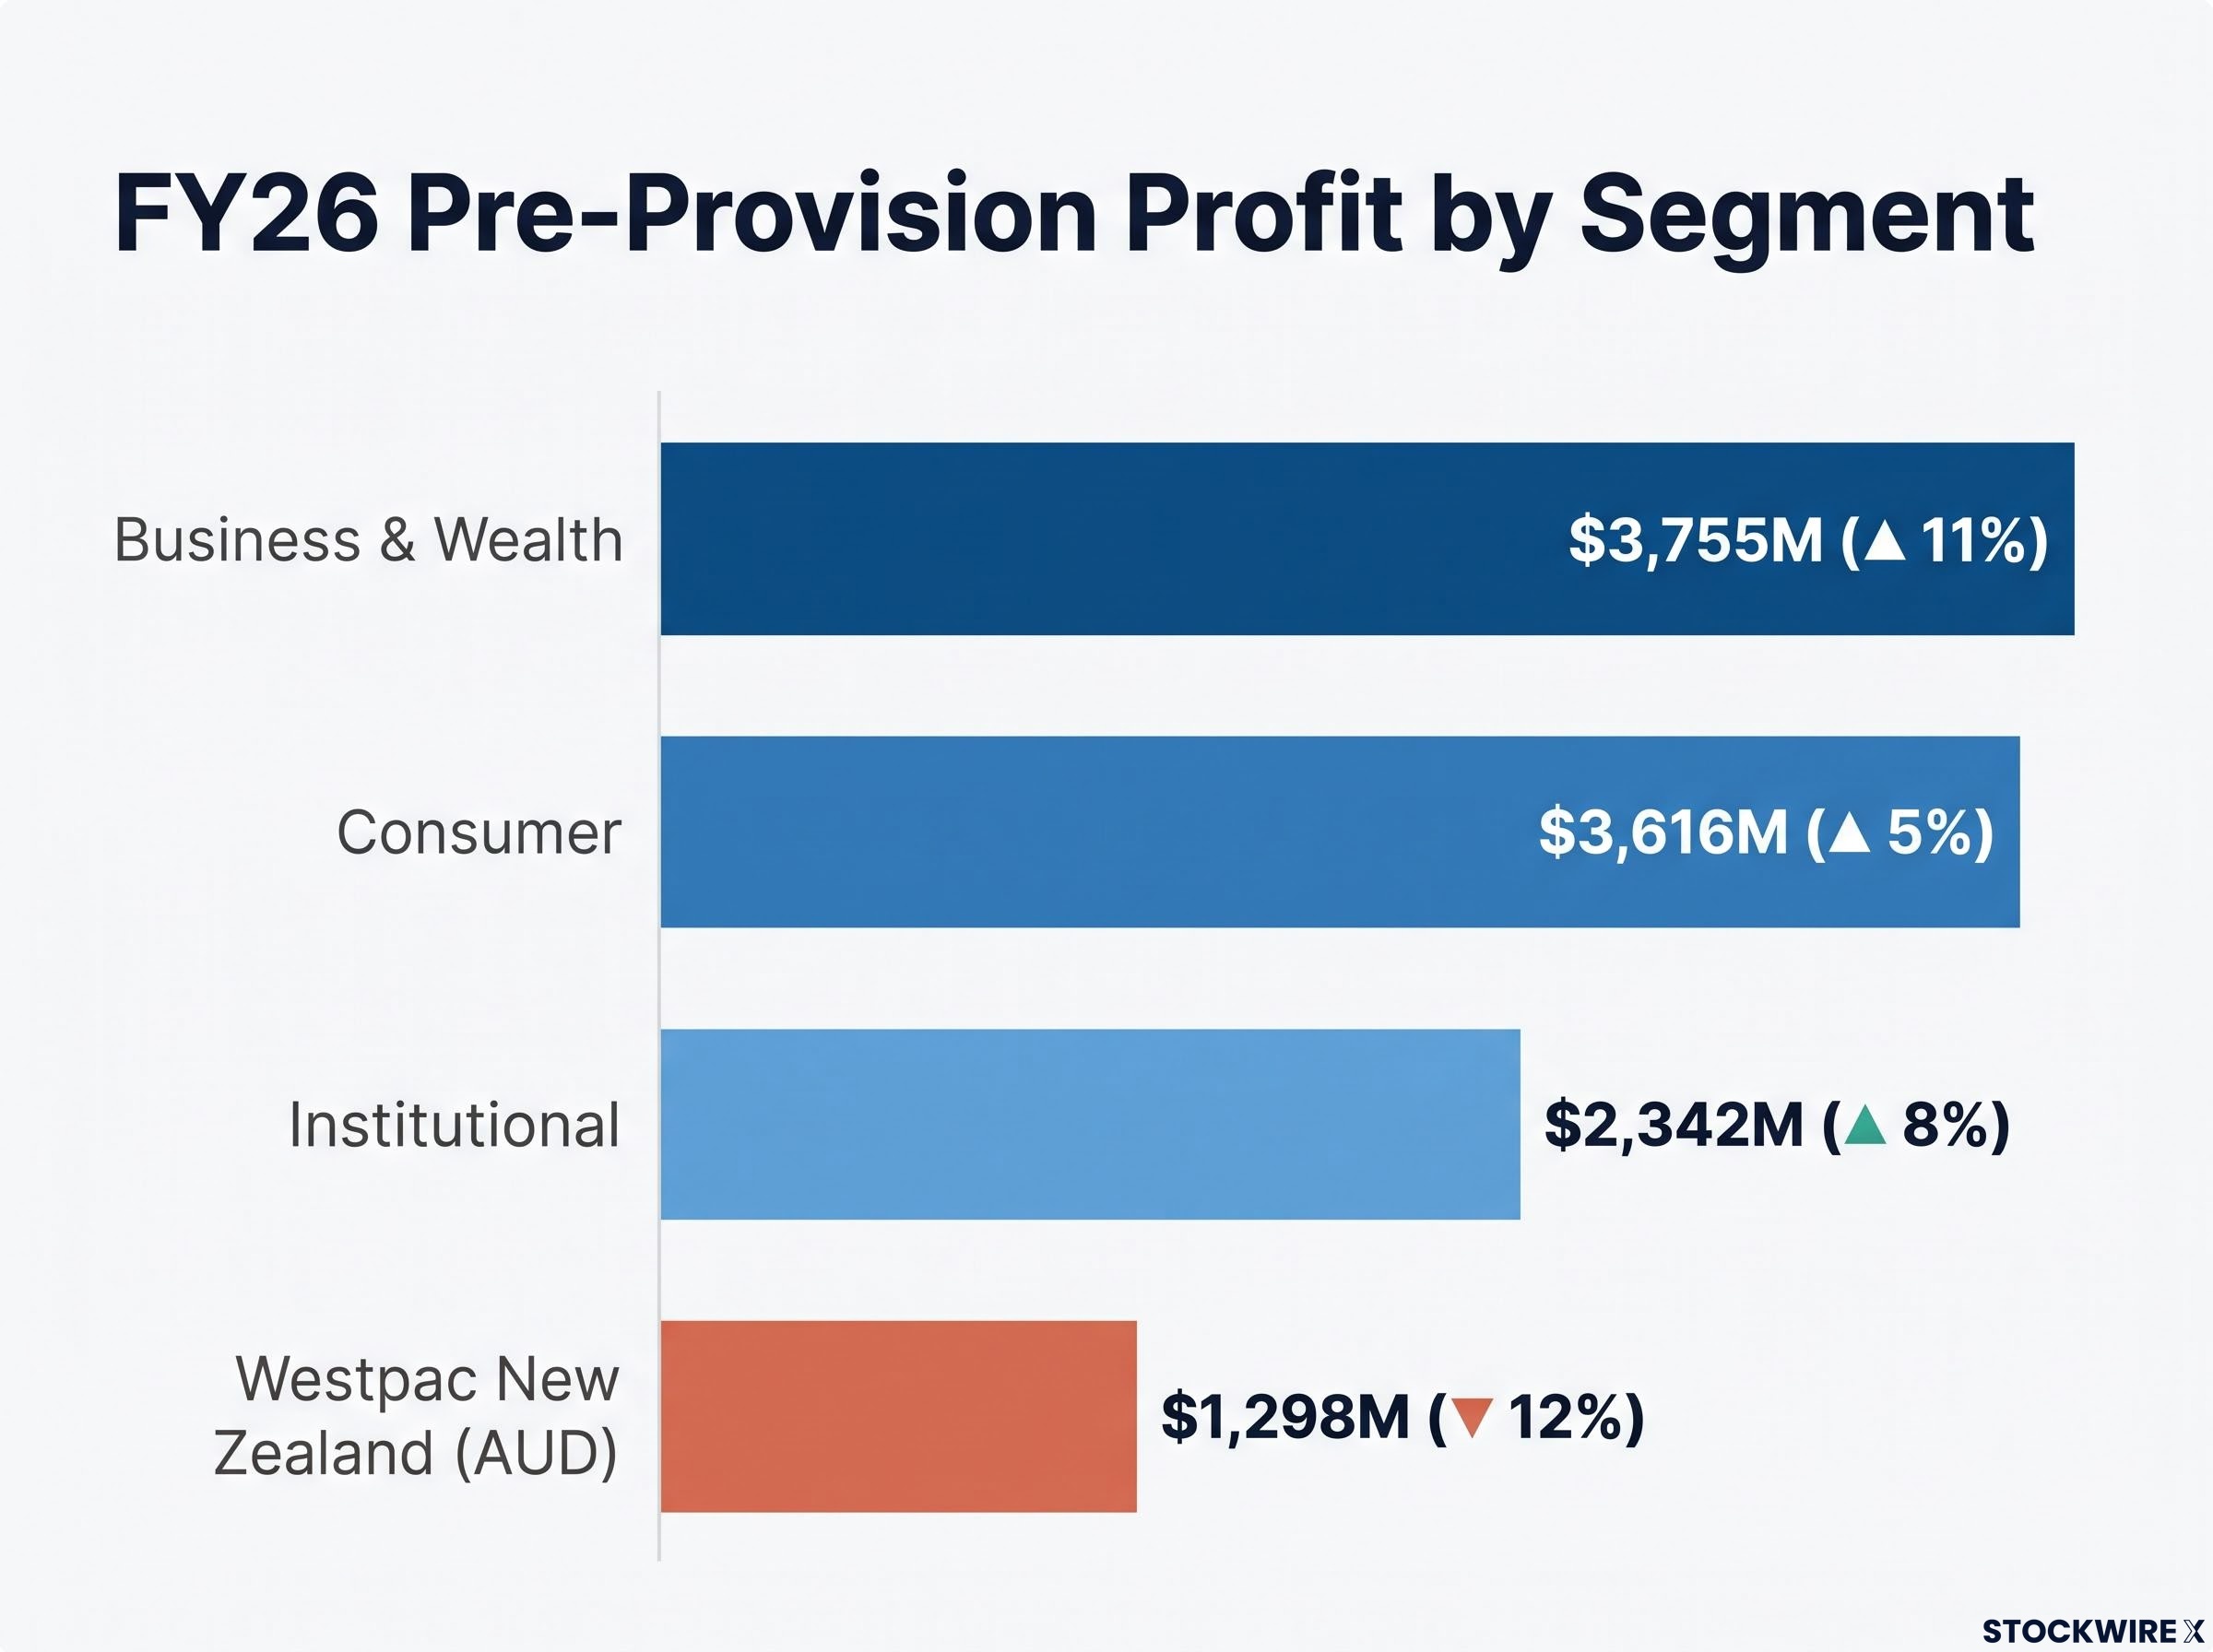
Pre-provision profit by segment was:
- Consumer: $3,616M, up 5%
- Business & Wealth: $3,755M, up 11%
- Institutional: $2,342M, up 8%
- Westpac New Zealand (AUD): $1,298M, down 12%
Capital strength and credit quality
The CET1 capital ratio of 12.5% compares with the target of 11.25% in normal operating conditions. This equates to $2.9 billion of capital above the target after payment of the 2026 final dividend.
The ratio decreased by 7bps on Sep-25, as net profit and the sale of the RAMS loan portfolio, which completed on 1 August 2026, were more than offset by dividend payments and higher Risk Weighted Assets.
The RAMS portfolio sale, a roughly $15.4 billion divestment to a consortium of Pepper Money, KKR and PIMCO, reduced operational complexity and added capital, though the benefit to the CET1 ratio was absorbed by dividends and higher risk weighted assets.
On funding and liquidity, the deposit to loan ratio was 85.5%, up 59bps on Sep-25. The September 2026 quarterly average liquidity coverage ratio was 137% and the net stable funding ratio was 113%, both described as well above regulatory minimums. The group raised $40 billion of new long term wholesale funding.
Stressed exposures as a percentage of total committed exposures (TCE) declined 11bps to 1.17%. Given economic and geopolitical uncertainty, Westpac applied management judgement through new overlays for energy-intensive sectors and discretionary spending. Credit impairment provisions increased to $5.2 billion over the year, and the ratio of collectively assessed provisions to credit RWA was higher at 127 basis points.
For investors, the combination points to a capital buffer above target alongside a larger provisioning base.
How banking works: why CET1 and net interest margin matter
Two measures feature prominently in bank results. The CET1 ratio compares a bank’s highest-quality capital, which can absorb losses, with its risk weighted assets. A higher ratio means a larger buffer against losses.
Net interest margin measures the gap between what a bank earns on its loans and what it pays to fund them. A narrower margin means less income from each dollar of lending.
For Westpac, a CET1 ratio of 12.5% compares with the 11.25% target, and the company said it provides capacity to support customers while accelerating execution of its strategic priorities. NIM was 1.87%, down from 1.94% in FY25.
Five strategic priorities and transformation progress
Westpac reports against five strategic priorities that support its ambition to be its customers’ number one bank and partner through life:
- Performance: balancing growth with returns
- Customer: improving service for deeper relationships
- People: creating the best workplace
- Transformation: investing for the future
- Risk: excellence in execution
Investment spend was 9.4% of revenue, supporting the transformation agenda to simplify the bank and improve customer experiences.
On the customer side, Consumer and Business Net Promoter Score each improved by 4 points. Book a Banker has facilitated 100,000+ home loan appointments since February, and enhanced scam prevention measures contributed to a 23% reduction in reported customer scam losses.
On technology and people, 95% of employees use AI tools monthly. UNITE delivered all key FY26 milestones, including the migration of ~60,000 Asgard customers to Panorama. BizEdge improved average business lending time to decision by 45%.
On housing, Westpac helped more than 190,000 Australians purchase a home during the year. It has announced a target to facilitate $100 billion in housing related lending by 2030, focused on new housing supply, social and affordable housing, opportunities for renters and pathways to home ownership.
What happens next for Westpac
Several milestones and targets frame the period ahead:
- Catalyst: the new way of working designed to improve how Westpac delivers change and transformation launched on 1 October 2026.
- FY29 targets: Westpac targets a cost to income ratio below the peer average and return on tangible equity above the peer average by FY29.
- Housing target: the target to facilitate $100 billion in housing related lending is set for 2030.
On the outlook, Westpac noted that inflation remains above the Reserve Bank’s target range and that interest rates are likely to remain elevated into 2027. Management also said demand for credit remains strong across its Business and Institutional customer base.
Stay Ahead on Banking and Finance News
Get FREE breaking ASX news from the finance sector delivered to your inbox within minutes of release, complete with in-depth analysis. Join 20,000+ subscribers already getting the news first. Click the “Free Alerts” button at Big News Blast to receive alerts the moment market-moving announcements break.