
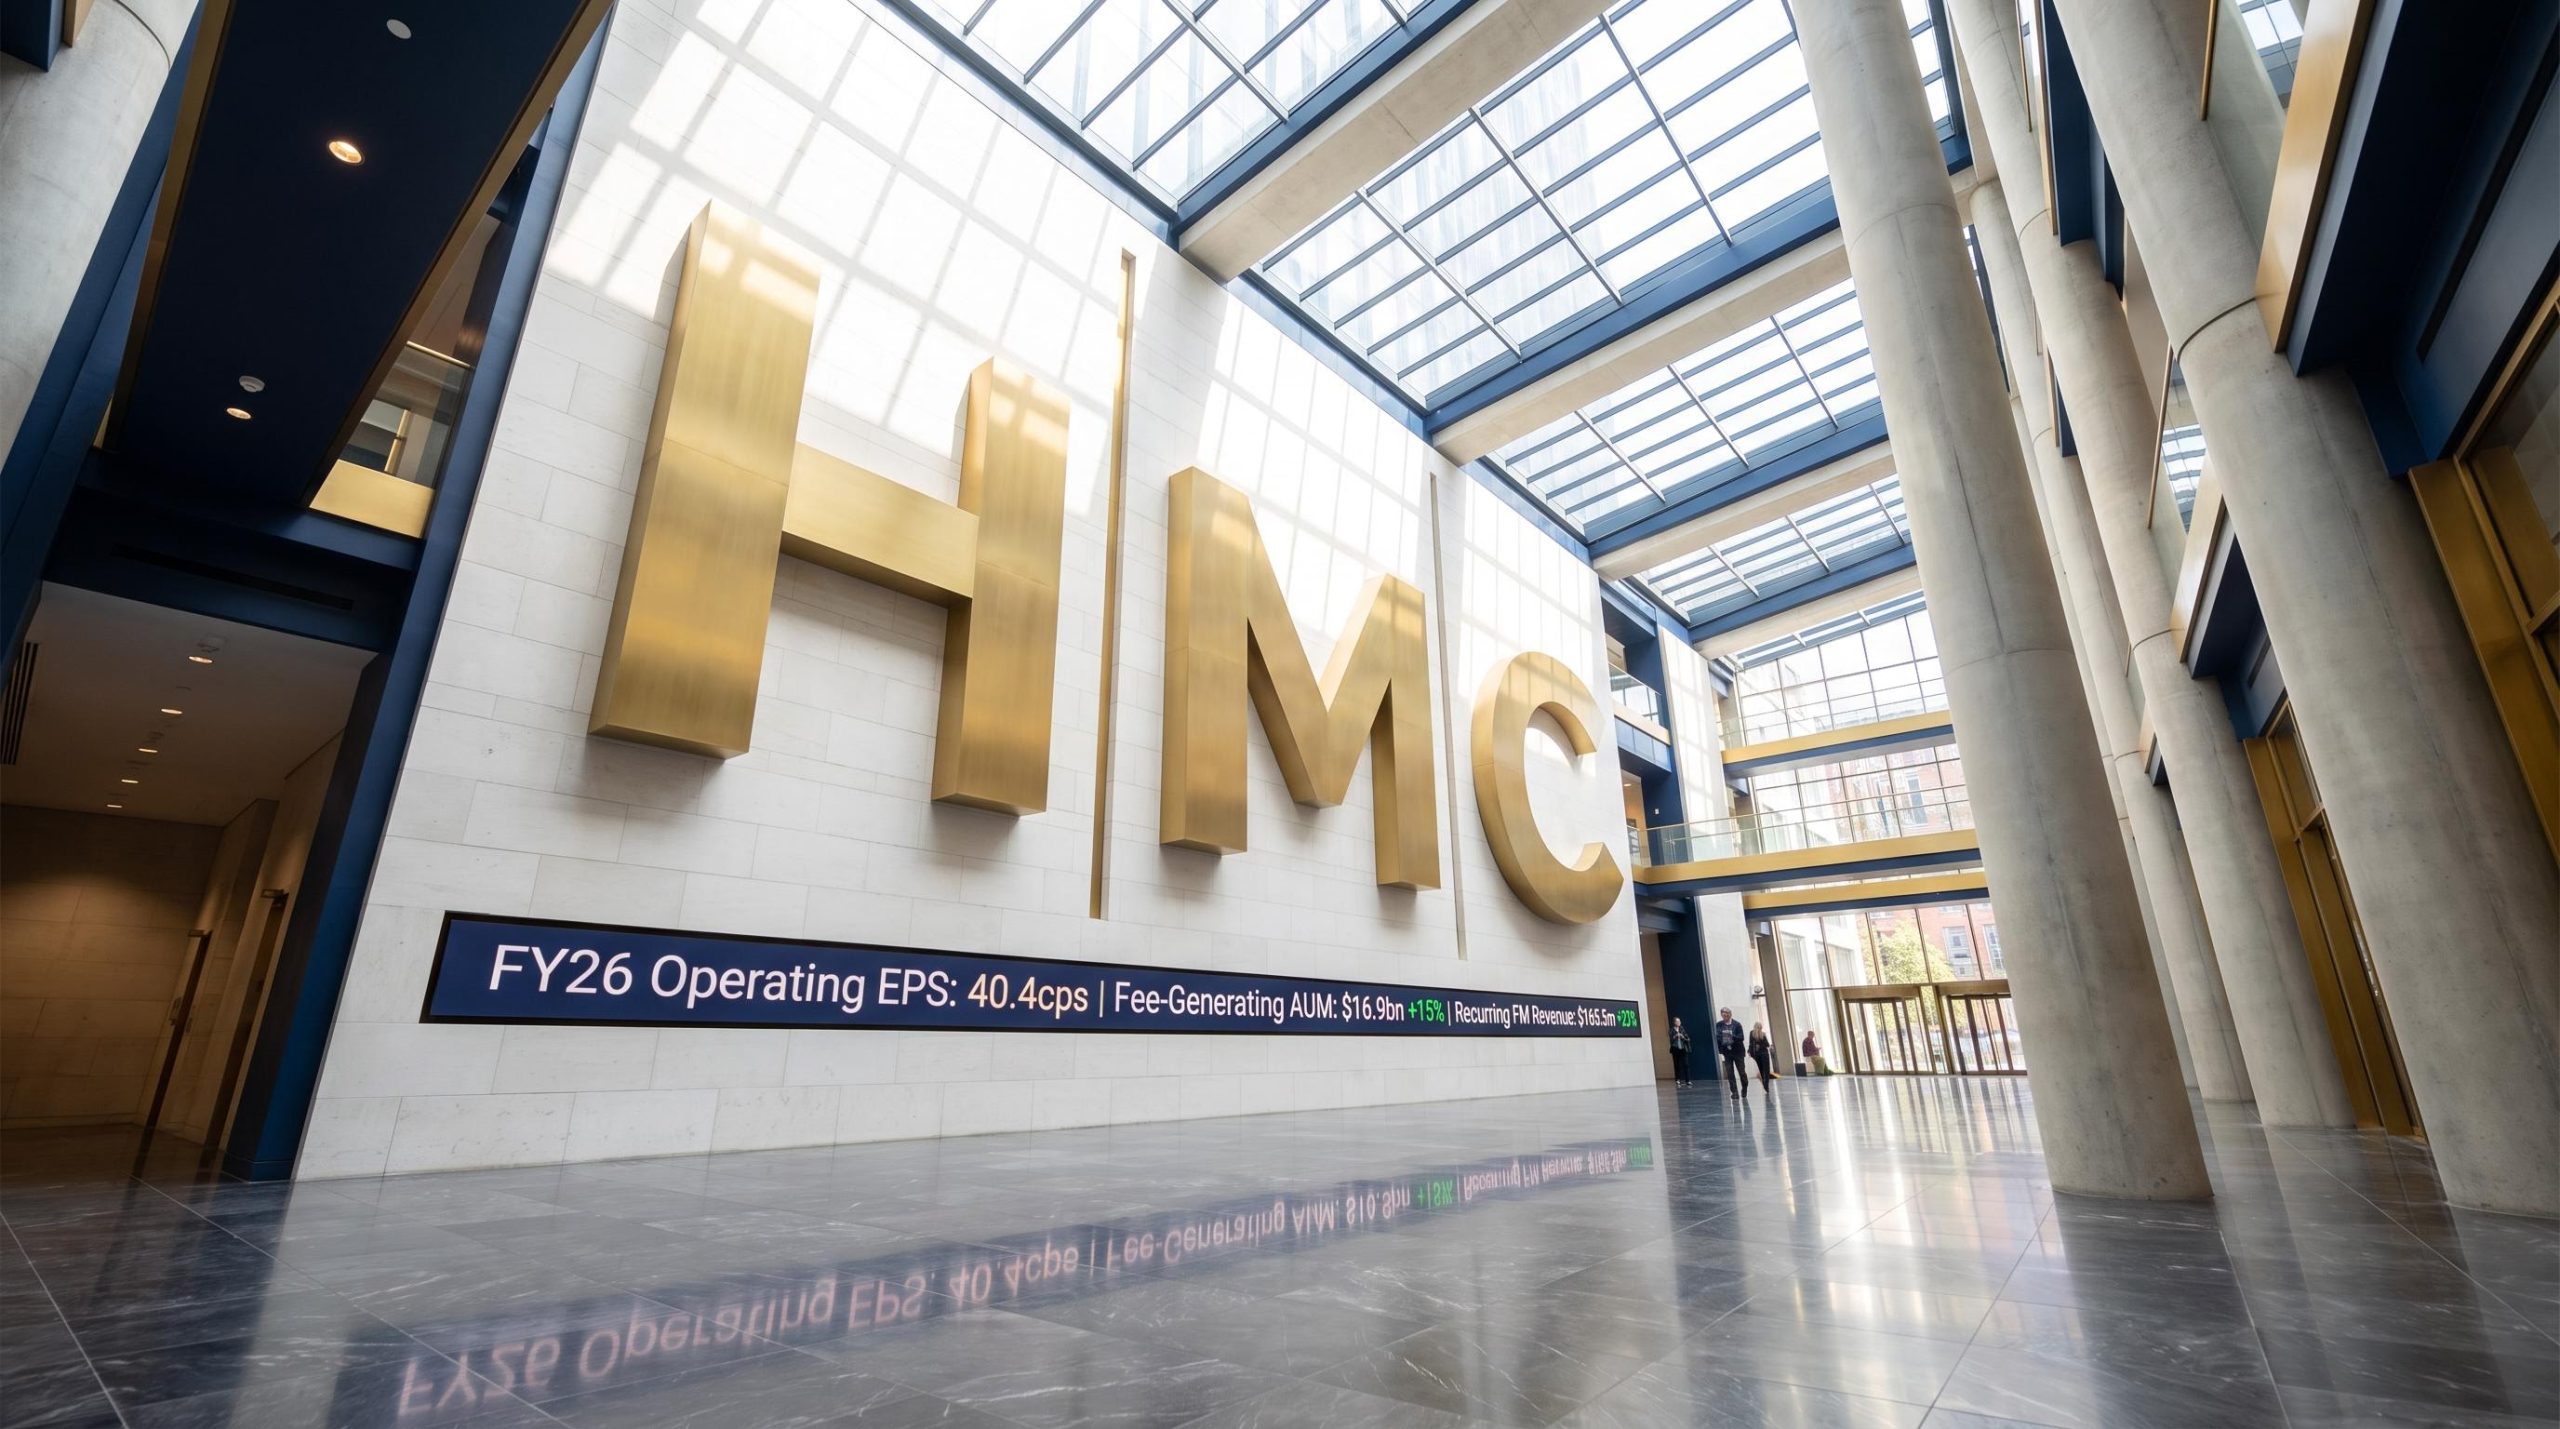
HMC Capital delivers FY26 operating EPS of 40.4c in line with guidance
In its FY26 results presentation dated 26 August 2026, HMC Capital reported an operating EPS (pre-tax) of 40.4cps, in line with guidance. Management, led by Group Managing Director and CEO David Di Pilla, outlined a completed reporting period in which the company delivered on its earnings target while repositioning its strategy and balance sheet for organic growth.
The presentation centred on four messages: a result in line with guidance, strategic momentum across the platform, strengthened balance sheet capacity, and clear platform growth pathways into FY27.
Supporting the headline figure, fee-generating AUM reached $16.9bn, up 15% on FY25, while recurring funds management revenue of $165.5m rose 22% year-on-year. The company declared a FY26 dividend of 12.0cps.
When big ASX news breaks, our subscribers know first
FY26 results at a glance
The scorecard below summarises the headline metrics from the presentation. Notably, the company disclosed an Underlying EPS (pre-tax) of 30.2cps for the first time, a new metric management stated reflects cash-backed earnings.
| Metric | FY26 | vs FY25 | Note |
|---|---|---|---|
| Operating EPS (pre-tax) | 40.4cps | — | In line with guidance |
| Fee-generating AUM | $16.9bn | +15% | As at 30 Jun 2026 |
| Recurring FM revenue | $165.5m | +22% | Excl. performance/large transaction fees |
| Underlying EPS (pre-tax) | 30.2cps | — | New cash-backed metric |
| Balance sheet (tangible assets + undrawn debt) | $1.9bn | — | Capacity for growth |
| FY26 Dividend | 12.0cps | flat | 6.0cps declared for 2H |
A focused, capital-light alternatives manager
The presentation described HMC Capital as a focused and capital-light alternatives manager built around four high-conviction verticals. This reflects the refined strategy the company announced at the Macquarie Conference in May 2026, rather than a new direction.
The business operates on a “Seed, Scale & Strengthen, Syndicate” model. In plain terms, the company uses its balance sheet to acquire or originate undervalued assets, transforms them through development or operating improvements, then raises third-party capital to scale each platform and recycle capital into recurring funds management earnings. A capital-light approach matters to investors because it favours recurring, higher-return fee income over capital-intensive direct ownership.
The four verticals
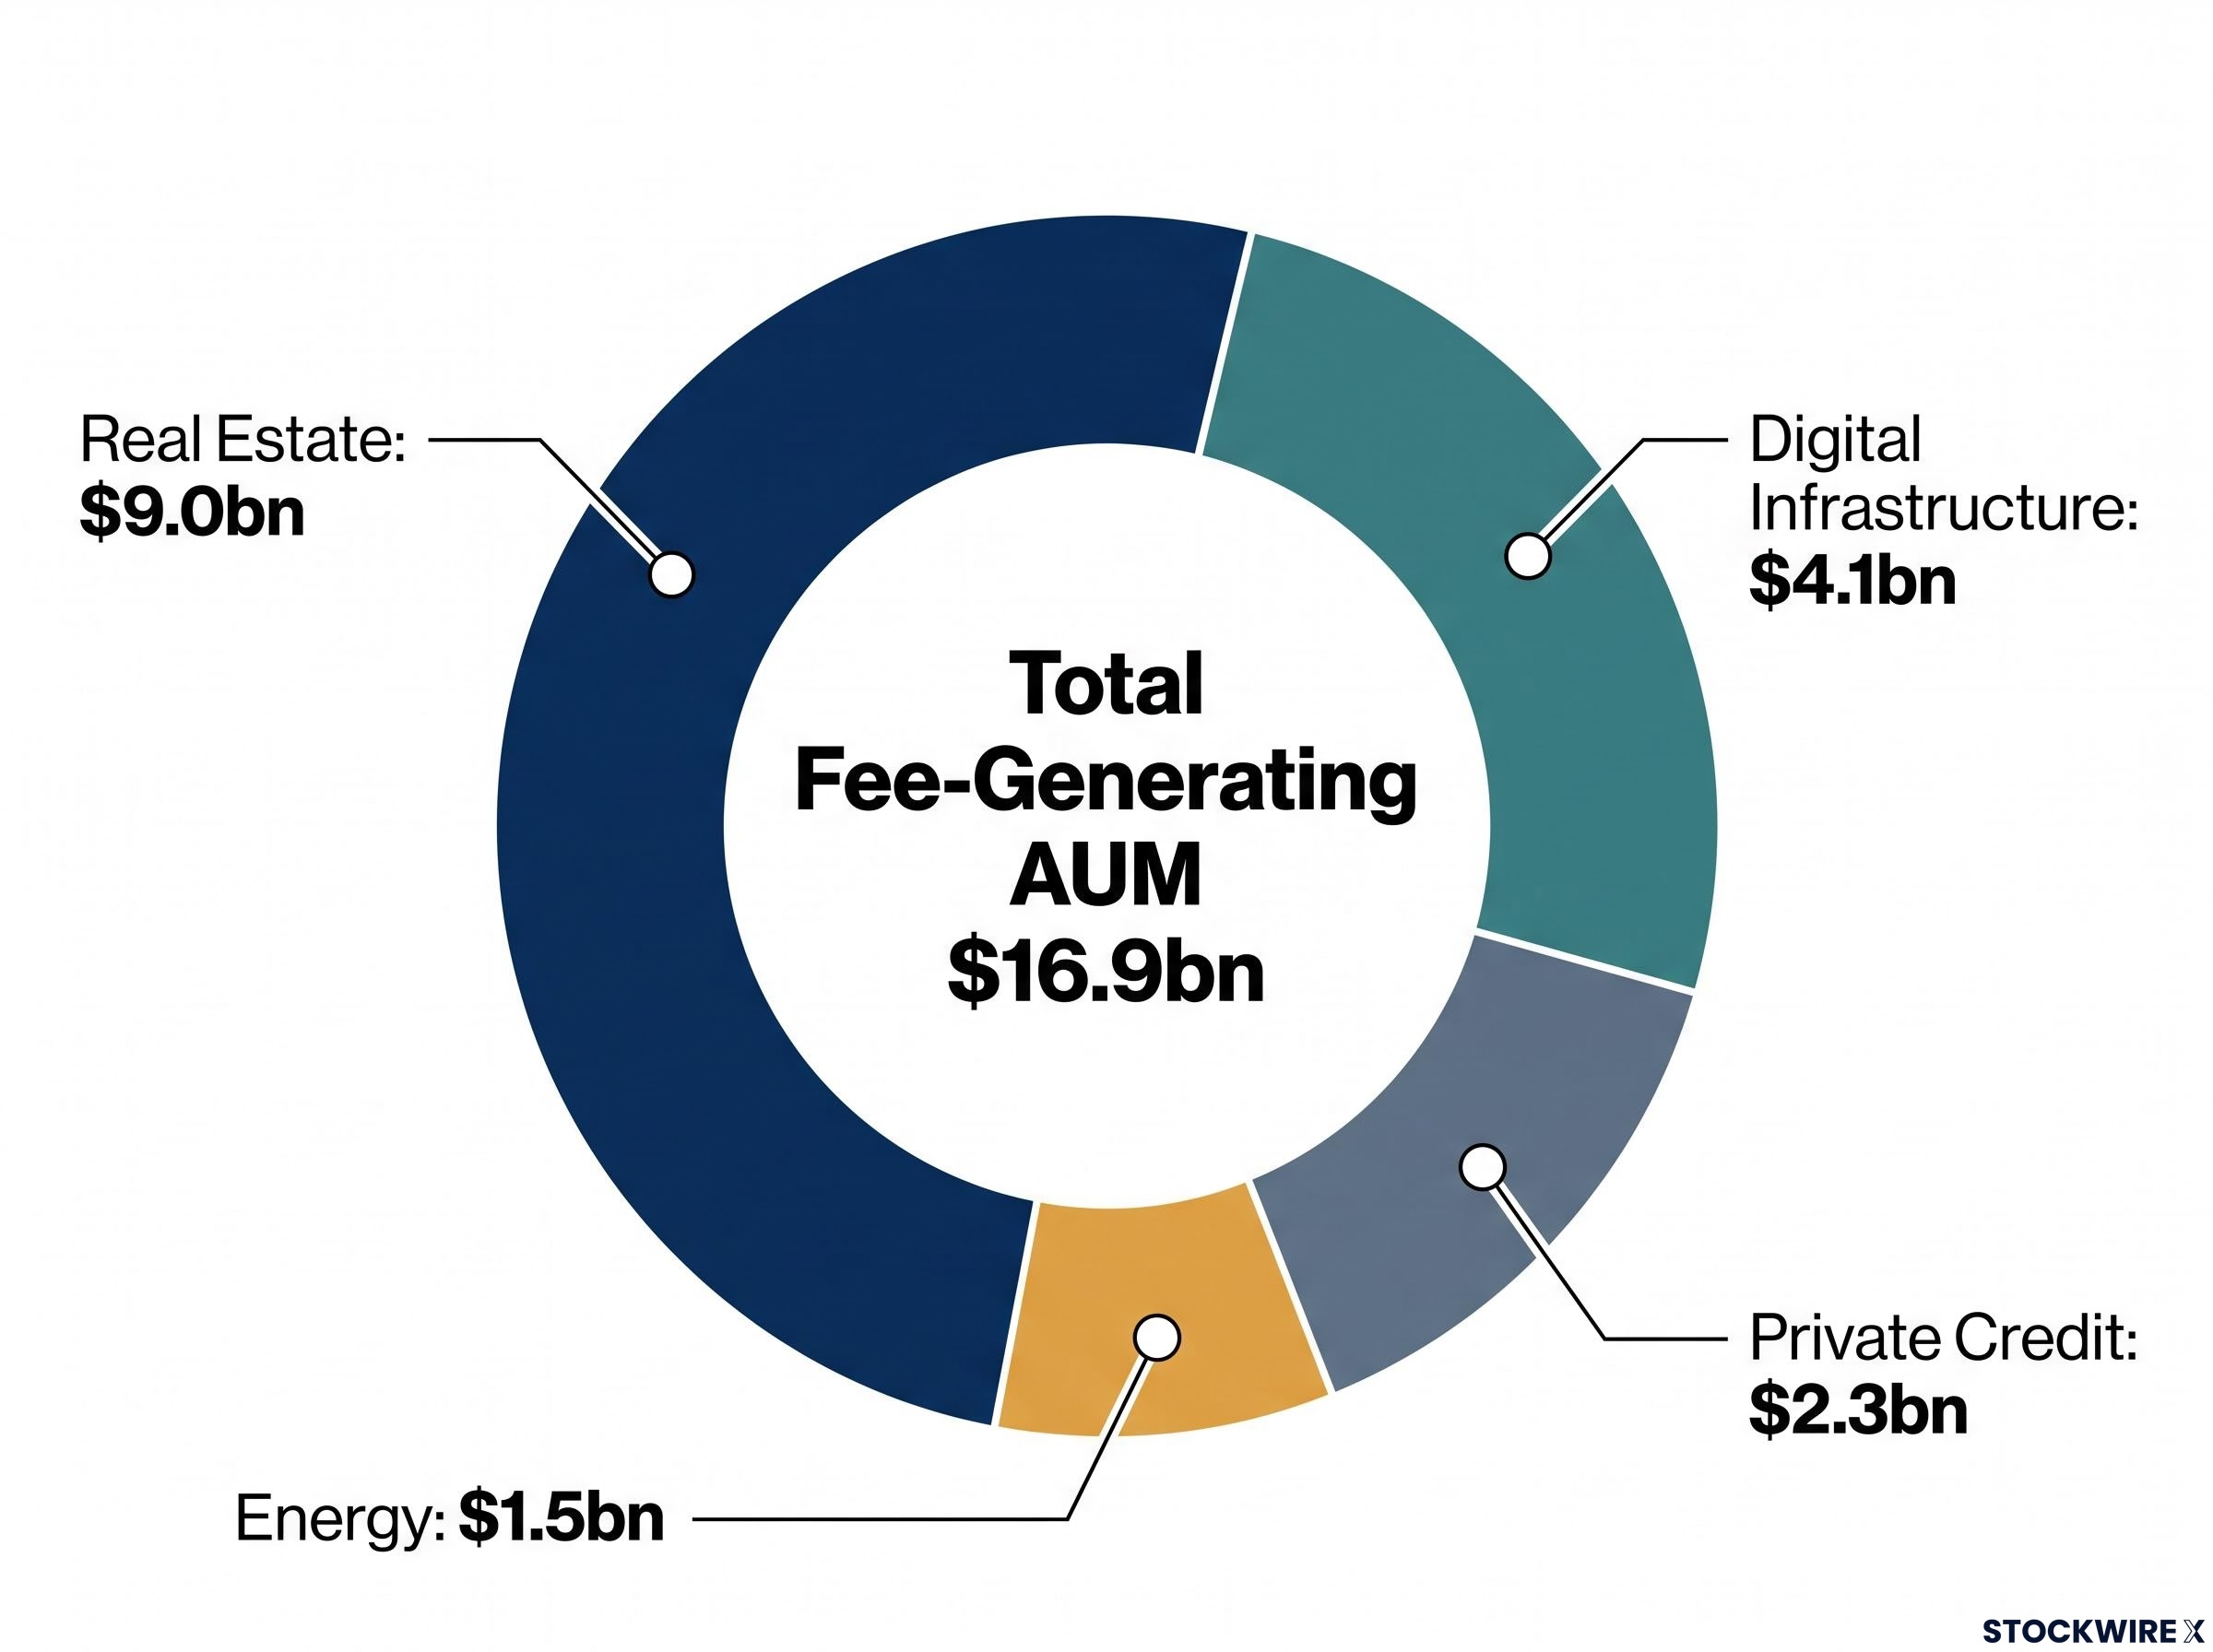
The four high-conviction verticals and their fee-generating AUM are:
-
Real Estate (Retail & Healthcare): $9.0bn
-
Digital Infrastructure (Data Centres): $4.1bn
-
Private Credit (CRE): $2.3bn
-
Energy (Batteries/BESS, Wind, Solar): $1.5bn
Platform scale
The presentation detailed a growth trajectory that saw fee-generating AUM rise from $2,111m in FY21 to $16,931m in FY26, a 52% p.a. CAGR. Over the same period, funds management revenues grew from $19m to $201m, a 60% p.a. CAGR. Approximately 60% of AUM sits within perpetual, ASX-listed structures, underpinning recurring and diversified fee streams that support earnings quality.
Strategic momentum across all four platforms
Management outlined tangible progress against its “Simplify, Scale, Strengthen” objectives, with each vertical advancing its deployment and fundraising pathways.
Private Credit scaling with institutional capital
The company secured $1.35bn of institutional mandates in June 2026, lifting committed AUM toward $3.3bn. This includes a strategic partnership with TPG Credit, established following TPG Credit’s manager selection and due diligence process in Australia. The partnership was seeded with $375m of seed loans and focuses on larger ($75m+) opportunities.
The $1.35bn in institutional private credit mandates secured in June 2026 nearly tripled the platform’s committed AUM, with $375m in seed loans already deployed at financial close and roughly $1bn of dry powder earmarked for new CRE loan origination through FY27.
Around $1bn of dry powder is available for FY27 deployment, as the platform targets a greater share of Australia’s $92bn CRE credit market. The FY26 result was affected by reduced loan origination volumes in the second half, reflecting multiple interest rate increases, though management noted origination volumes started the new year strongly.
Energy transitioned to Illuma Energy
The Energy platform, now named Illuma Energy, secured a $603m commitment from KKR to invest in the platform and its development pipeline. For its first BESS project, $248m of committed equity capital was secured, reducing HMC’s invested capital to approximately $200m while retaining majority exposure to future platform upside.
The platform holds AUM of $1.5bn, with 652MW operating (85% contracted) and a development pipeline of approximately 5GW across 19 projects. Management outlined an ambition of around $10bn AUM via multiple delivery pathways.
Digital Infrastructure — SYD1 fully funded
The SYD1 88MW project is fully funded, with LOIs executed for the remaining 52MW of capacity, subject to execution of binding documentation. DGT announced approximately $1.2bn of US asset disposals (CHI1 and LAX), with proceeds reinvested to fund the accretive SYD1 expansion and reduce gearing from 39% to 18%. This supports a pathway to an Australian Platform stabilised EBITDA of approximately $250m.
Real Estate
Unlisted AUM reached $2.9bn, up 15% on June 2025, supported by demand for retail assets. The company is progressing approximately $2bn of deployment opportunities and holds a $1.4bn development pipeline, with unlisted funds delivering an average IRR of >12% since inception.
With >$5bn of dry powder and active pipeline across the group, each vertical is positioned to convert deployment into recurring earnings.
Financial performance and a strengthened balance sheet
Headline operating earnings declined as FY26 cycled off large FY25 transaction and performance fees, particularly from the Digital and Private Equity divisions. Underlying recurring quality improved, with management fee revenue up 23% and recurring FM revenue up 22%, signalling the growing weight of durable fee income.
Earnings summary
| Metric | FY25 | FY26 | % change |
|---|---|---|---|
| Management fee revenue | $130.0m | $159.3m | +23% |
| Total revenue | $221.6m | $200.5m | (10%) |
| Adjusted FM EBITDA | $114.3m | $88.5m | (23%) |
| Operating earnings before tax | $224.6m | $166.8m | (26%) |
| Operating EPS | 56.0cps | 40.4cps | (28%) |
The declines were driven by cycling off FY25 one-off Digital and Private Equity transaction and performance fees, rather than any deterioration in the core recurring business.
Balance sheet capacity restored
Balance sheet capacity was restored following the Energy (Illuma) sell-down, positioning the company for its next phase of organic growth. Gearing reduced to 10.7% at June 2026 from 20.5% at December 2025, supported by $0.5bn of undrawn debt and $1.4bn of balance sheet investments. NTA per share stood at $2.95.
The original KKR partnership announcement in February 2026 framed the deal as a preferred equity structure non-recourse to HMC, with management projecting above 20% ROE and a 4x multiple on invested capital, figures that help contextualise the balance sheet optimisation described in the FY26 results.
Management noted that optimising the $1.4bn of balance sheet investments could generate $25–50m p.a. of additional underlying earnings.
FY27 outlook: underlying earnings growth of 16%+
Looking ahead, the company guided to FY27 underlying EPS of >35 cents, representing 16% growth on FY26, and a FY27 dividend of 15 cents, up 25%. This forward-looking case forms the core of the investment thesis presented.
Management outlined three drivers underpinning the expected step-up:
-
>30% growth in recurring funds management revenue (excluding the $35m Energy upfront charge), led by the Digital and Private Credit platforms.
-
~35% increase in expected distributions from DGT, HCW and HDN co-investments, with HCW distributions subject to resolution of the Healthscope situation.
-
Fixed cost leverage from simplification initiatives and additional cost savings.
Guidance excludes potential upside from capital recycling on the $1.4bn of balance sheet investments and any realised investment income on existing principal investments. Management expects 100% conversion of underlying earnings guidance to cash in FY27.
Presentation core message
Delivered on guidance; strategy and balance sheet positioned for organic growth.
Stay Ahead on ASX Finance and Alternatives News
Get breaking ASX announcements delivered to your inbox within minutes, complete with in-depth analysis already done. Join 20,000+ investors who rely on Big News Blast for FREE real-time coverage across Finance, Fintech, and beyond. Click the “Free Alerts” button to start receiving the news the moment it hits the market.