
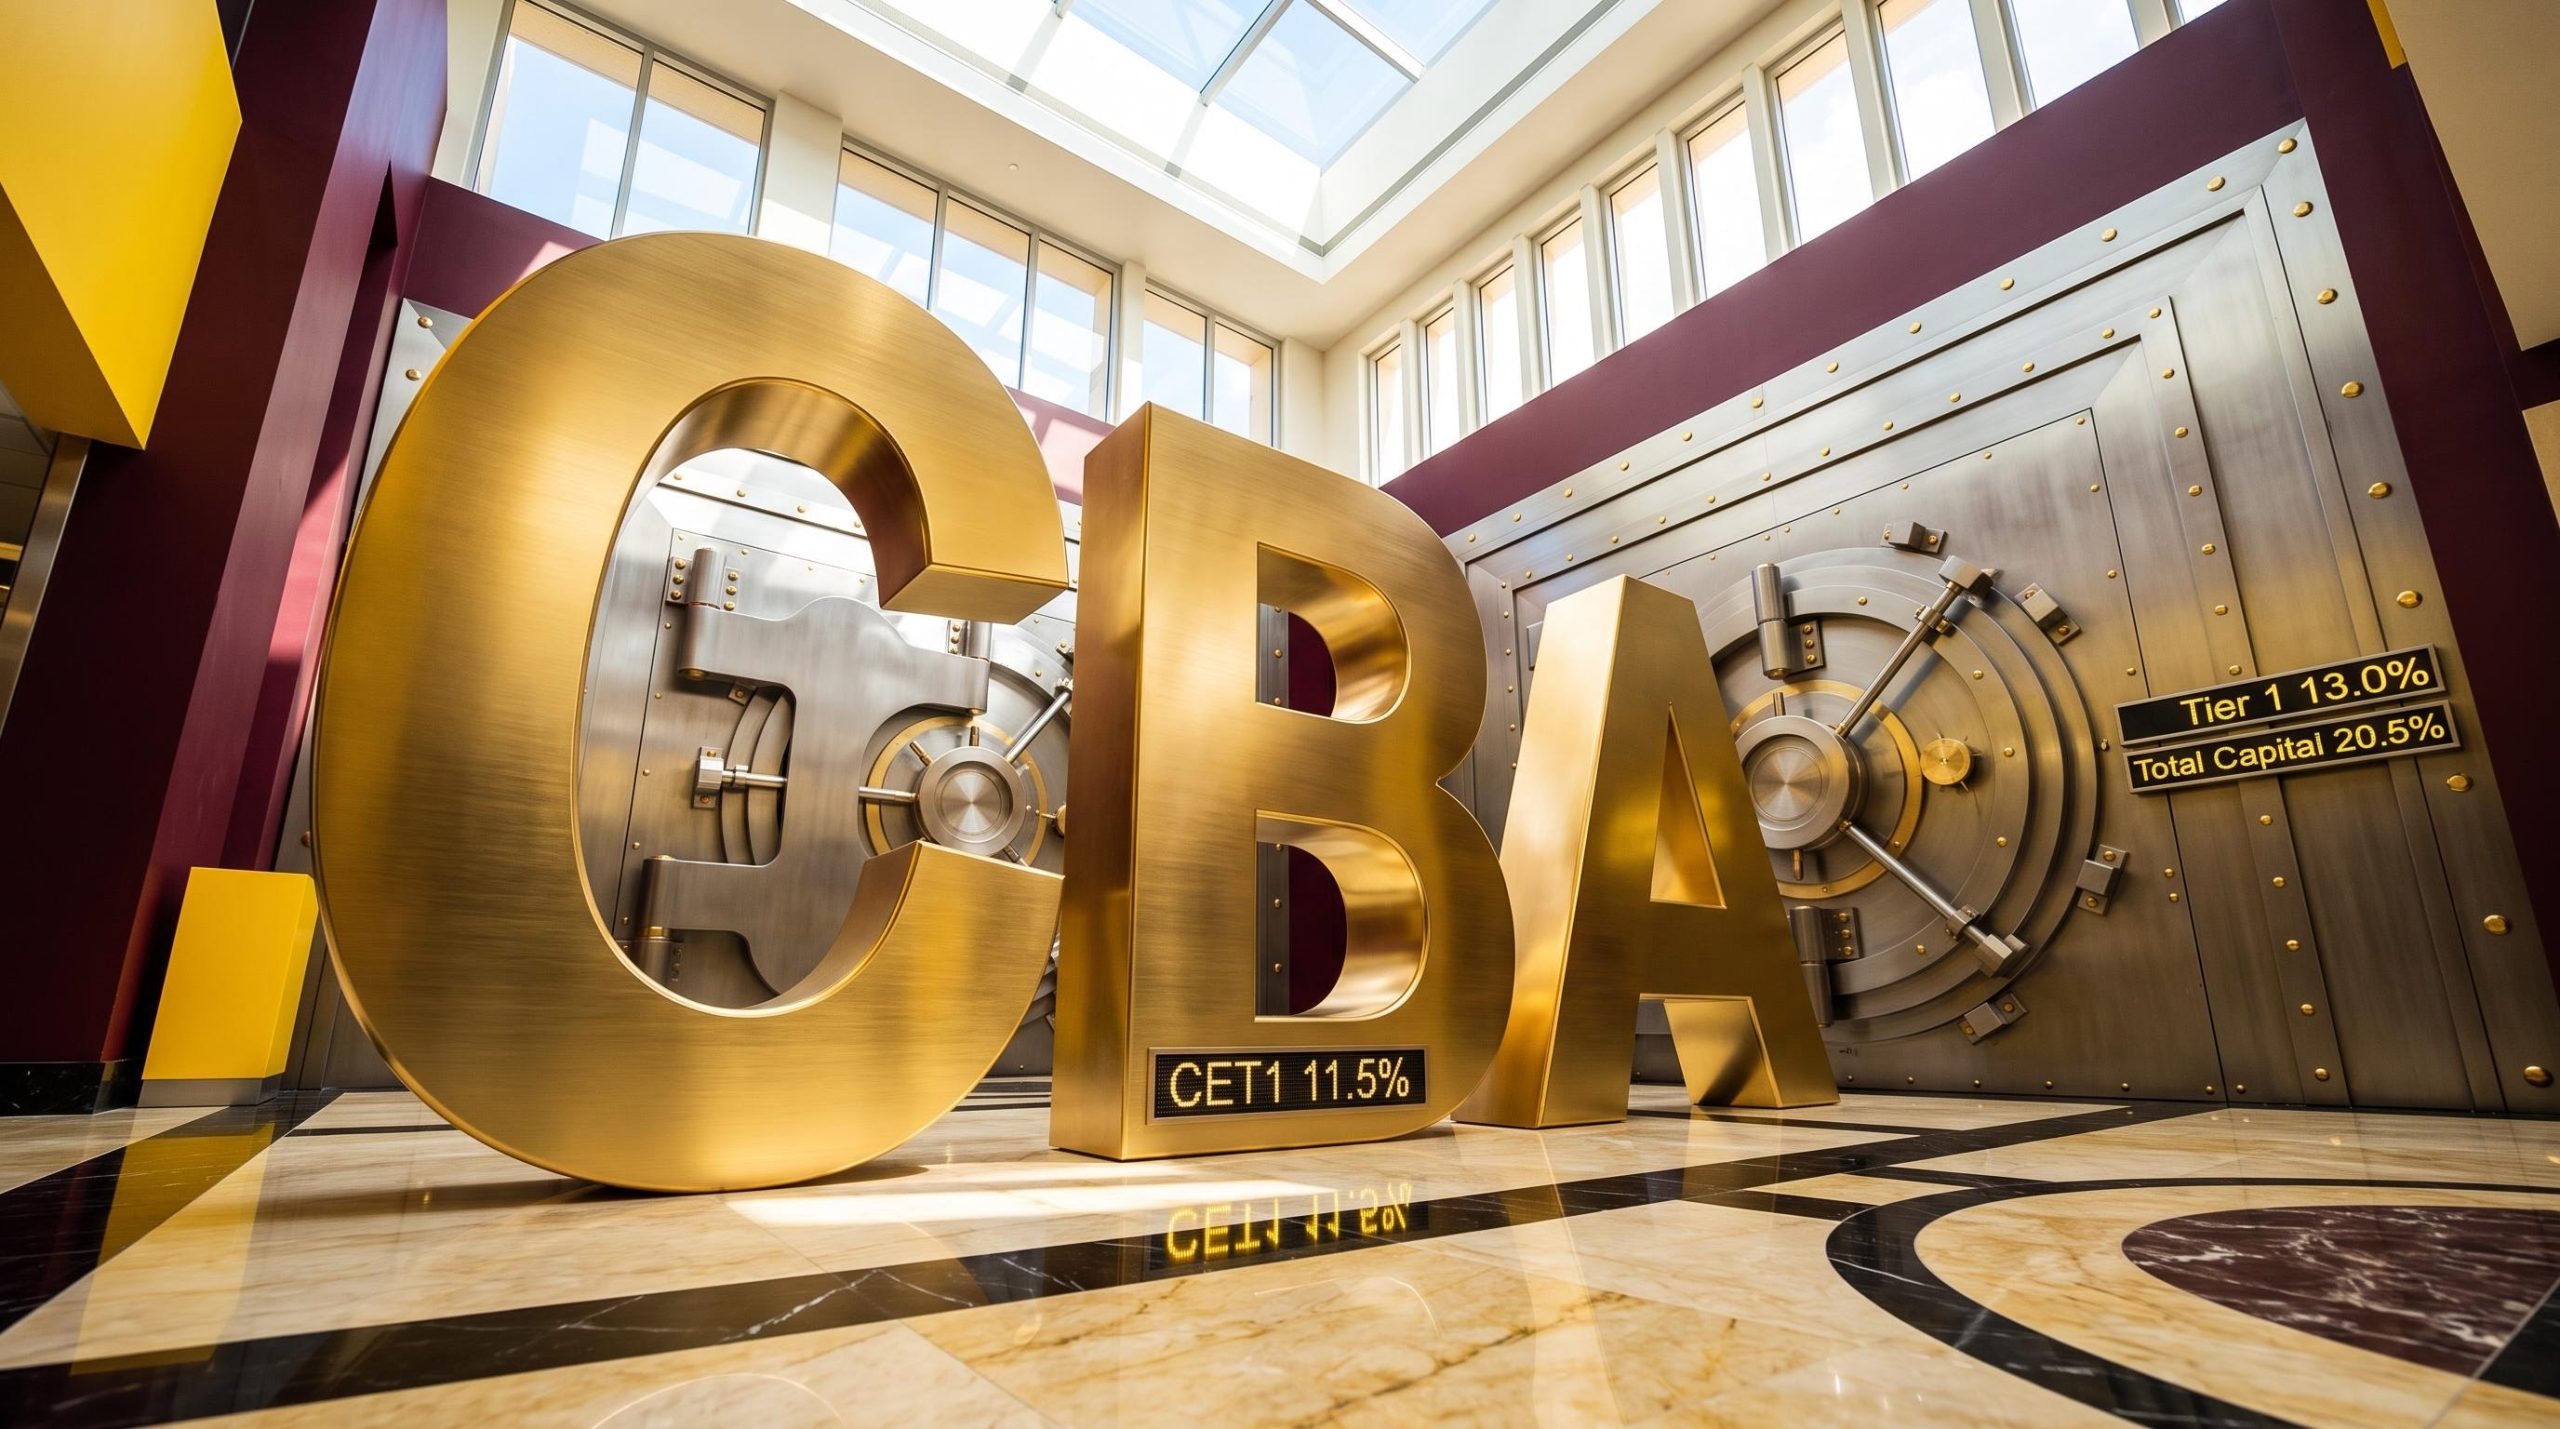
Q1 FY27 capital position: CET1 ratio at 11.5%
In its Q1 FY27 Pillar 3 report for the quarter ended 30 September 2026, dated 11 November 2026, Commonwealth Bank of Australia (CBA) recorded Basel III Common Equity Tier 1 (CET1), Tier 1 and Total Capital ratios of 11.5%, 13.0% and 20.5% respectively.
The CET1 ratio increased by 36 basis points in the quarter after allowing for the 2026 final dividend (-85 basis points). Capital generated from earnings added 52 basis points and other items 6 basis points, partly offset by a net increase in total RWA, excluding foreign currency movements on credit RWA (-22 basis points).
The earnings contribution to capital traces back to the record FY26 cash profit reported in August, which also set the final dividend that drew down capital this quarter.
The CET1 ratio for Level 1 stood at 11.6% at 30 September 2026.
Capital metrics at a glance
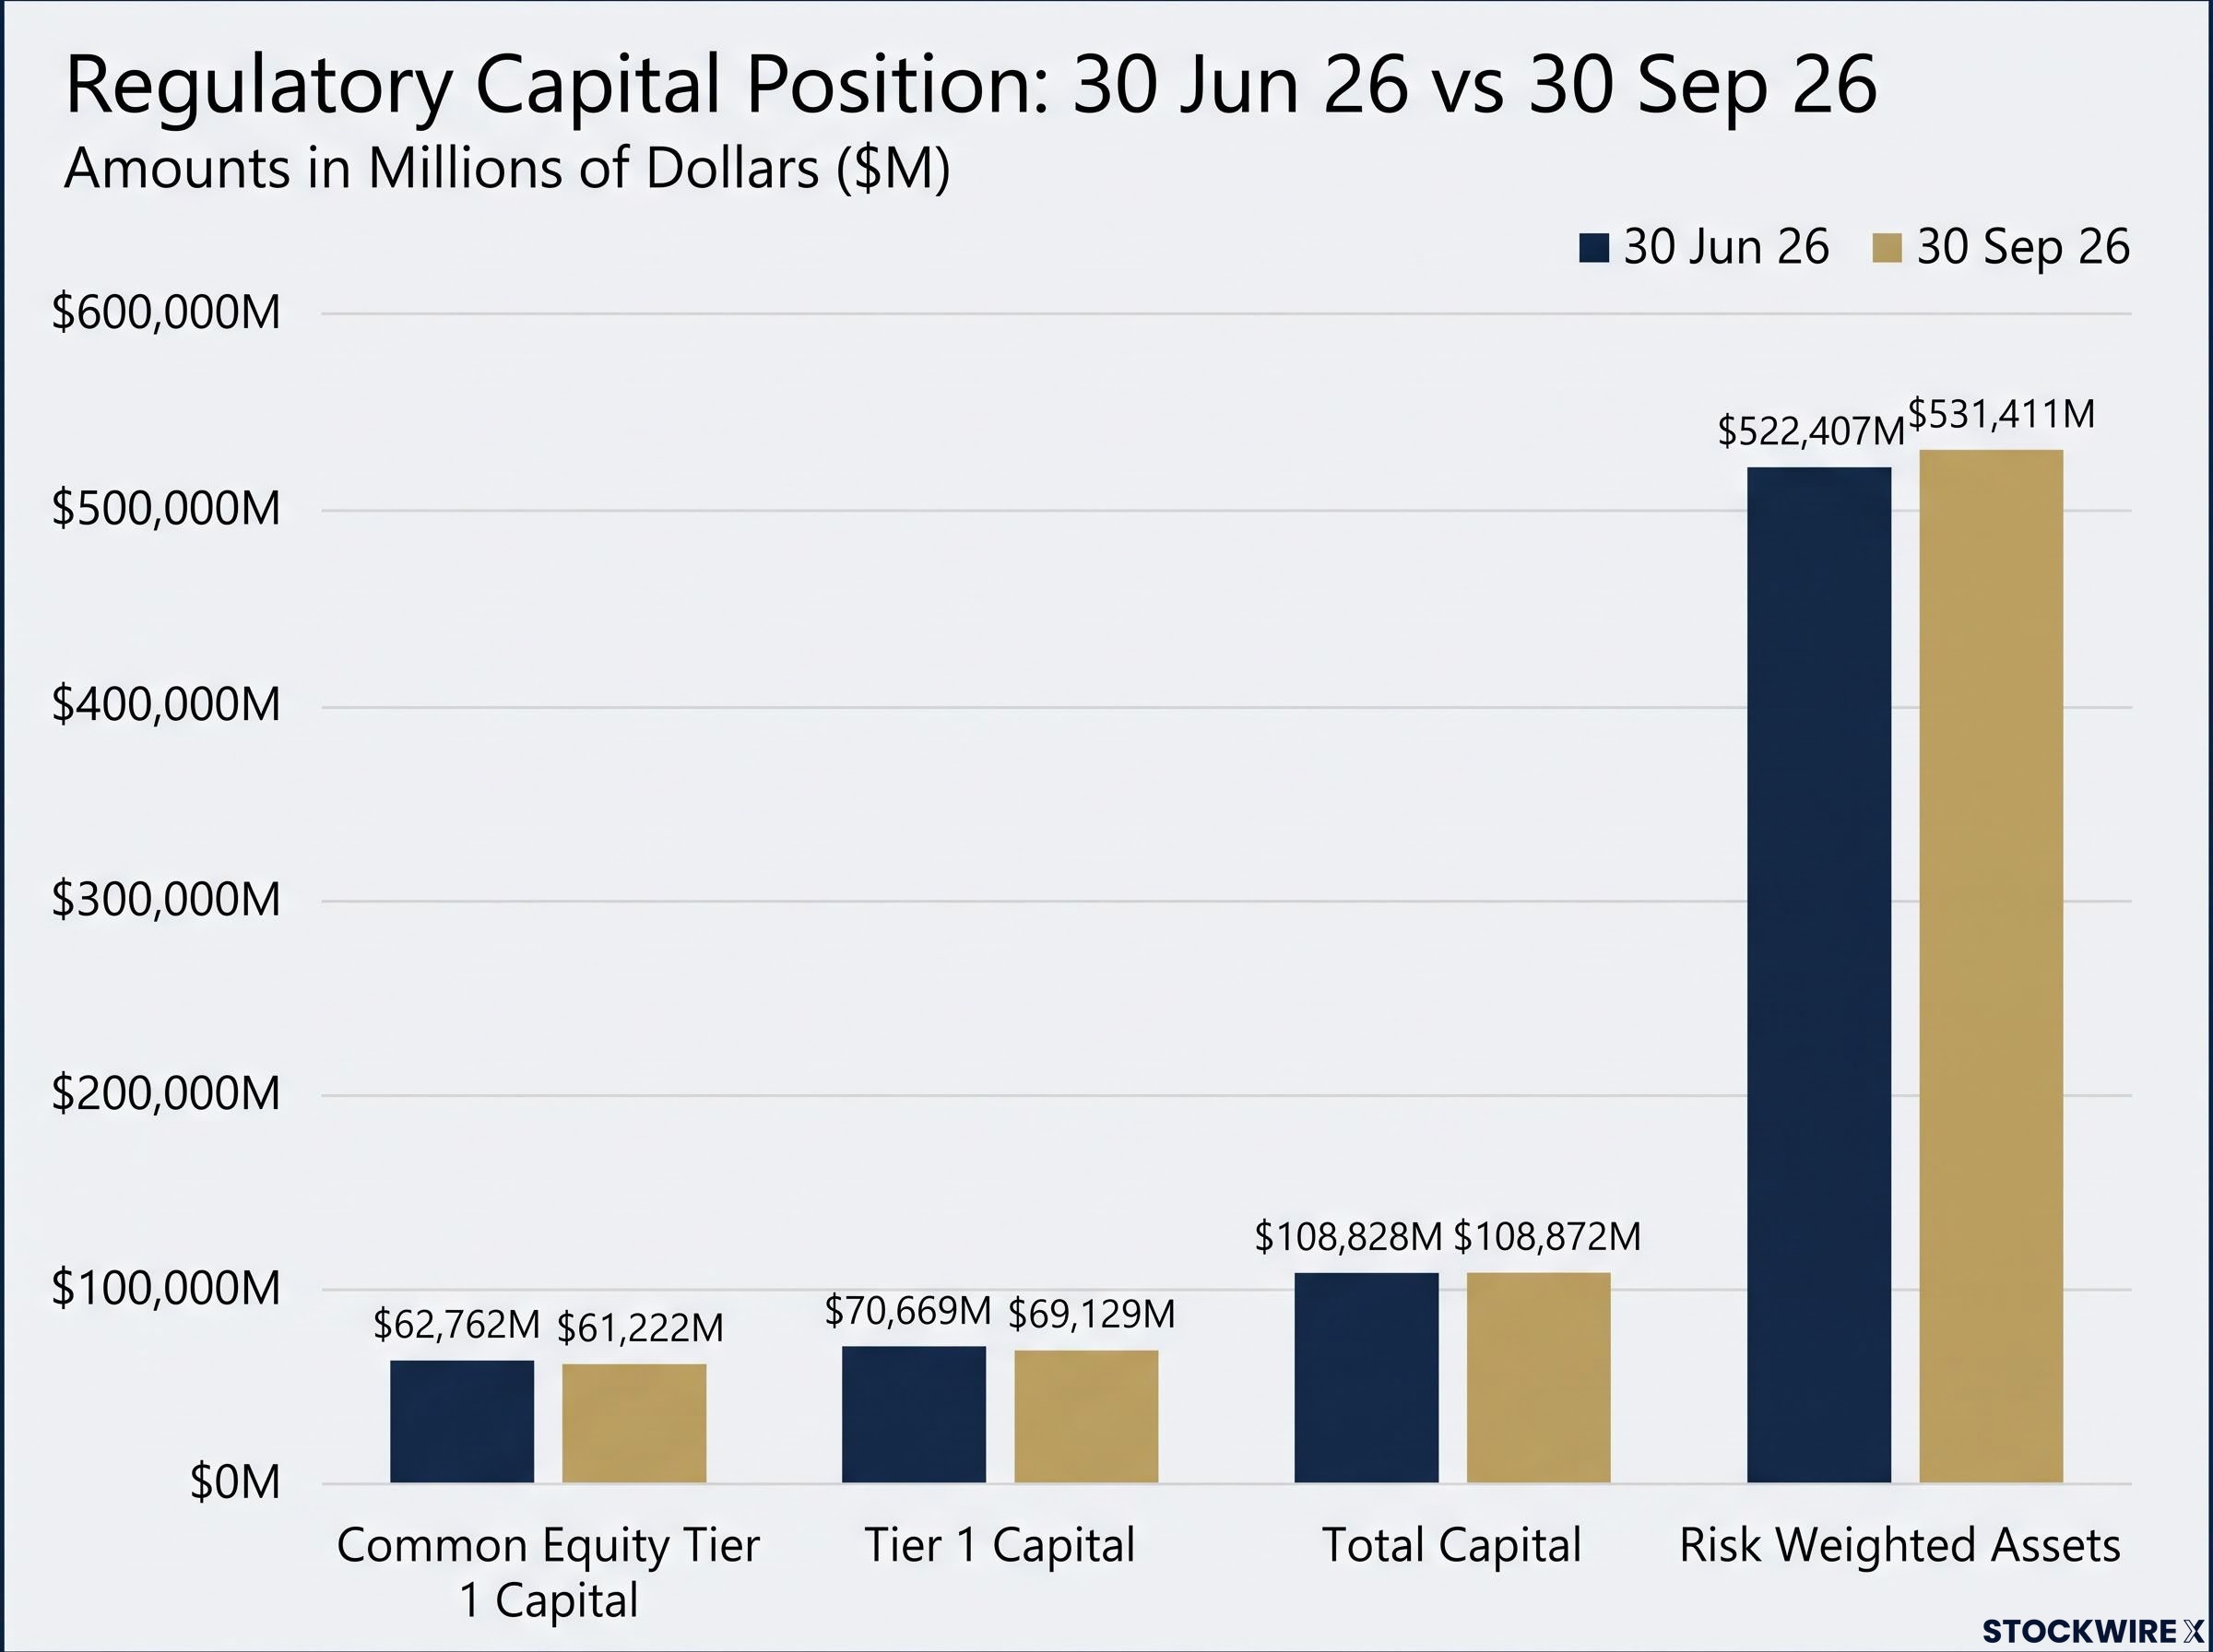
The Group’s regulatory capital position at the end of the quarter, compared with 30 June 2026, was as follows.
| Metric | 30 Sep 26 | 30 Jun 26 |
|---|---|---|
| Common Equity Tier 1 Capital | $61,222M | $62,762M |
| Tier 1 Capital | $69,129M | $70,669M |
| Total Capital | $108,872M | $108,828M |
| Risk Weighted Assets | $531,411M | $522,407M |
Capital initiatives in the quarter
CBA reported the following initiatives during the quarter:
- The Dividend Reinvestment Plan (DRP) for the 2026 final dividend was satisfied in full by the on-market purchase of shares, with a participation rate of 12.4%.
- Basel III compliant subordinated notes were issued: GBP650 million and SGD325 million in August 2026, and USD1,250 million and CNH2 billion in September 2026.
- Basel III compliant subordinated notes were redeemed: AUD1,500 million in August 2026 and JPY14 billion in September 2026.
- Tier 2 Capital rose to $39,743 million from $38,159 million.
When big ASX news breaks, our subscribers know first
Risk weighted assets and credit performance
Total RWA increased by $9.0 billion or 1.7% on the prior quarter to $531.4 billion. The report attributed this to higher credit risk and operational risk RWA, partly offset by lower interest rate risk in the banking book (IRRBB) and traded market risk RWA.
Credit Risk RWA rose $7.2 billion to $429.9 billion. The key drivers were:
- Volume growth, an increase of $8.4 billion, mainly in commercial portfolios and domestic residential mortgages.
- Credit quality deterioration, an increase of $0.3 billion.
- Foreign currency movements, a decrease of $0.9 billion.
- Data and methodology, a decrease of $0.8 billion.
- Derivatives and other, an increase of $0.3 billion.
Operational Risk RWA increased $2.2 billion or 4.4% to $53.3 billion. This followed the annual update of the business indicator component based on the 2026 financial report, driven by higher average net interest income over the financial years ended 30 June 2026, 2025 and 2024.
Traded Market Risk RWA fell to $6.9 billion and IRRBB RWA to $41.2 billion. CBA’s AIRB RWA includes an $8.3 billion overlay relating to the Australian Residential Mortgage PD model, and the output floor applied was 72.5%.
Non-performing exposures and losses
Non-performing exposures reached $12,034 million (30 June 2026: $11,094 million). The specific provision balance was $1,615 million (from $1,489 million), and actual losses for the quarter were $265 million (from $190 million).
Residential mortgage non-performing exposures were $7,904 million, up from $7,200 million, while the consumer sector accounted for $9,128 million. Losses from lower risk IPRE lending and overall IPRE lending were less than 0.3% and 0.5% of outstanding IPRE exposures respectively, in each of the past 3 years to 30 September 2026.
| Portfolio (30 Sep 26) | Non-performing exposures | Specific provision balance | Actual losses for the quarter |
|---|---|---|---|
| Corporate (incl. Large and SME corporate) | $2,010M | $519M | $69M |
| RBNZ Regulated Entities | $1,246M | $173M | $33M |
| Residential Mortgage | $7,904M | $457M | $5M |
| Total | $12,034M | $1,615M | $265M |
Understanding Pillar 3 and CBA’s capital buffers
Pillar 3 disclosure is the public reporting required of Australian authorised deposit-taking institutions under APRA’s Prudential Standard APS 330. This report was prepared on a Level 2 basis, is unaudited and was prepared consistent with information supplied to APRA.
CET1 capital is the highest quality of capital available to the Group, comprising ordinary share capital, retained earnings and reserves, less prescribed deductions. Risk Weighted Assets (RWA) are the values of the Group’s on and off-balance sheet assets, adjusted by risk weights calculated under APRA prudential standards.
CBA is predominantly accredited to use the Advanced Internal-Ratings Based (AIRB) approach for credit risk and the Standardised Measurement Approach for operational risk. CET1 available after meeting the bank’s minimum capital requirements was 7.0% (30 June 2026: 7.5%), and total CET1 specific buffer requirements were 5.60%.
Leverage and liquidity remain above minimums
The leverage ratio was 4.4% at 30 September 2026 (30 June 2026: 4.6%), against a 3.5% minimum requirement for IRB banks such as CBA. The decline was primarily driven by the 2026 final dividend and higher exposures, partly offset by earnings, with total exposures at $1,554,886 million.
The average Liquidity Coverage Ratio remained flat at 132% against a regulatory minimum of 100%, with excess liquid assets averaging $46 billion over the quarter. The Net Stable Funding Ratio was 115%, also flat, as higher available stable funding from retail and SME deposits was offset by higher required stable funding from lending growth.
What happens next for CBA’s capital
CBA reported one capital initiative after the end of the reporting period:
- In October 2026, the Group redeemed $1,180 million of CommBank PERLS XIII Capital Notes, which are Basel III compliant Additional Tier 1 Capital.
Want Alerts Like This on the Financials Stocks You Follow?
StockWire X Market Intelligence scores every announcement in our coverage for how significant it’s likely to be for investors, and which way it points, then alerts you on the stocks you follow. The first 1,000 founding members lock in 50% off for life: A$247 a year instead of the standard A$495. Join the founding waitlist today.