
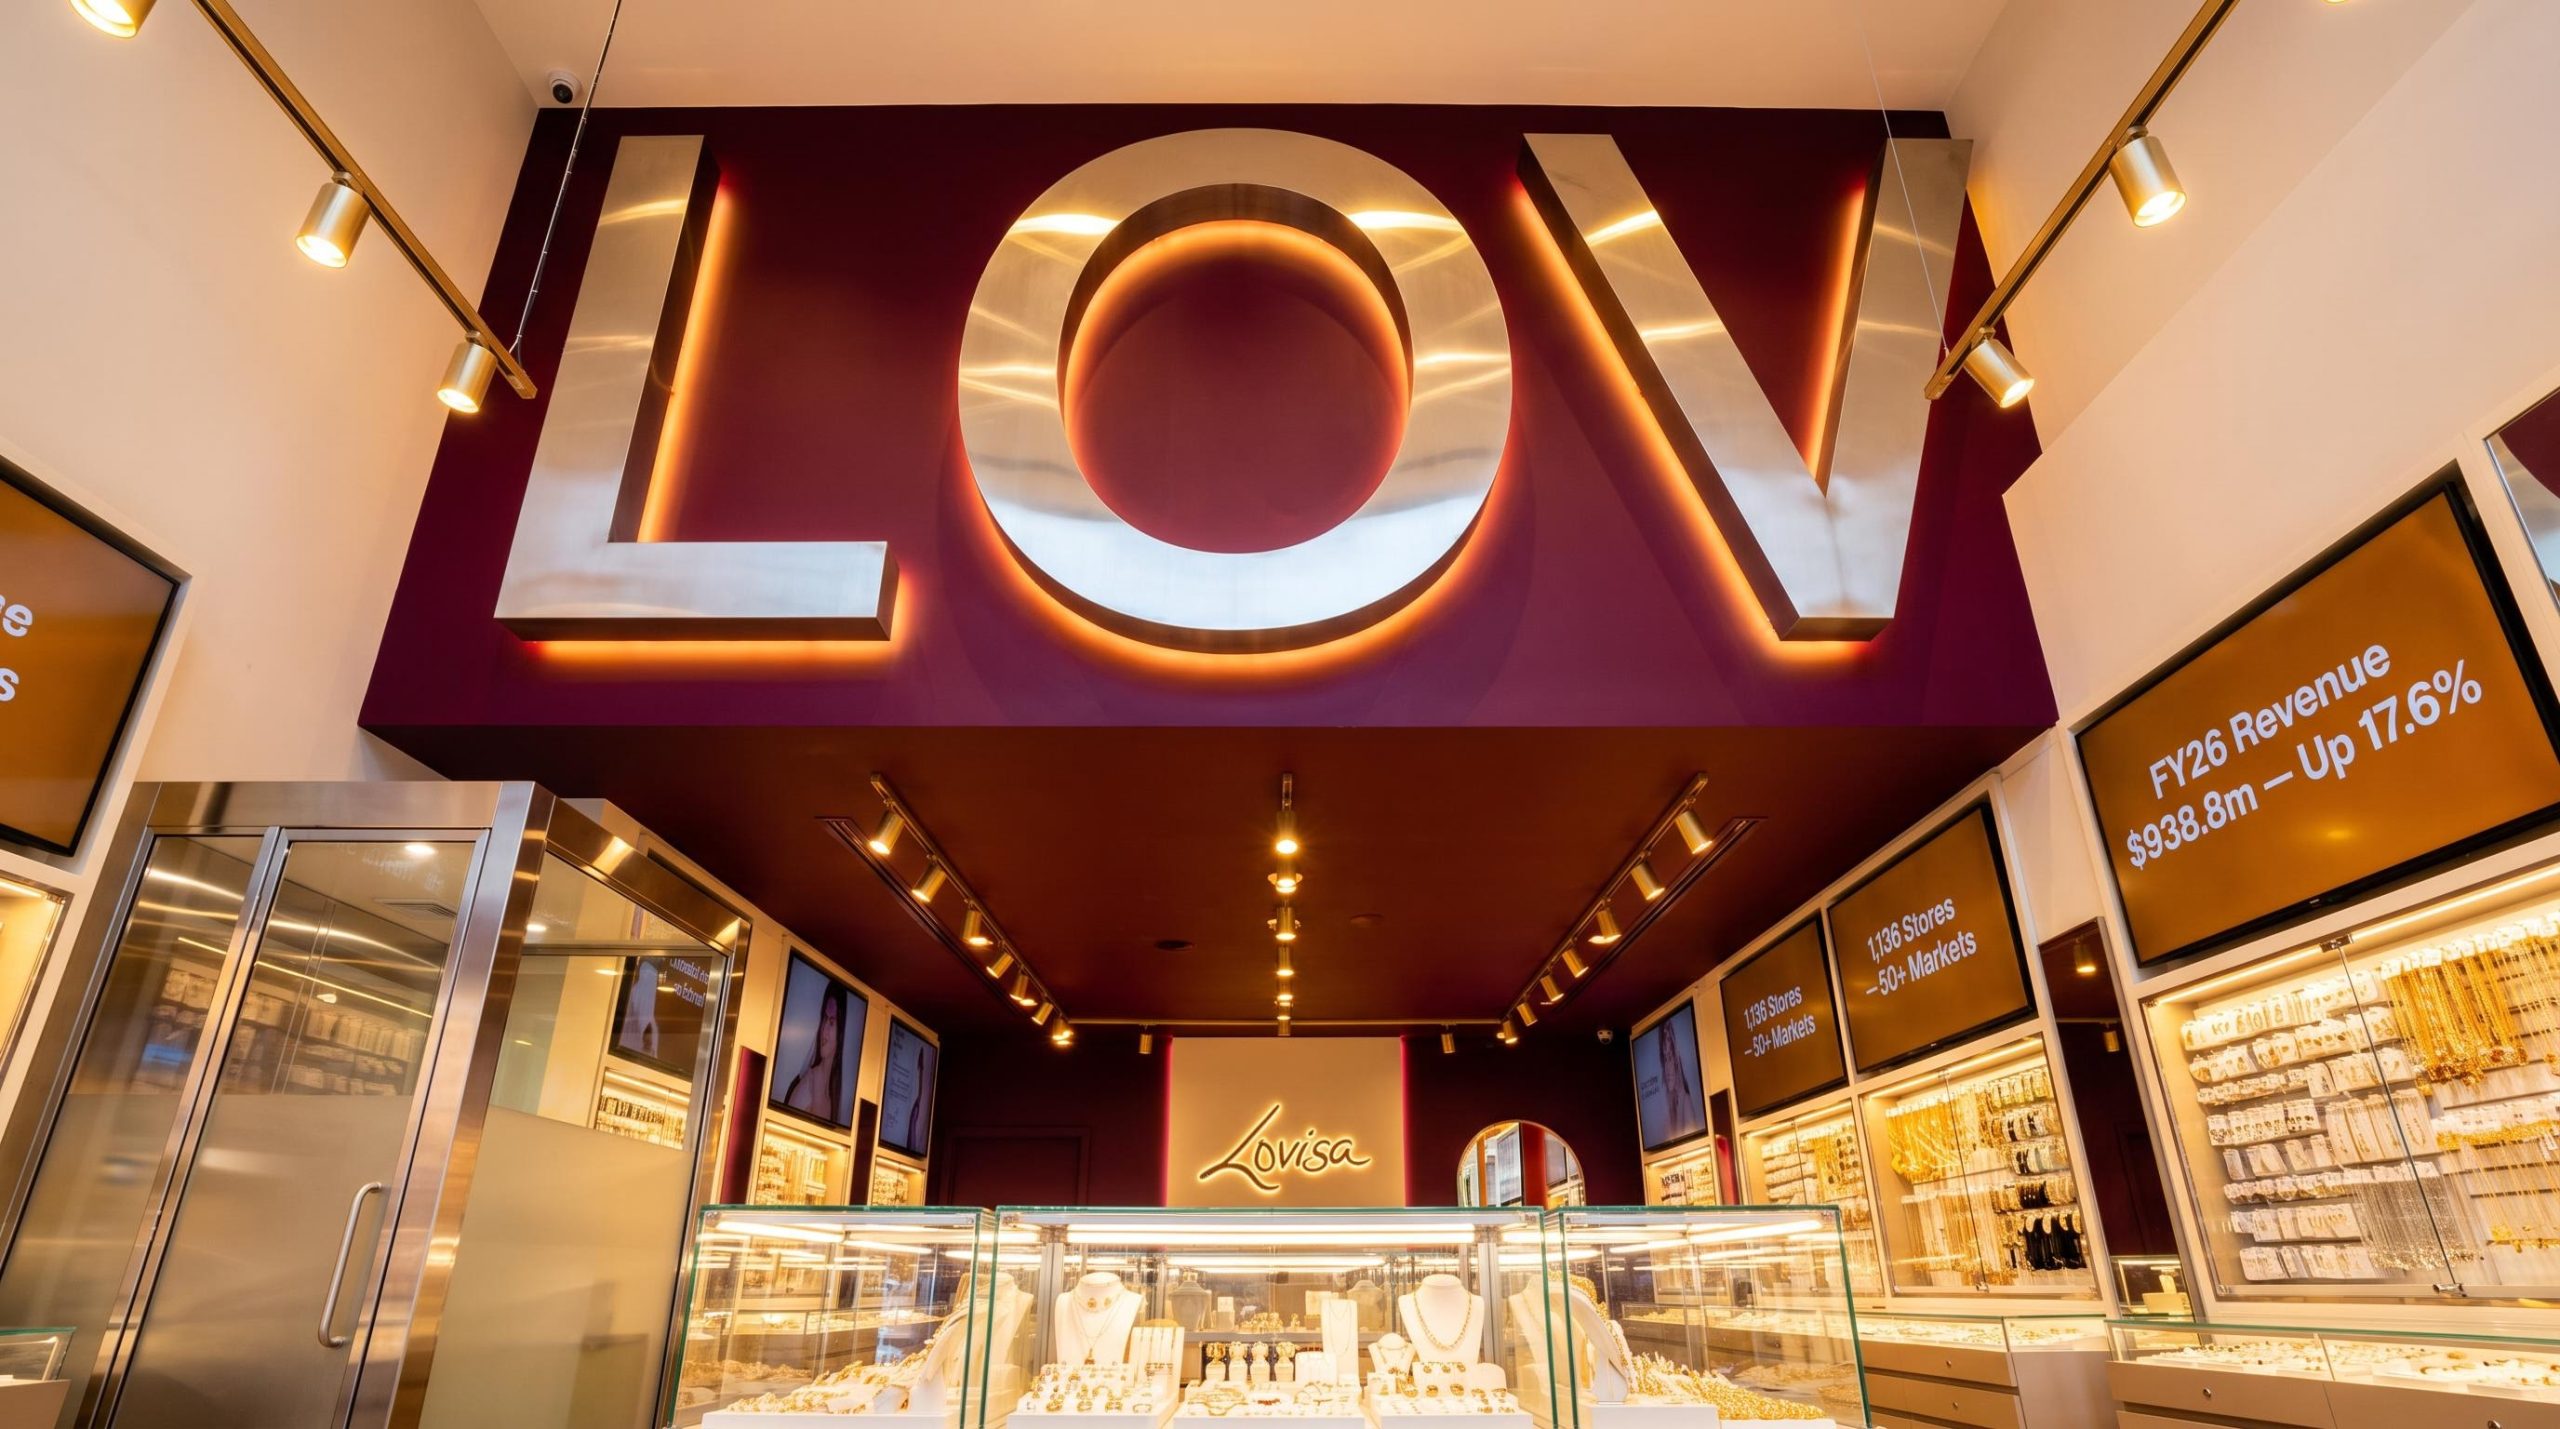
Lovisa delivers 17.6% revenue growth as global store rollout accelerates
In its FY26 full year results presentation, fast-fashion jewellery retailer Lovisa Holdings reported total revenue of $938.8m, up 17.6% on FY25, driven by standout international performance across the Americas (+29.6%) and Europe (+29.5%).
The results centred on three interconnected themes: continued top-line growth, sustained margin expansion, and an accelerating global store rollout. Management highlighted 160 new stores opened during the year, taking the network to 1,136 stores at year end.
Net profit after tax (NPAT) reached $95.6m, up 10.7% on the prior year. The company also flagged a positive start to FY27, with comparable store sales rising 3.0% across the first eight weeks of the new financial year.
When big ASX news breaks, our subscribers know first
FY26 financial results at a glance
The presentation detailed broad-based earnings growth across the profit and loss statement. Gross profit increased 18.4% to $775.3m, while EBITDA climbed 20.9% to $301.1m, outpacing revenue growth and reflecting improved operating leverage as the store base scaled.
EBIT rose 14.1% to $158.2m, with NPAT reaching $95.6m (+10.7%) and earnings per share (EPS) of 86.3 cents, up 10.5%. Comparable store sales grew 2.0% for the full year.
For investors, the capital return story remained a defining feature. Full year dividends of 86 cents represent a 100% payout of NPAT, underscoring the company’s self-funding model.
| Metric | FY26 | FY25 | Variance |
|---|---|---|---|
| Revenue ($’000) | 938,763 | 798,133 | +17.6% |
| Gross profit ($’000) | 775,333 | 654,670 | +18.4% |
| EBITDA ($’000) | 301,145 | 249,032 | +20.9% |
| EBIT ($’000) | 158,222 | 138,701 | +14.1% |
| NPAT ($’000) | 95,590 | 86,332 | +10.7% |
| EPS (cents) | 86.3 | 78.1 | +10.5% |
| Dividends (cents) | 86.0 | 77.0 | +11.7% |
Regional growth and margin expansion
Americas and Europe drive the top line
The international expansion engine did the heavy lifting in FY26. The Americas region generated $275.9m in sales (+29.6%), while Europe delivered $364.3m (+29.5%). Africa and the Middle East grew 12.8% to $65.7m.
The company’s home markets, by contrast, showed the characteristics of a maturing base. Australia and New Zealand declined 5.7% to $193.4m, while Asia fell 3.8% to $36.7m. Management pointed to a long runway of new store growth remaining across Europe, the USA and Canada, where growth is increasingly concentrated.
| Region | FY26 ($’000) | FY25 ($’000) | Variance |
|---|---|---|---|
| Australia / NZ | 193,373 | 204,958 | -5.7% |
| Asia | 36,744 | 38,208 | -3.8% |
| Africa/Middle East | 65,747 | 58,286 | +12.8% |
| Europe | 364,261 | 281,208 | +29.5% |
| Americas | 275,932 | 212,968 | +29.6% |
| Franchise | 2,706 | 2,505 | +8.0% |
| Total | 938,763 | 798,133 | +17.6% |
Gross margin reaches 82.6%
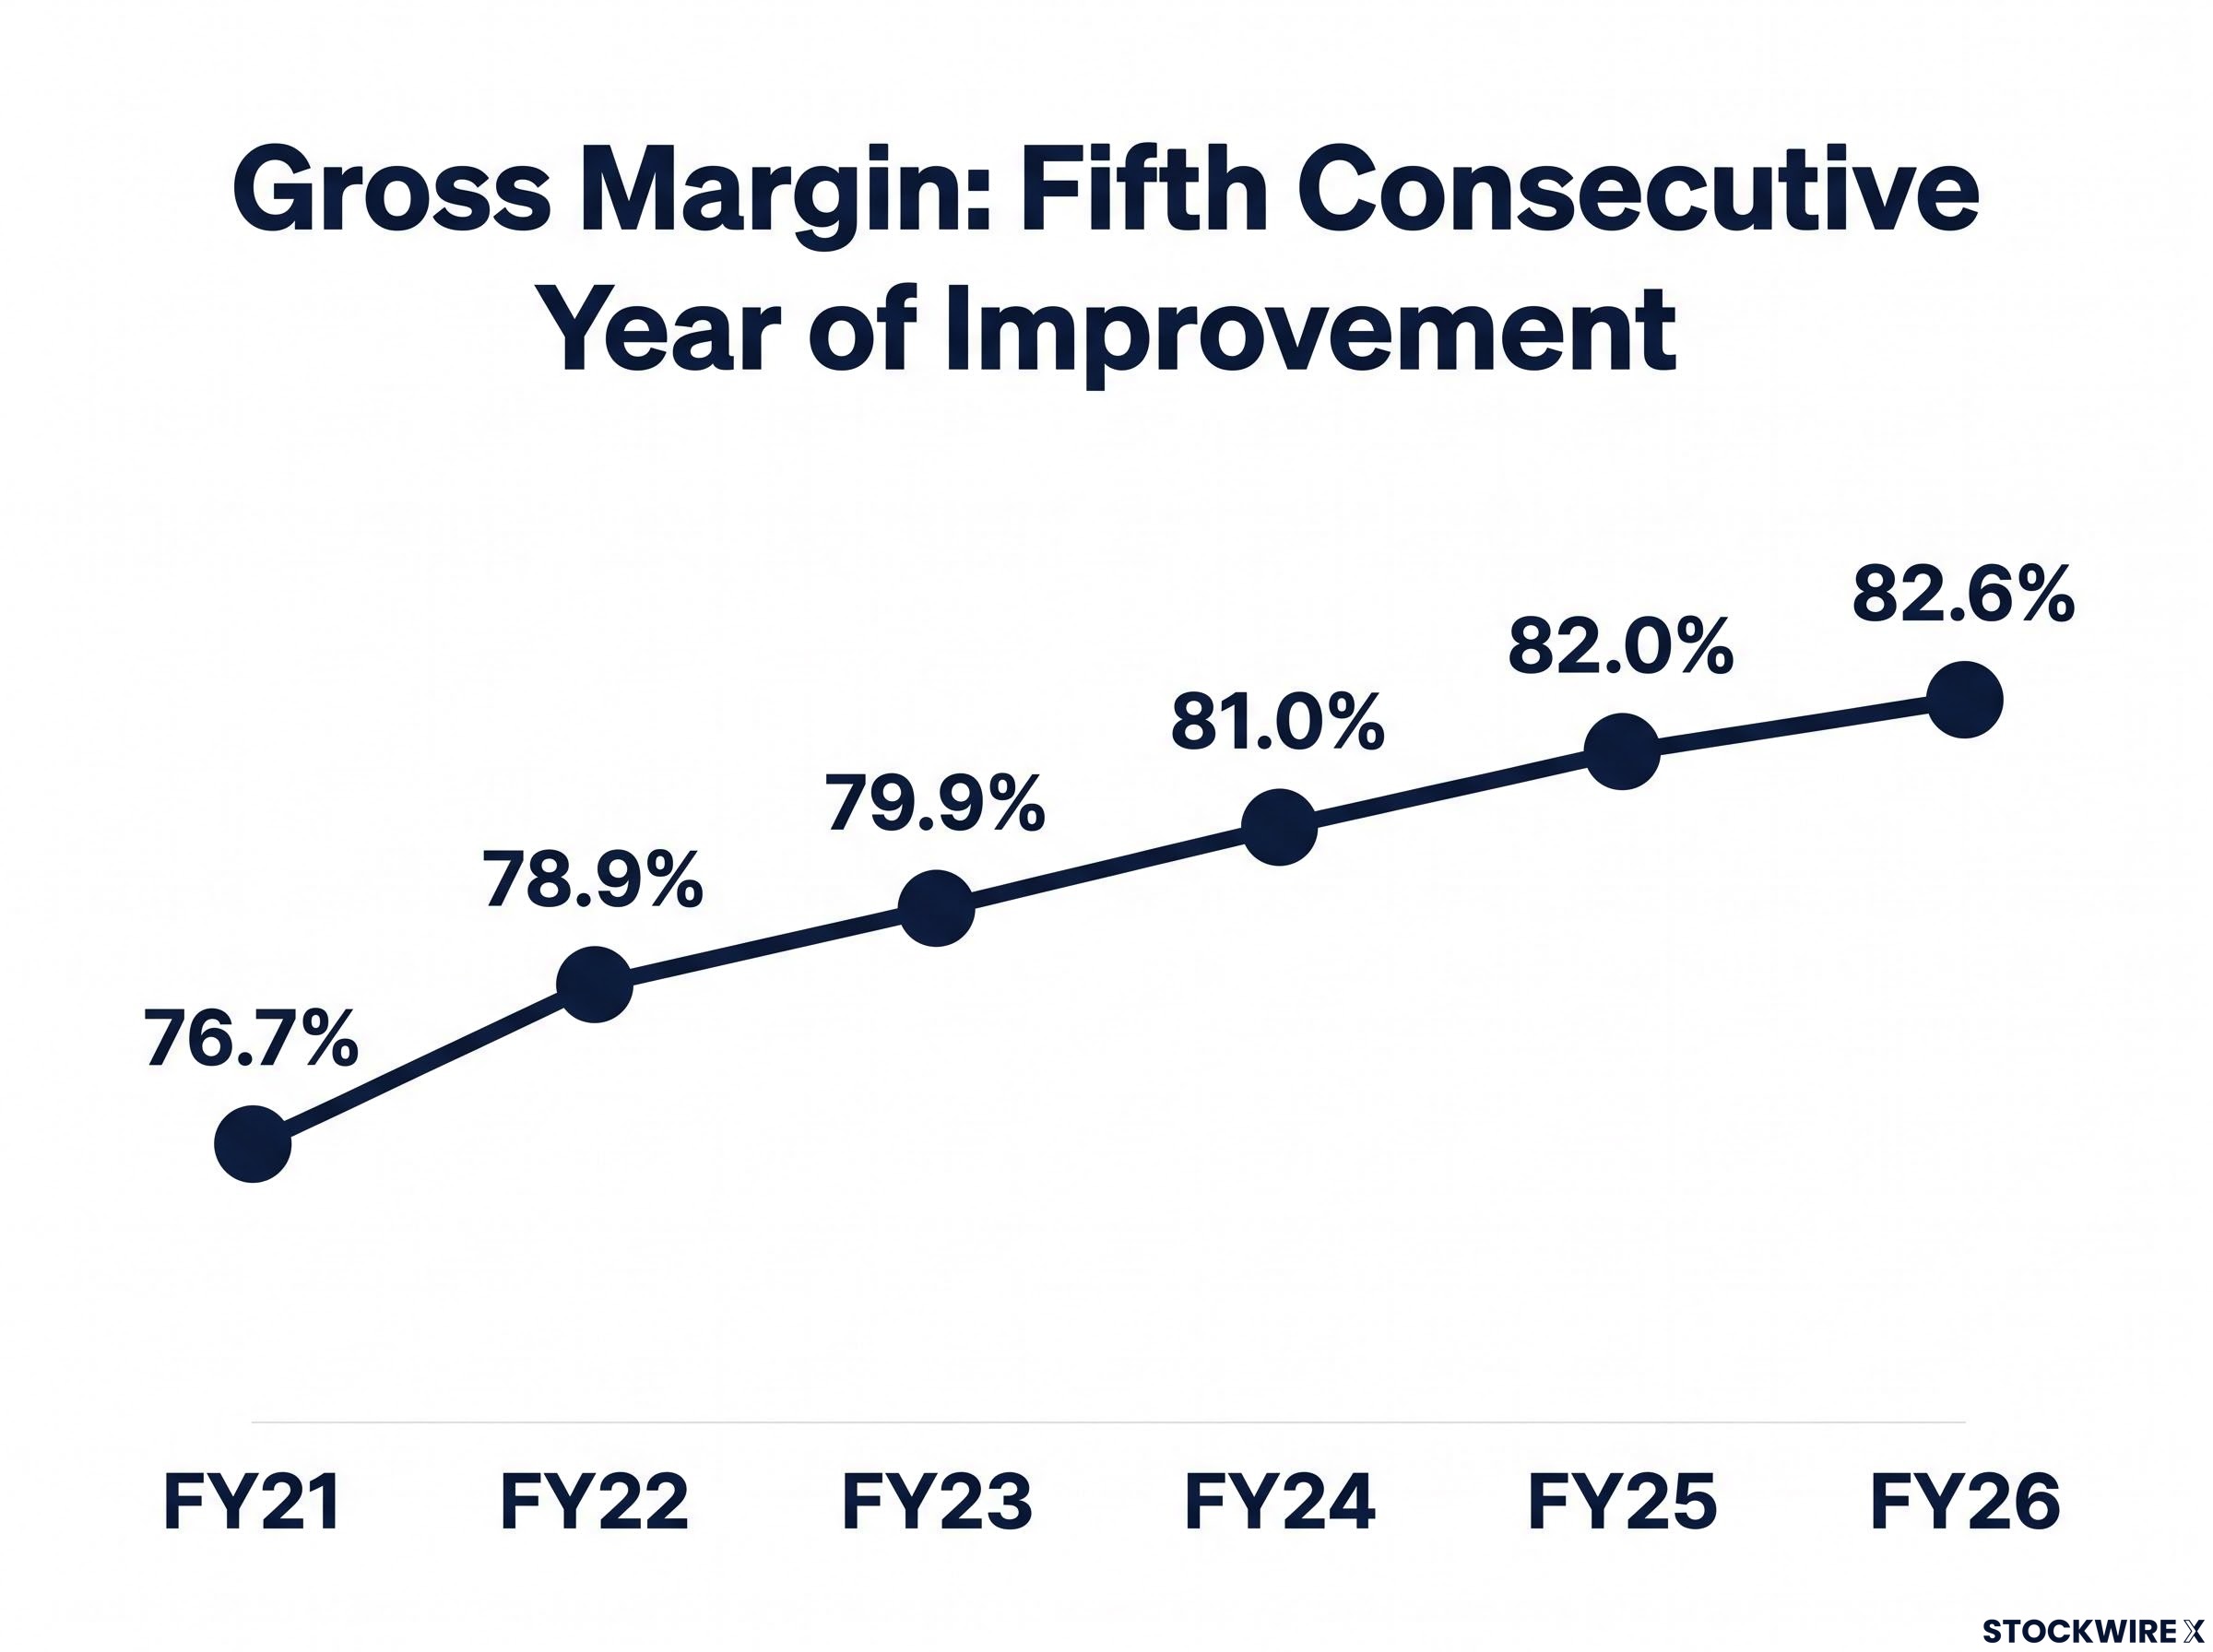
Gross margin expanded 60 basis points to 82.6%, marking a fifth consecutive year of improvement. That figure sits 270 basis points above the FY23 level, a trend management attributed to disciplined product sourcing and retail execution.
The historical trajectory illustrates the steady climb:
- FY21: 76.7%
- FY22: 78.9%
- FY23: 79.9%
- FY24: 81.0%
- FY25: 82.0%
- FY26: 82.6%
For investors, sustained margin discipline supports stronger profit conversion as revenue scales across an expanding store footprint.
Store network passes 1,136 with global rollout accelerating
Store growth remained the central pillar of the FY26 story. The company opened 160 new stores, relocated 12, and closed 43 underperforming stores, delivering a net addition of 105 stores to reach 1,136 outlets trading across more than 50 markets.
Europe delivered the largest share of new store growth, with 76 new stores opened during the year. The standout expansion markets included:
-
United Kingdom: 34 new stores (net +30)
-
Germany: 20 new stores (net +16)
-
USA: 24 new stores (net +21)
-
Canada: 20 new stores (net +20)
-
Six new franchise markets: Reunion, Mauritius, Ghana, Kenya, Burkina Faso and Iraq
The continued momentum across the US and Canadian markets reinforced the Americas as a key growth region, complementing the depth of expansion delivered across Europe.
Series 5 store concept rolling out globally
Alongside network expansion, the presentation outlined the rollout of the new Series 5 store concept, positioned as an investment in the customer experience. To date, 53 Series 5 stores have opened, with a further 28 scheduled for the first half of FY27.
Key features of the upgraded fitout include:
- Store-in-store piercing studio
- Dynamic digital screen integration
- Refined and elevated stainless-steel finishes
- Optimised high-efficiency lighting
- Enhanced aesthetics and ambiance
Cash generation and balance sheet strength
The presentation reinforced the company’s self-funding model, with operating cash flow covering all store investment and full dividend payments. Cash flow from operations rose 21.0% to $294.5m, supported by well-managed working capital.
Capital expenditure totalled $58.5m, which includes 148 new company-owned stores built during the period. The company ended the year with closing cash of $46.7m and net debt of $40.3m.
Debt facilities were extended for three years, with committed cash term debt facilities of $120m to support ongoing global expansion. A final dividend of 33 cents (+22.2%, 50% franked) was approved for payment in October 2026.
Balance sheet highlight
Continued investment in global new store growth comes fully funded from operations, with strong cash flow enabling a 100% payout of NPAT as dividends for the full year.
Understanding comparable store sales
Comparable store sales, often shortened to “comp sales,” measure the sales performance of stores that have been trading for more than one year, before the effect of foreign currency movements. This metric strips out the contribution from newly opened stores.
Why does it matter? Comp sales separate genuine underlying customer demand from growth that simply comes from operating a larger number of stores. A retailer can grow total revenue purely by opening outlets, but comp sales reveal whether the existing network is strengthening.
For Lovisa, comp sales of +2.0% in FY26, accelerating to +3.0% in the first eight weeks of FY27, signal that the established store base is improving, not just the overall store count.
A solid start to FY27 and the road ahead
The trading update pointed to continued momentum into the new financial year. Total sales for the first eight weeks of FY27 rose 16.4% on a constant currency basis, with comparable store sales up 3.0% and improving momentum noted through August.
Management reiterated a long runway for new store growth across both physical and digital formats, supported by structures in place to drive expansion in existing and new markets. A strong balance sheet and extended debt facilities were cited as underpinning continued investment in growth.
The investment thesis presented rests on four pillars: continued global expansion, sustained margin discipline, a self-funding cash model, and a 100% dividend payout of NPAT. Together, these framed FY26 as a year of scaled growth with capital returns maintained.
Don’t Miss the Next Consumer Discretionary Winner on the ASX
Big News Blast delivers FREE breaking ASX announcements directly to your inbox within minutes of release, complete with in-depth analysis already done for you. Join 20,000+ active subscribers who stay ahead of the market the moment news breaks. Click the “Free Alerts” button to start receiving real-time coverage across ASX consumer, retail, and beyond.