
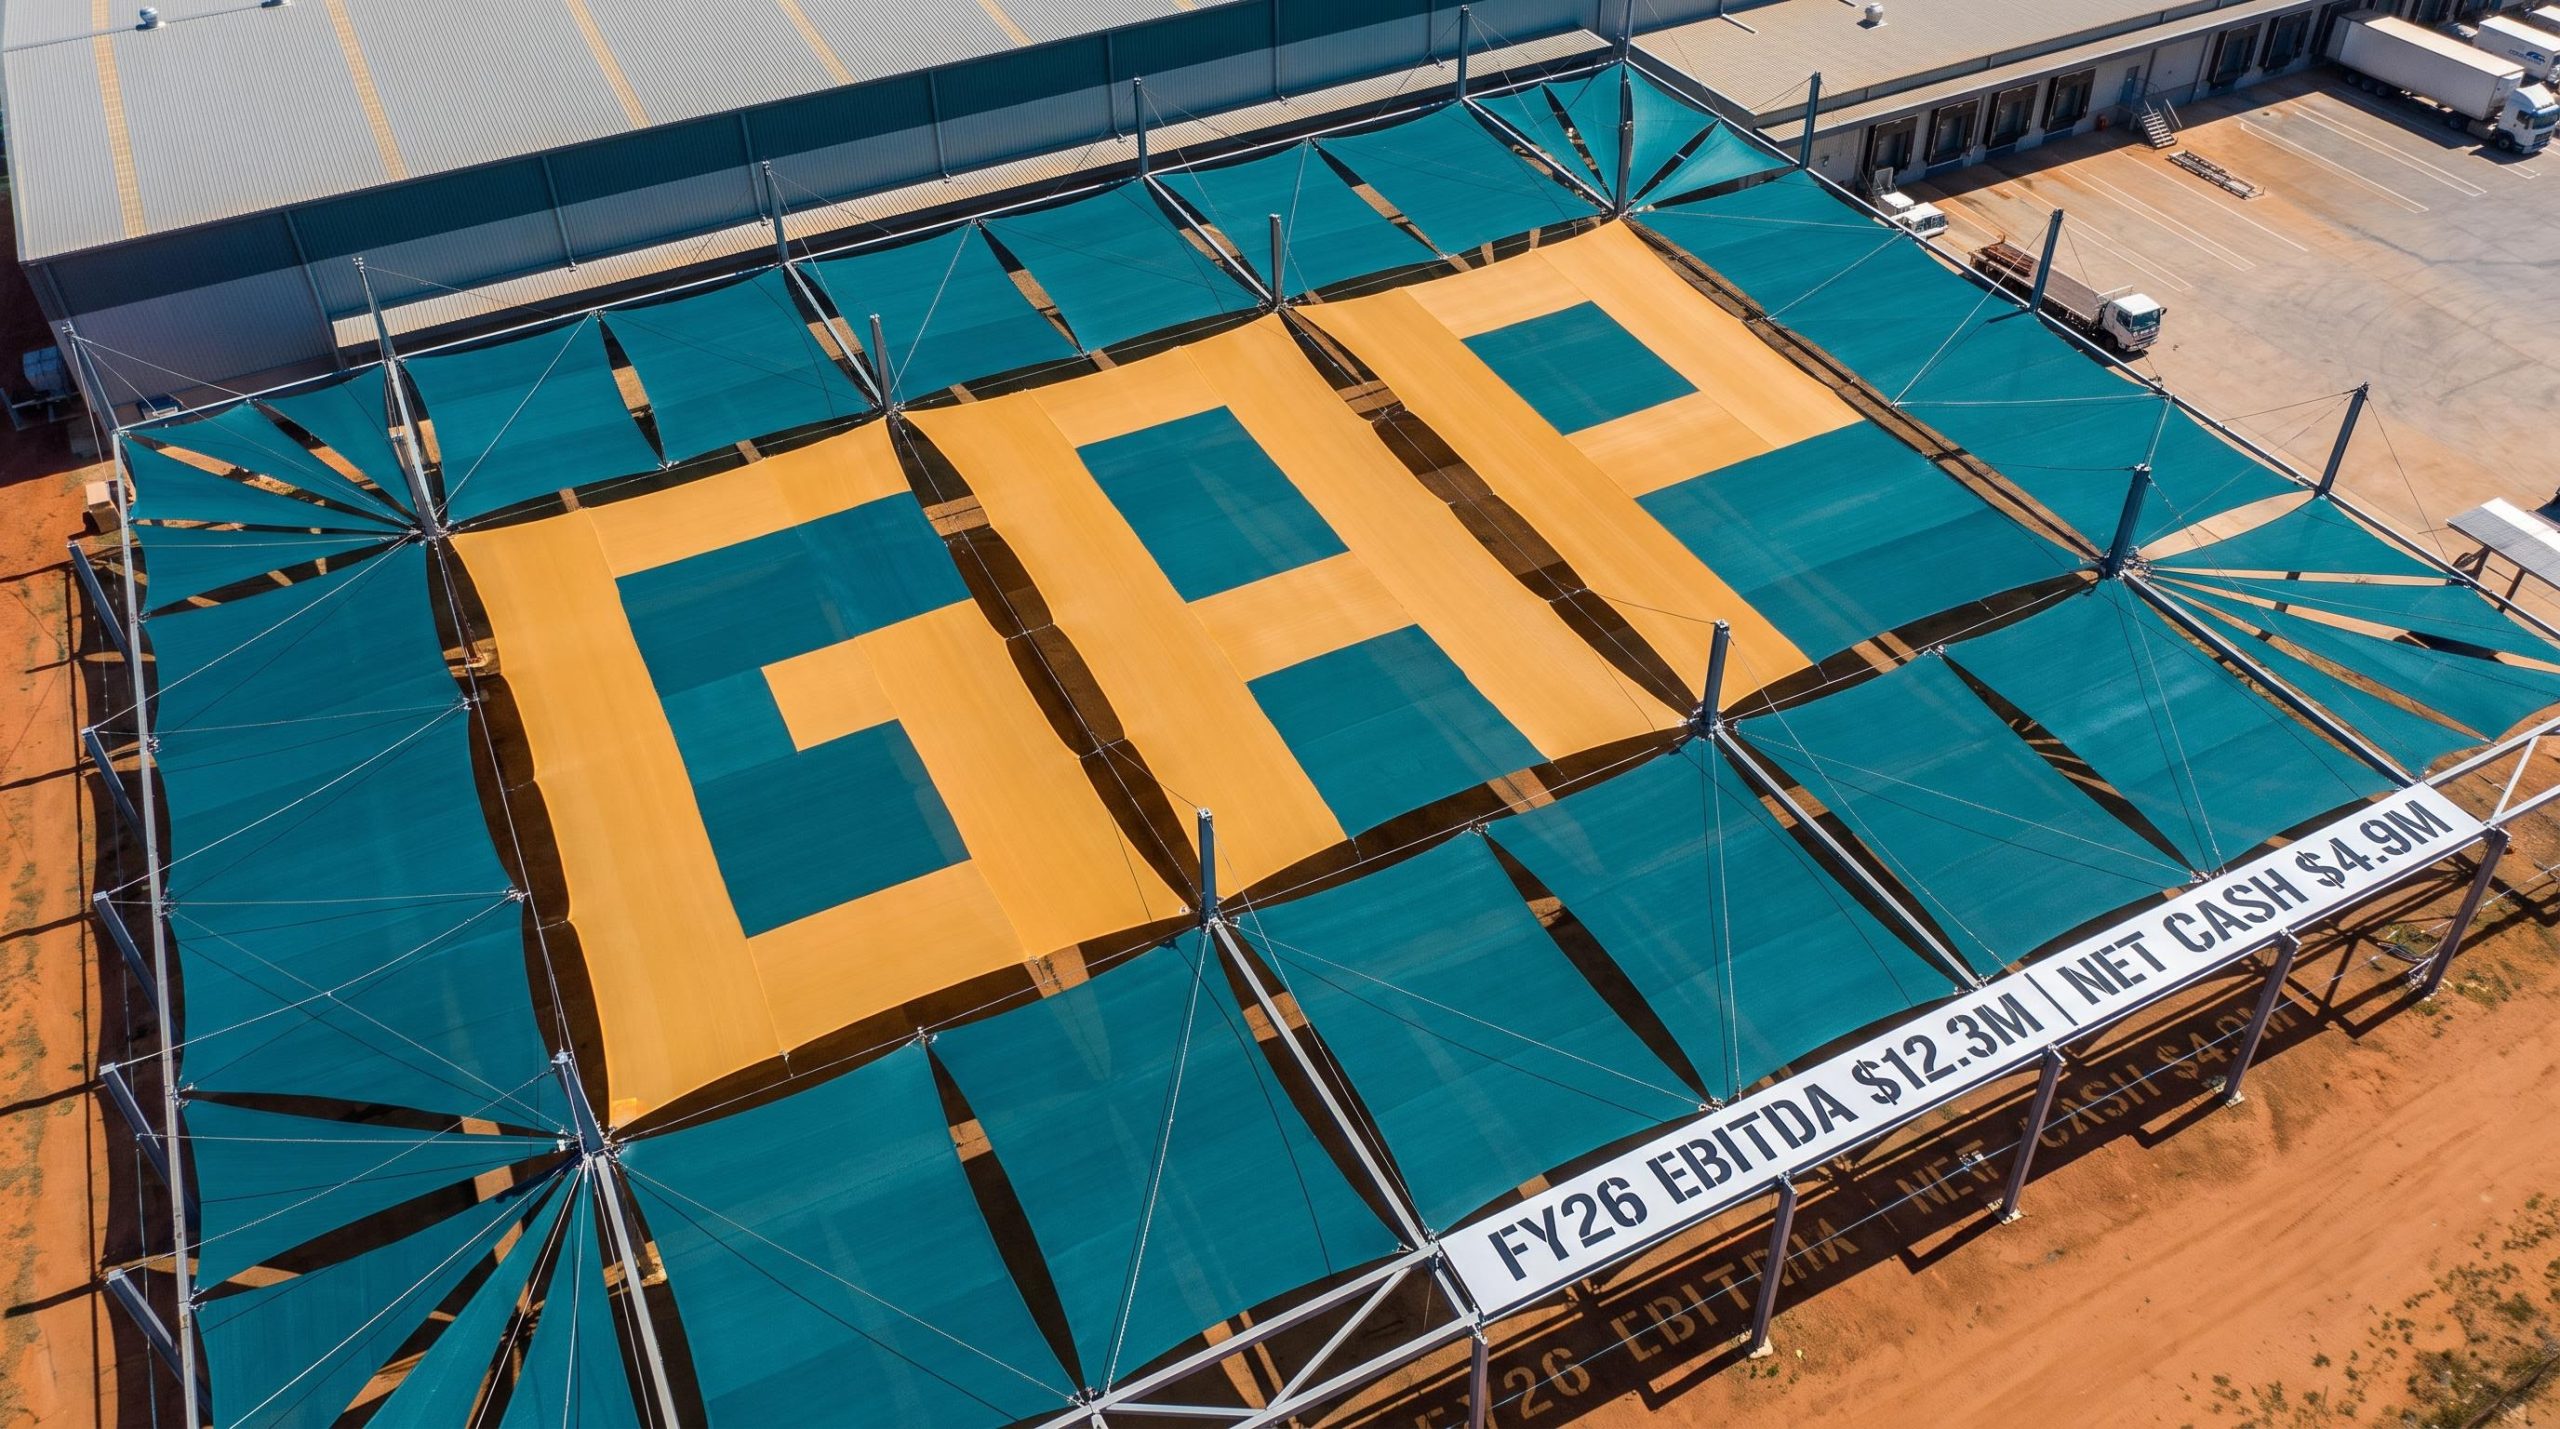
GALE Pacific returns to net cash as margins and cash flow strengthen in FY26
In its FY26 results presentation dated 26 August 2026, GALE Pacific reported a balance sheet reset that saw the shade solutions manufacturer return to net cash despite a softer top line. The GALE Pacific FY26 results showed revenue easing 9.6% to $155.5m, yet EBITDA rose 2.5% to $12.3m as margins expanded.
Management framed FY26 as a foundation year, prioritising cost discipline, inventory reduction and cash generation ahead of a fuller execution phase in FY27. Operating cash flow surged to $21.4m from $0.1m, while the Company moved to a net cash position of $4.9m from $8.9m net debt. The net loss after tax narrowed to $(2.9)m from $(5.2)m, underlining a quality-of-earnings story built on efficiency rather than volume.
When big ASX news breaks, our subscribers know first
FY26 results at a glance
The headline group financials illustrate how margin and cash improvements were delivered against a backdrop of lower sales. All figures are in A$ millions, with the prior comparative period (PCP) being FY25.
| Metric | FY26 | FY25 | Change |
|---|---|---|---|
| Revenue | $155.5m | $172.0m | ▼ 9.6% |
| EBITDA | $12.3m | $12.0m | ▲ 2.5% |
| EBITDA Margin | 7.9% | 7.0% | ▲ 0.9 ppt |
| Operating Cash Flow | $21.4m | $0.1m | ▲ $21.3m |
| Net Cash/(Debt) | $4.9m | $(8.9)m | ▲ $13.8m to net cash |
| Net Loss After Tax | $(2.9)m | $(5.2)m | ▲ Loss down $2.3m |
| Inventory | $42.7m | – | ▼ $8.6m |
| Working Capital/Sales | 33.4% | 35.5% | ▼ 2.1 ppt |
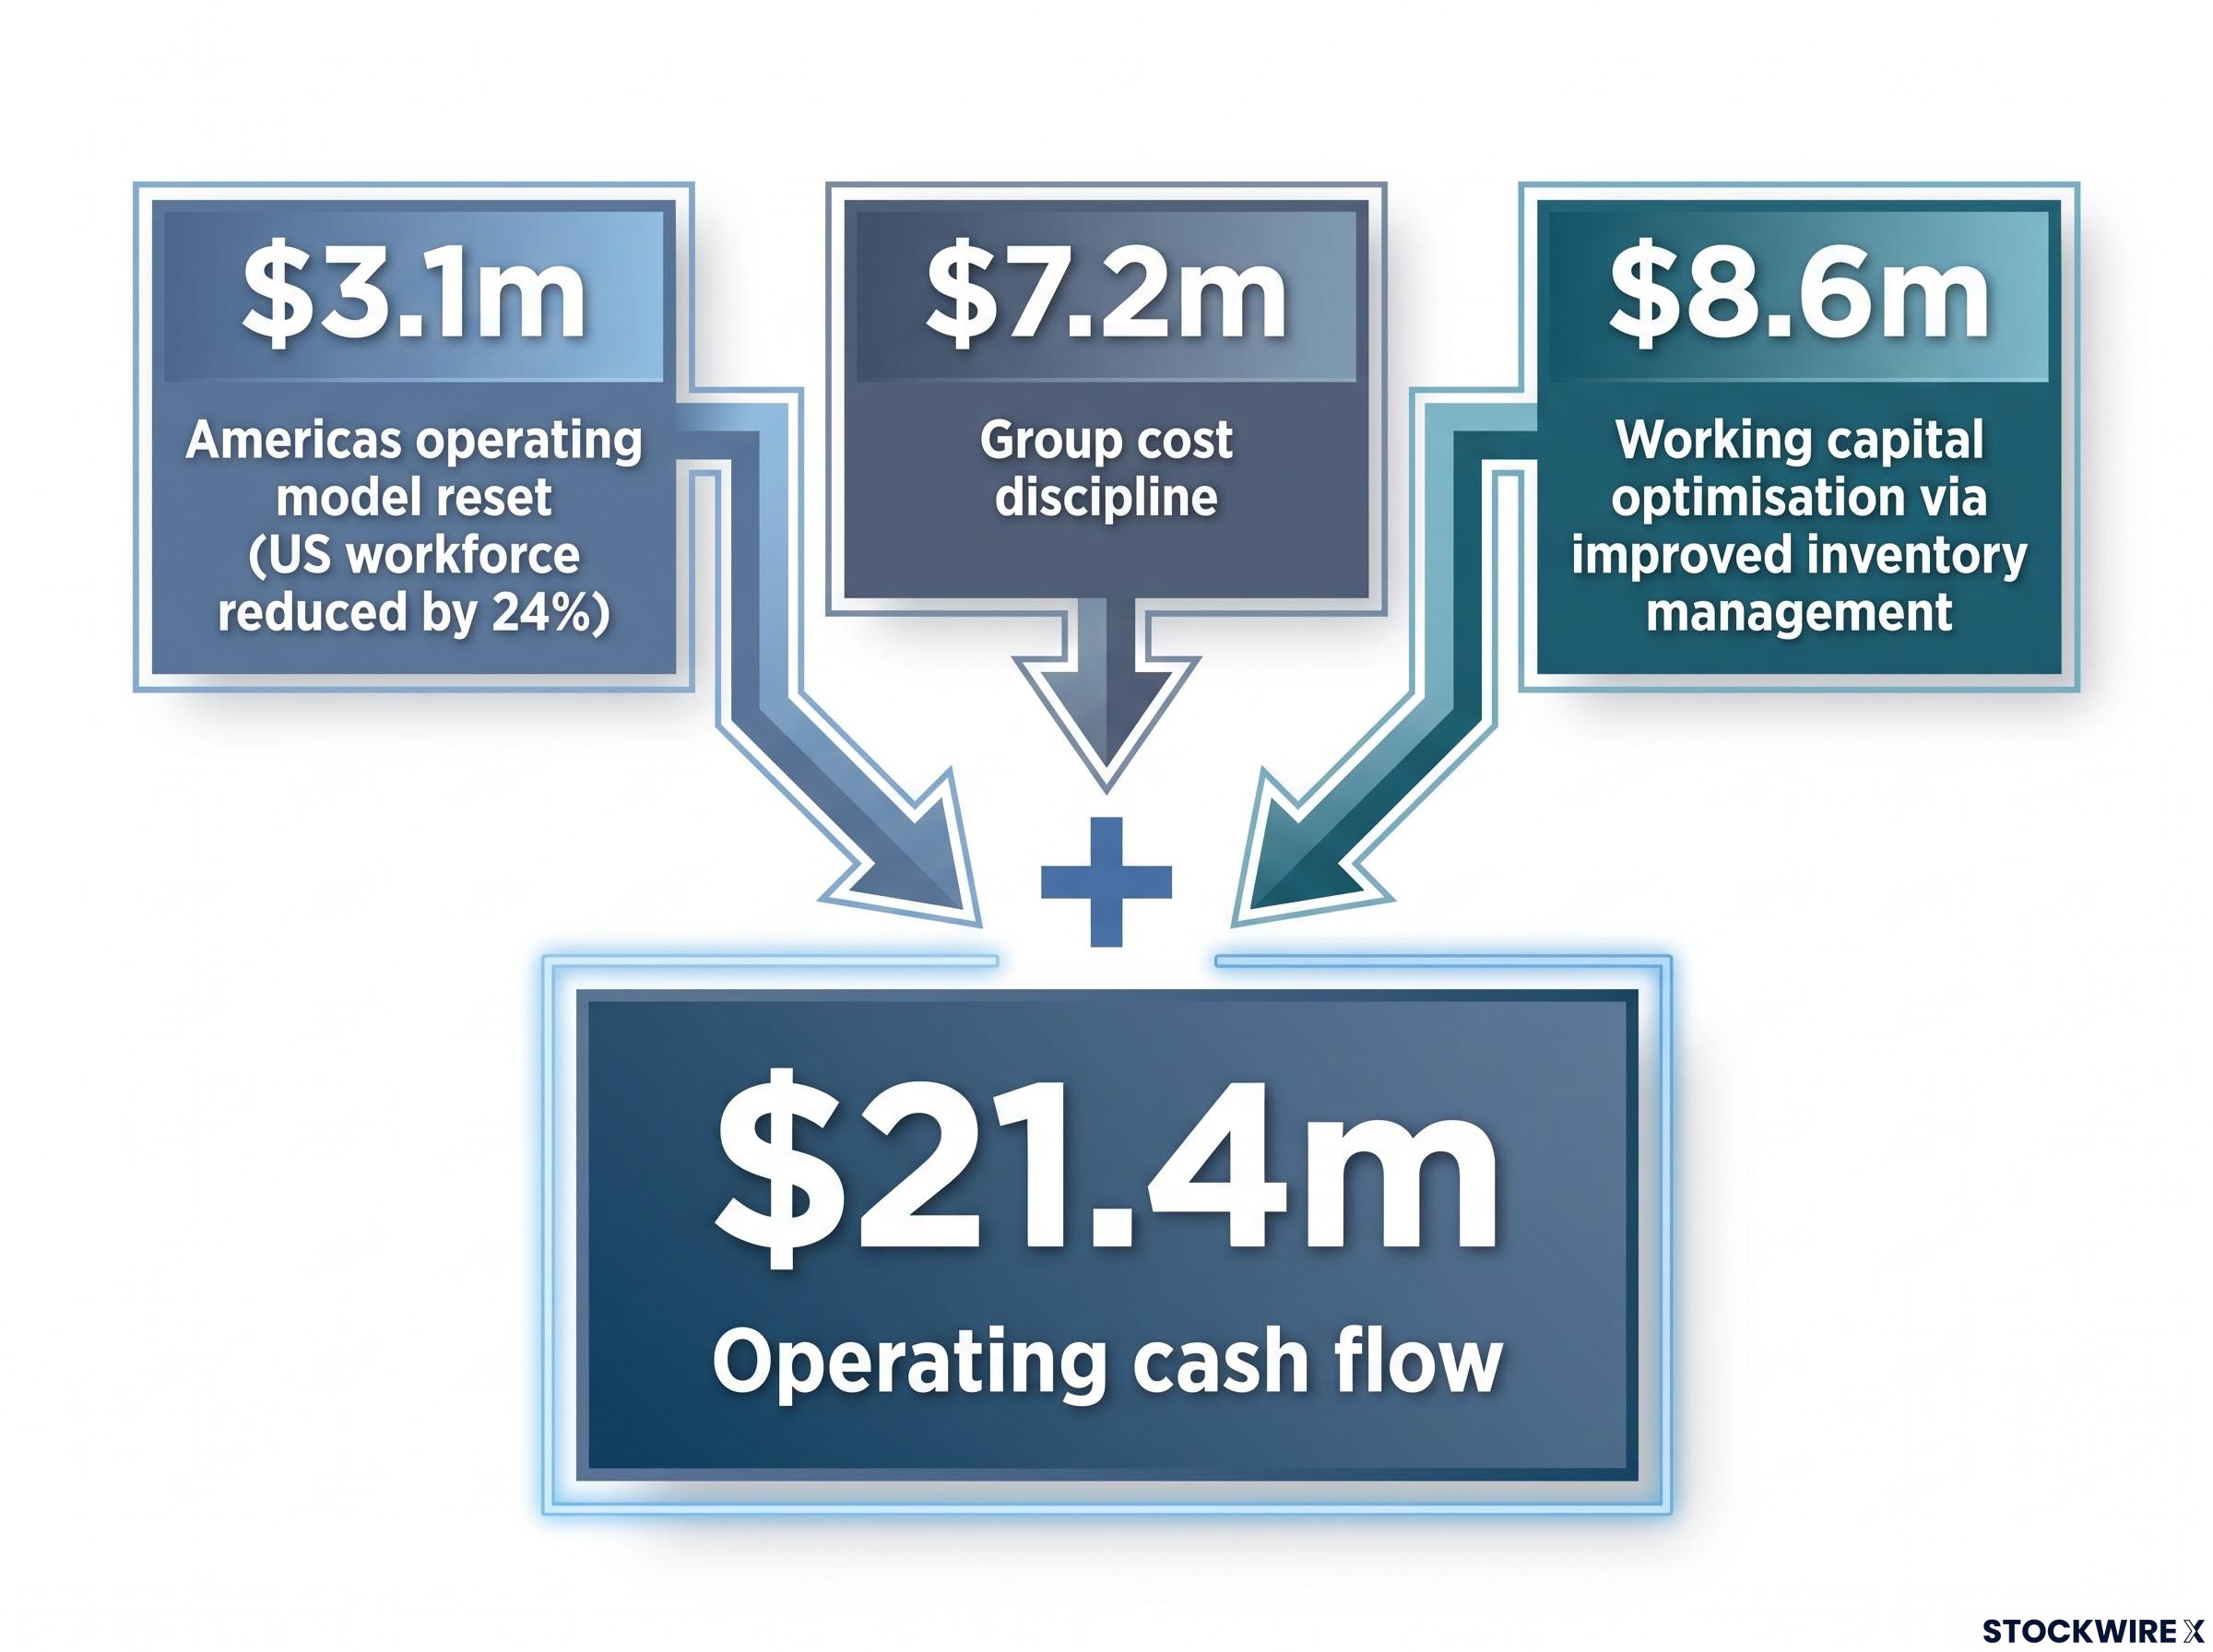
The presentation attributed the improvement to three value creation drivers:
-
$3.1m — Americas operating model reset, with the US workforce reduced by 24%.
-
$7.2m — Group cost discipline through efficiency and cost initiatives, inclusive of the Americas reset.
-
$8.6m — Working capital optimisation via improved inventory management, driving the $21.4m operating cash flow.
How the regions performed
Performance across the three reporting segments varied, with Australia & New Zealand and US retail expansion offsetting softness in Developing Markets.
Americas
The Americas recorded revenue of $64.3m, down 15%, with EBITDA of $13.1m, down 11%, though the margin edged up 0.8pp to 20.4%. Management noted a deliberate inventory reset aligned to consumer sell-through, alongside softer US retail demand through the peak summer season.
Owned e-commerce channels delivered close to 100% year-on-year sales growth. The segment also secured supply agreements with Menards (~350 stores), Do it Best (~3,200 stores) and Orgill, a distributor serving ~12,000 retail outlets across North America.
The Gale Pacific growth strategy presented at the Braeside investor day earlier in 2026 set out the mechanics behind the Americas reset in detail, including the 25% workforce reduction and the plan to replicate ANZ category depth across a US retail footprint ten times the size of Bunnings.
Australia & New Zealand
ANZ delivered the standout earnings story, with EBITDA up 22% to $11.5m and the margin expanding 3.2pp to 15.1%, despite revenue easing 4% to $76.4m. Core Bunnings shade categories grew, and a successful end-of-season gazebo trial is supporting planned FY27 store expansion.
The Company reported 10% underlying growth across architectural shade and water containment, and renewed a long-term paper coating agreement with Visy, providing a stable platform for future commercial volumes.
Developing Markets
Developing Markets recorded revenue of $14.8m, down 12%, with EBITDA of $4.1m, down 41%, at a margin of 27.7%. Middle East conflict constrained growth in Q3 before a Q4 recovery. Europe delivered 10% growth on strong northern hemisphere summer demand, and a new business development resource was appointed in India.
Why margin and cash flow matter more than revenue right now
A declining top line does not always indicate a weaker business. EBITDA margin measures how efficiently a company converts sales into earnings, so a rising margin on lower revenue signals improved profitability per dollar of sales.
Operating cash flow reflects the actual cash a business generates from its day-to-day trading, while net cash versus net debt shows whether a company holds more cash than borrowings. In FY26, GALE Pacific cut costs, reduced inventory and moved to a net cash position, signalling stronger financial resilience even as sales fell.
For investors, this reframes the narrative: the Company generated materially more cash and strengthened its balance sheet, providing a firmer platform to fund future growth initiatives.
Strategic priorities and FY27 outlook
Management positioned FY27 as the first full year of execution under a refined strategy, building on the operational reforms established in FY26. Four strategic priorities were outlined:
-
Accelerate Commercial segment growth via expanded business development capability.
-
Scale the US Consumer business by replicating the proven ANZ model across a significantly larger retail footprint.
-
Increase end-user demand generation to strengthen consumer preference and retailer sell-through.
-
Continue operational optimisation across manufacturing, supply chain and distribution networks.
The outlook commentary balanced opportunity against external risk:
-
Americas consumer demand is expected to remain constrained amid soft consumer confidence.
-
Middle East demand is expected to remain sensitive to geopolitical developments.
-
Australian summer demand may benefit from forecast hotter and drier El Niño conditions.
-
The Company plans to maintain a disciplined focus on profitable growth, with a performance update to be provided at the Annual General Meeting.
On operations, the presentation detailed that roller shade fabric manufacturing trials with the Thai production partner were completed, with low-volume commercial production targeted during FY27. In China, the first phase of warehouse consolidation was completed.
Key takeaways
The FY26 results present a “stronger foundations, sharper focus” theme. GALE Pacific returned to net cash, generated materially stronger operating cash flow, lowered inventory and moved to a leaner operating model, though management was candid that profitability remained below expectations.
The use of “restoring” indicates a return to prior profitability rather than a first-time objective, consistent with a reset year narrative.
The Company’s primary objective remains restoring sustainable profitability. FY27 will build on the stronger foundations established in FY26, combining profitable growth initiatives with continued operational and financial discipline.
For those tracking the GALE Pacific share price (ASX: GAP), FY26 delivered a balance sheet transformation and improved cash generation, setting a foundation that management intends to convert into profitable growth across FY27.
Don’t Miss the Next Consumer Sector Turnaround
Big News Blast delivers FREE breaking ASX news and in-depth analysis to your inbox within minutes of release. Over 20,000 active subscribers are already getting the full picture the moment announcements hit. Click the “Free Alerts” button to stay ahead of consumer sector moves before the broader market catches on.