

In its FY26 full year results presentation for the year ended 30 June 2026, CAR Group (ASX: CAR) reported double-digit growth across every key financial metric, with proforma revenue reaching $1,253m, up 12% in constant currency (CC) and 10% in Australian dollar (AUD) terms.
Proforma EBITDA of $700m rose 12% (CC) and 9% (AUD), while adjusted NPAT of $407m climbed 11% (CC) and 8% (AUD). Reported NPAT reached $314m, up 14% in AUD. The result spanned five global markets, with every key segment delivering growth, and management pointed to a strong FY27 outlook.
A closer look at the FY26 numbers
The headline scorecard showed consistent performance across earnings, with the proforma EBITDA margin held at 56% and cash conversion at 100%.
| Metric | FY25 | FY26 | Growth (CC) | Growth (AUD) |
|---|---|---|---|---|
| Proforma Revenue | $1,144m | $1,253m | 12% | 10% |
| Proforma EBITDA | $641m | $700m | 12% | 9% |
| Adjusted NPAT | $377m | $407m | 11% | 8% |
| Reported NPAT | $274m | $314m | n/a | 14% |
| Adjusted EPS | 99.8c | 107.6c | 11% | 8% |
| Full Year Dividend | 80.0c | 86.0c | n/a | 8% |
Key supporting points from the presentation included:
- 56% proforma EBITDA margin, maintained year on year
- 100% cash conversion
- Net Debt:EBITDA of 1.7x, reflecting prudent leverage
- A final dividend of 43.5 cents declared, taking the full year to 86.0 cents (up 8%)
- An effective tax rate of approximately 20%, benefitting from incremental tax savings under the US One Big Beautiful Bill Act
When big ASX news breaks, our subscribers know first
A track record of compounding growth
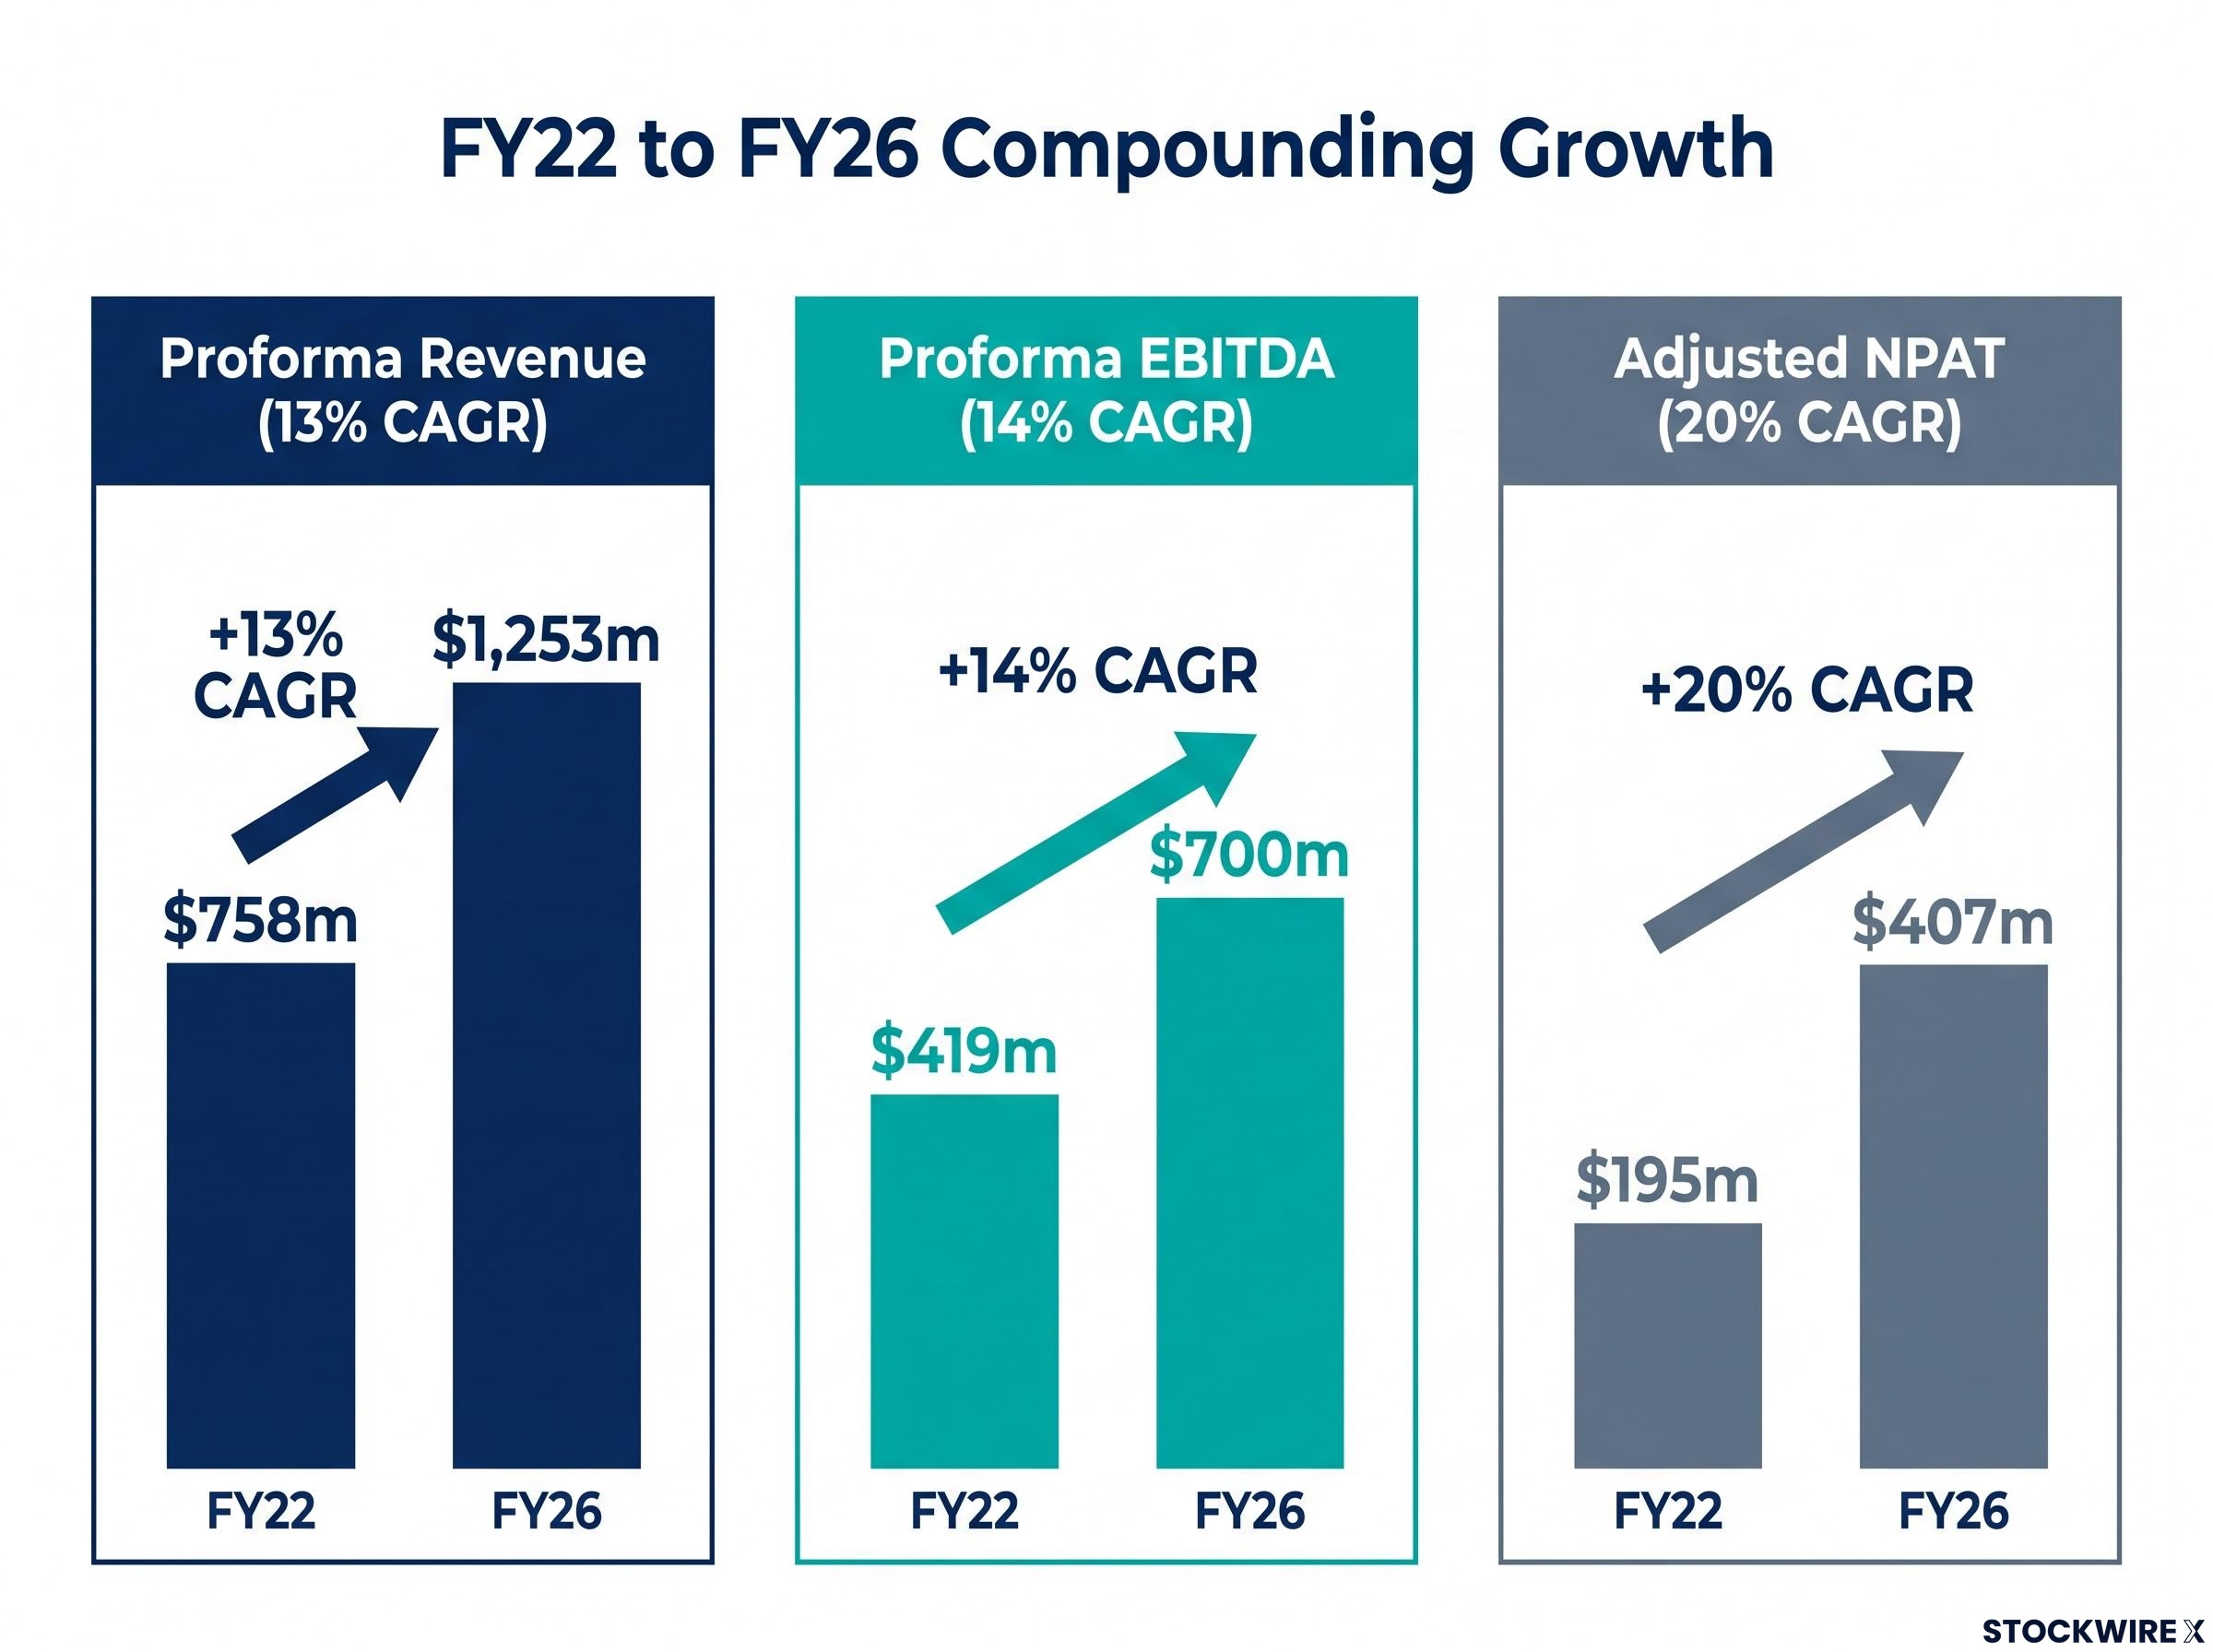
Management framed FY26 within a multi-year trend of consistent compounding across cycles. On a constant currency basis, proforma revenue has grown at a 13% CAGR since FY22, rising from $758m to $1,253m. Proforma EBITDA has compounded at 14% (FY22 $419m to FY26 $700m), and adjusted NPAT at 20% (FY22 $195m to FY26 $407m).
The presentation reinforced the resilience factors underpinning this consistency:
- Used vehicles are less cyclical than new vehicle transactions and form the largest, most consistent part of the market
- Dealers and OEMs rely on the marketplaces to move inventory in any economic environment, including when interest rates are high
- Marketplaces deliver a high return on investment, making them the channel dealers retain when others are cut
- The subscription model in the US and South Korea drives high recurring revenue
- The cost base has a good level of flexibility
- Diversity of geographies and industries provides resilience
How CAR Group makes its money
CAR Group operates online vehicle marketplaces, holding the number one brand position in every market across four regions. For readers unfamiliar with the model, these marketplaces connect dealers, private sellers, and buyers, earning revenue from dealers (through listings and depth products), private sellers, media and advertising, and data services.
Scale and proprietary data create a competitive advantage. The company reported the following operational metrics for FY26:
- 2.4 million vehicles online
- 50 thousand subscribed dealers
- 1.3 billion total sessions
- 52 million unique monthly audience
- 23 million dealer leads delivered
Central to the strategy is the CG/engine, CAR Group’s proprietary AI platform. Management described it as running on the company’s own infrastructure and fine-tuned on two decades of vehicle transaction data across five markets. Owning the data and IP is intended to protect intellectual property, control token and infrastructure cost, and build a compounding advantage. The presentation noted AI-led conversational search examples including a 26% uplift in session-to-lead conversion on carsales, and webmotors buyers being 4x more likely to submit a lead.
Segment performance across four regions
Every geographic segment delivered growth in FY26, with growth rates differing between constant currency and AUD terms.
| Segment | Revenue FY26 | Revenue Growth (CC) | EBITDA FY26 | EBITDA Growth (CC) |
|---|---|---|---|---|
| Australia | $519m | 7% | $345m | 8% |
| North America | $327m | 12% | $197m | 12% |
| Latin America | $251m | 19% | $96m | 23% |
| Asia | $145m | 15% | $65m | 14% |
- Australia: Continued market leadership and depth product uptake supported growth, while electric and hybrid inventory on carsales rose 32%. C2C payments reached $440 million of transactions since launch.
- North America: Trader Interactive demonstrated strength, with direct media revenue up 62%. The marine initiative (Boatmart) saw leads per dealer up 47%.
- Latin America: webmotors delivered standout growth. The Wallet loyalty program is being used by over 11,600 dealers, with Wallet revenue up 30%, and OEM media revenue up 38%.
- Asia: Encar Guarantee penetration expanded, Encar Home transactions rose 65%, and Dealer Direct Meet-Go and Plus volume increased 89%.
Cash generation and balance sheet strength
Operating cash flow reached $669m in FY26, up from $605m in FY25, reflecting 100% EBITDA to cash conversion and the attractive working capital profile of marketplace business models.
Net debt stood at $1,198m at June 2026 (Jun-25: $1,079m), with leverage steady at 1.7x. Growth capex of $130m represented a stable 10% of revenue, directed towards C2C payments, Wallet, media, marine, and South Korea branch upgrades. The company noted that refinancing of its bank facilities was completed in August 2026, extending maturities and adding funding capacity.
What CAR Group expects in FY27
Management provided a forward outlook expressed as constant currency growth versus FY26. All figures are dependent on prevailing macroeconomic conditions, geopolitical risk, customer demand, and movements in inflation and FX rates.
- Revenue growth: 11–14% (CC)
- Adjusted EBITDA growth: 10–13% (CC)
- Adjusted NPAT growth: 9–12% (CC)
By region, Australia is expected to deliver high single-digit revenue growth, while North America, Latin America, and Asia are each anticipated to achieve double-digit CC revenue growth. Management noted that North America and Asia EBITDA growth is expected to trail revenue growth due to ongoing investment in marine and Dealer Direct respectively.
Management commentary
The presentation summarised the key takeaways from the FY26 result.
CAR Group FY26 Key Takeaways
Management highlighted double-digit growth in proforma revenue, proforma EBITDA and adjusted NPAT in constant currency, with Group EBITDA margins maintained at 56% while investing in Marine (US) and Dealer Direct (Korea). AI product development continued at pace, sharpening the customer experience, and AI-driven operational efficiencies delivered greater speed, accuracy and scale with no incremental investment required. Management also pointed to an excellent FY27 outlook.
Why it matters for investors
CAR Group’s FY26 result demonstrated consistent compounding growth through economic cycles, supported by number one market positions in every geography and a maintained EBITDA margin of 56%. The combination of proprietary data and the CG/engine AI platform is positioned to reinforce the company’s competitive standing across its ecosystems.
The FY27 outlook points to a continued growth runway, with double-digit revenue growth targeted across three of four regions in constant currency terms. Management estimates a Group total addressable market of approximately $16,380m across all regions, suggesting scope for further expansion should the company continue to convert its scale and data advantages into recurring revenue.
Don’t Miss the Next Tech & Media Market Mover
Big News Blast delivers FREE breaking ASX news and in-depth analysis directly to your inbox within minutes of release. Join 20,000+ investors who stay ahead of the market the moment announcements drop. Click the “Free Alerts” button at Big News Blast to start receiving real-time alerts today.