Why Australian Investment Grade Bonds Now Yield 6-7%
8 mins ago
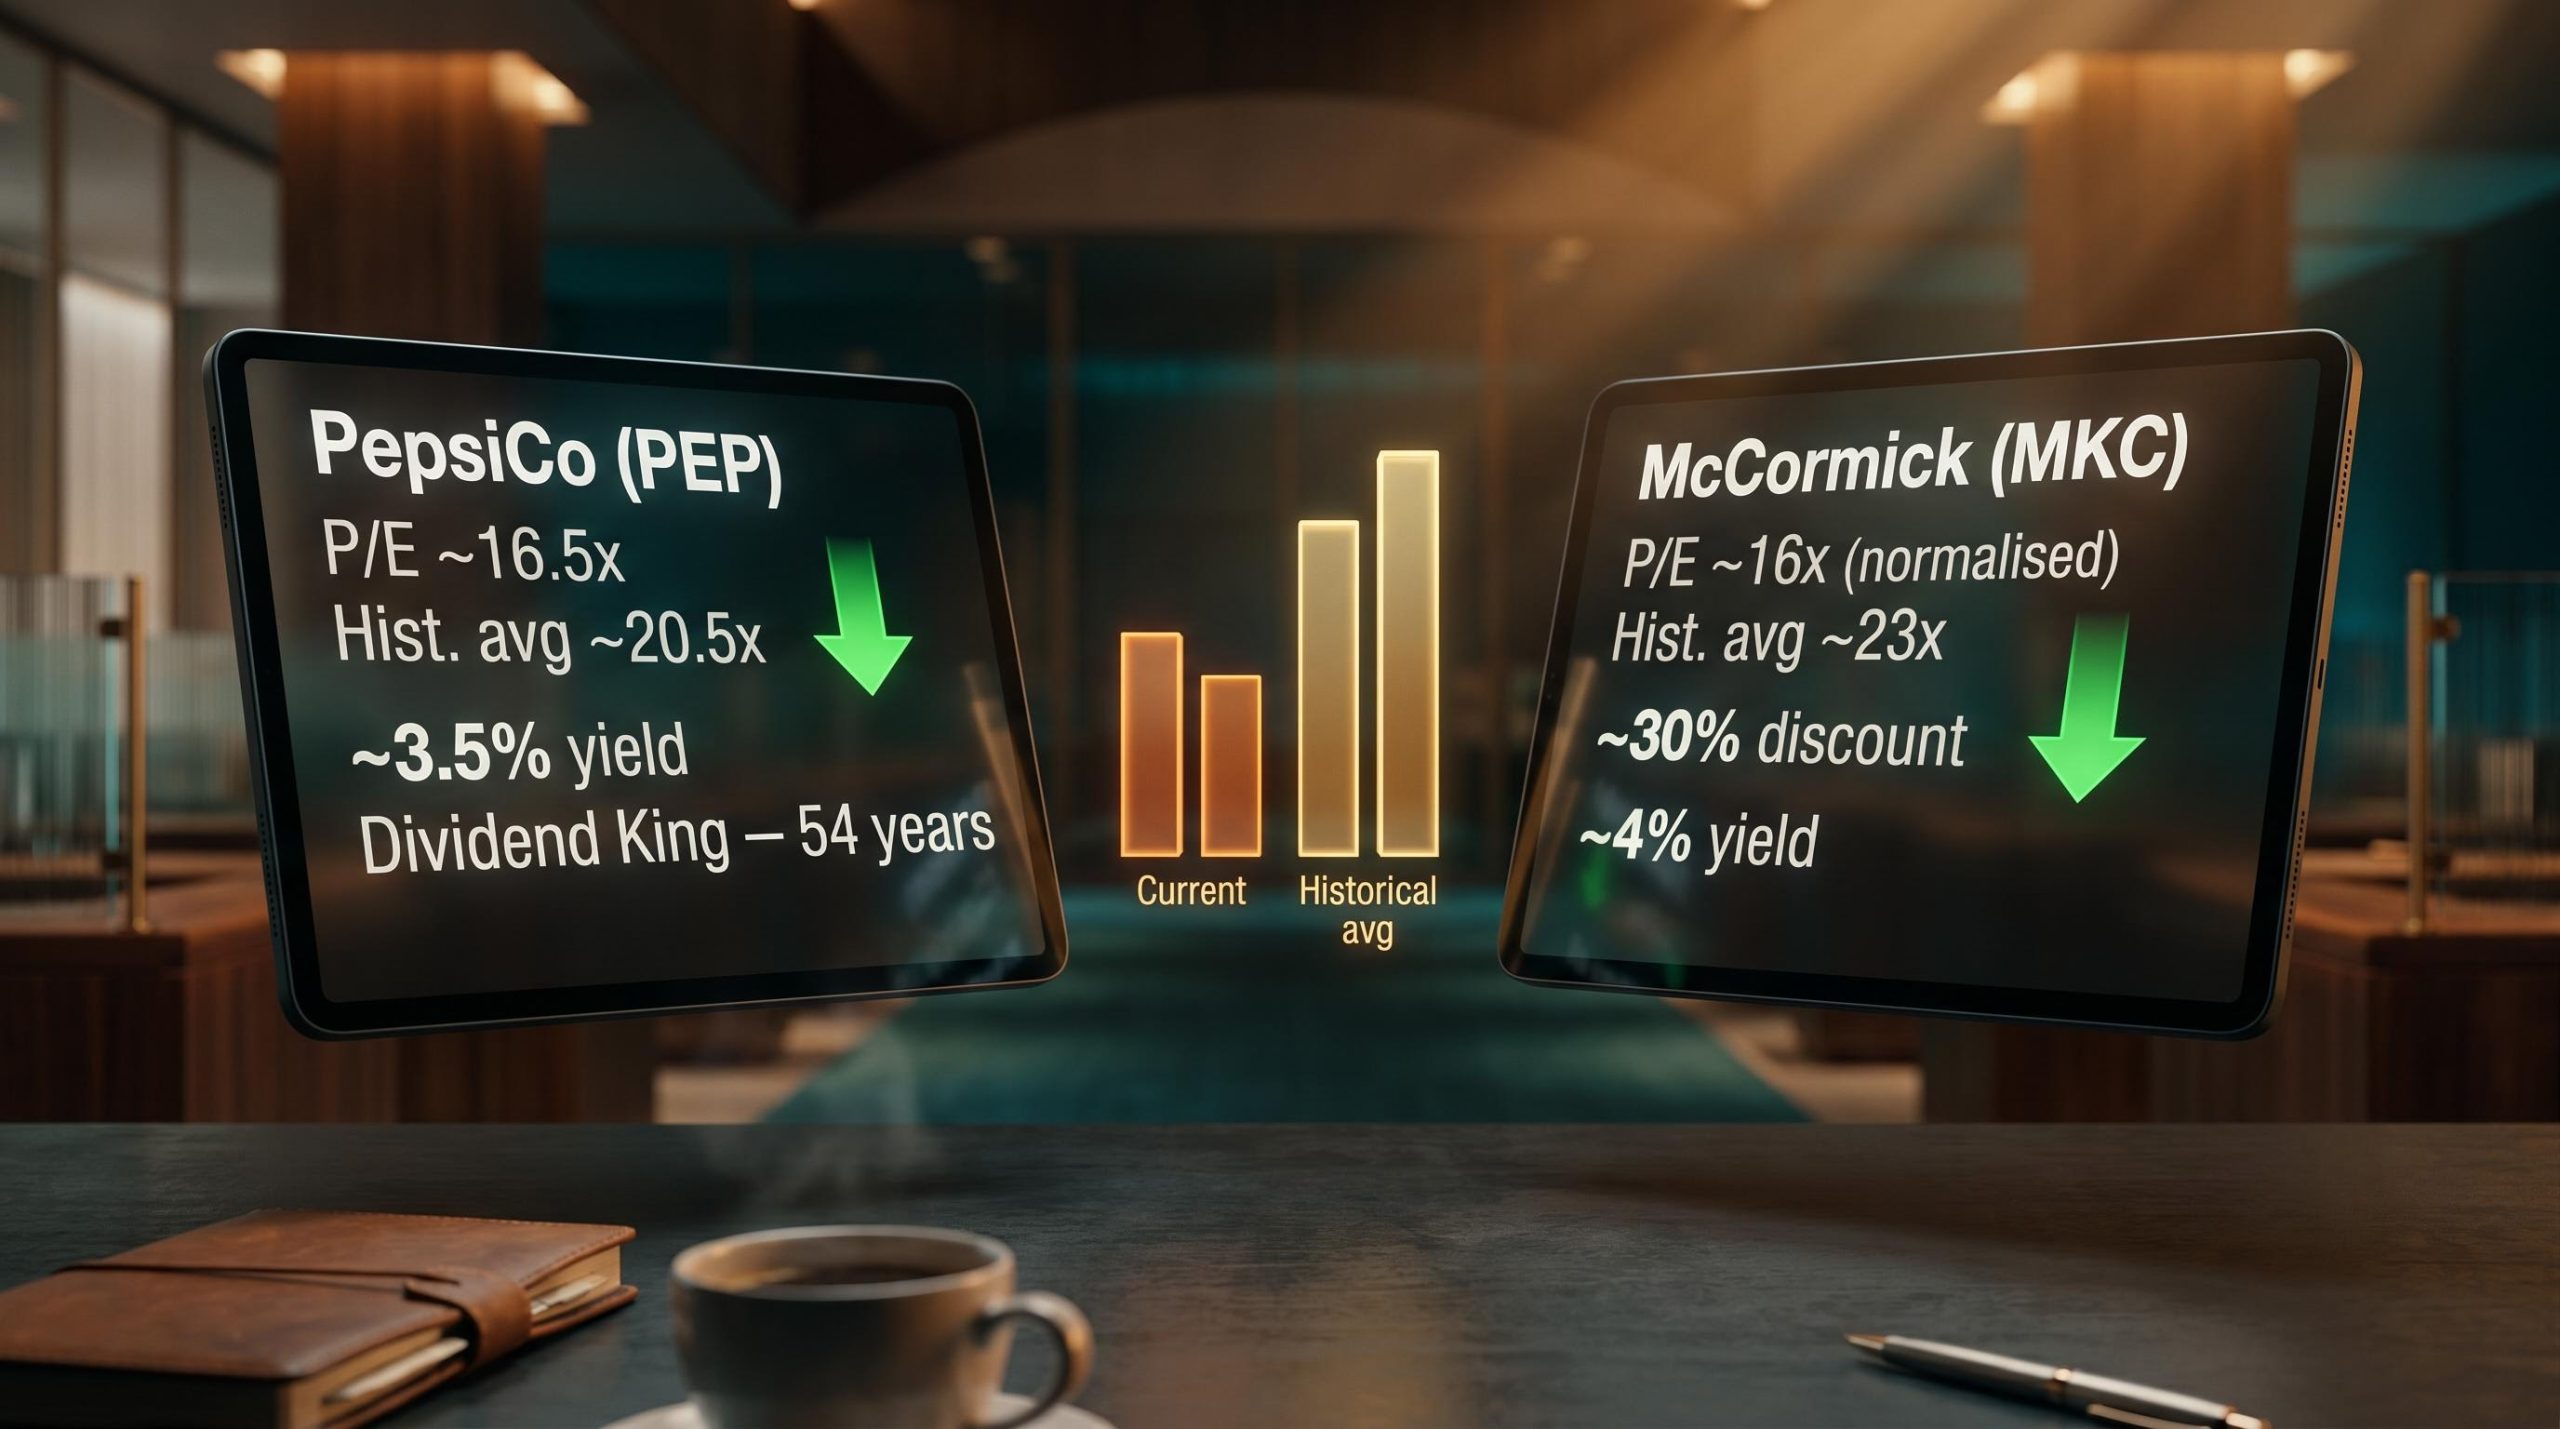
PepsiCo and McCormick are trading at price-to-earnings multiples not seen in roughly 15 years. PepsiCo sits at approximately 16.5x blended earnings. McCormick, once you strip out non-recurring accounting noise, is at roughly 16x. Both are well below the premium valuations these businesses have carried for most of the past two decades.
For income-focused investors, that discount creates an uncomfortable question. Compressed multiples on long-tenured dividend growers can signal a genuine entry point, or they can signal that the market has correctly identified a structural deterioration the dividend streak cannot paper over. In mid-2026, with elevated payout ratios and modest organic growth complicating the picture, the distinction matters.
Here is the specific arithmetic of what a partial or full reversion to historical multiples could deliver in annualised total returns through 2028 for both stocks, alongside the precise conditions that would need to hold and the risks that could prevent the thesis from materialising. The numbers give you a framework for making your own call.
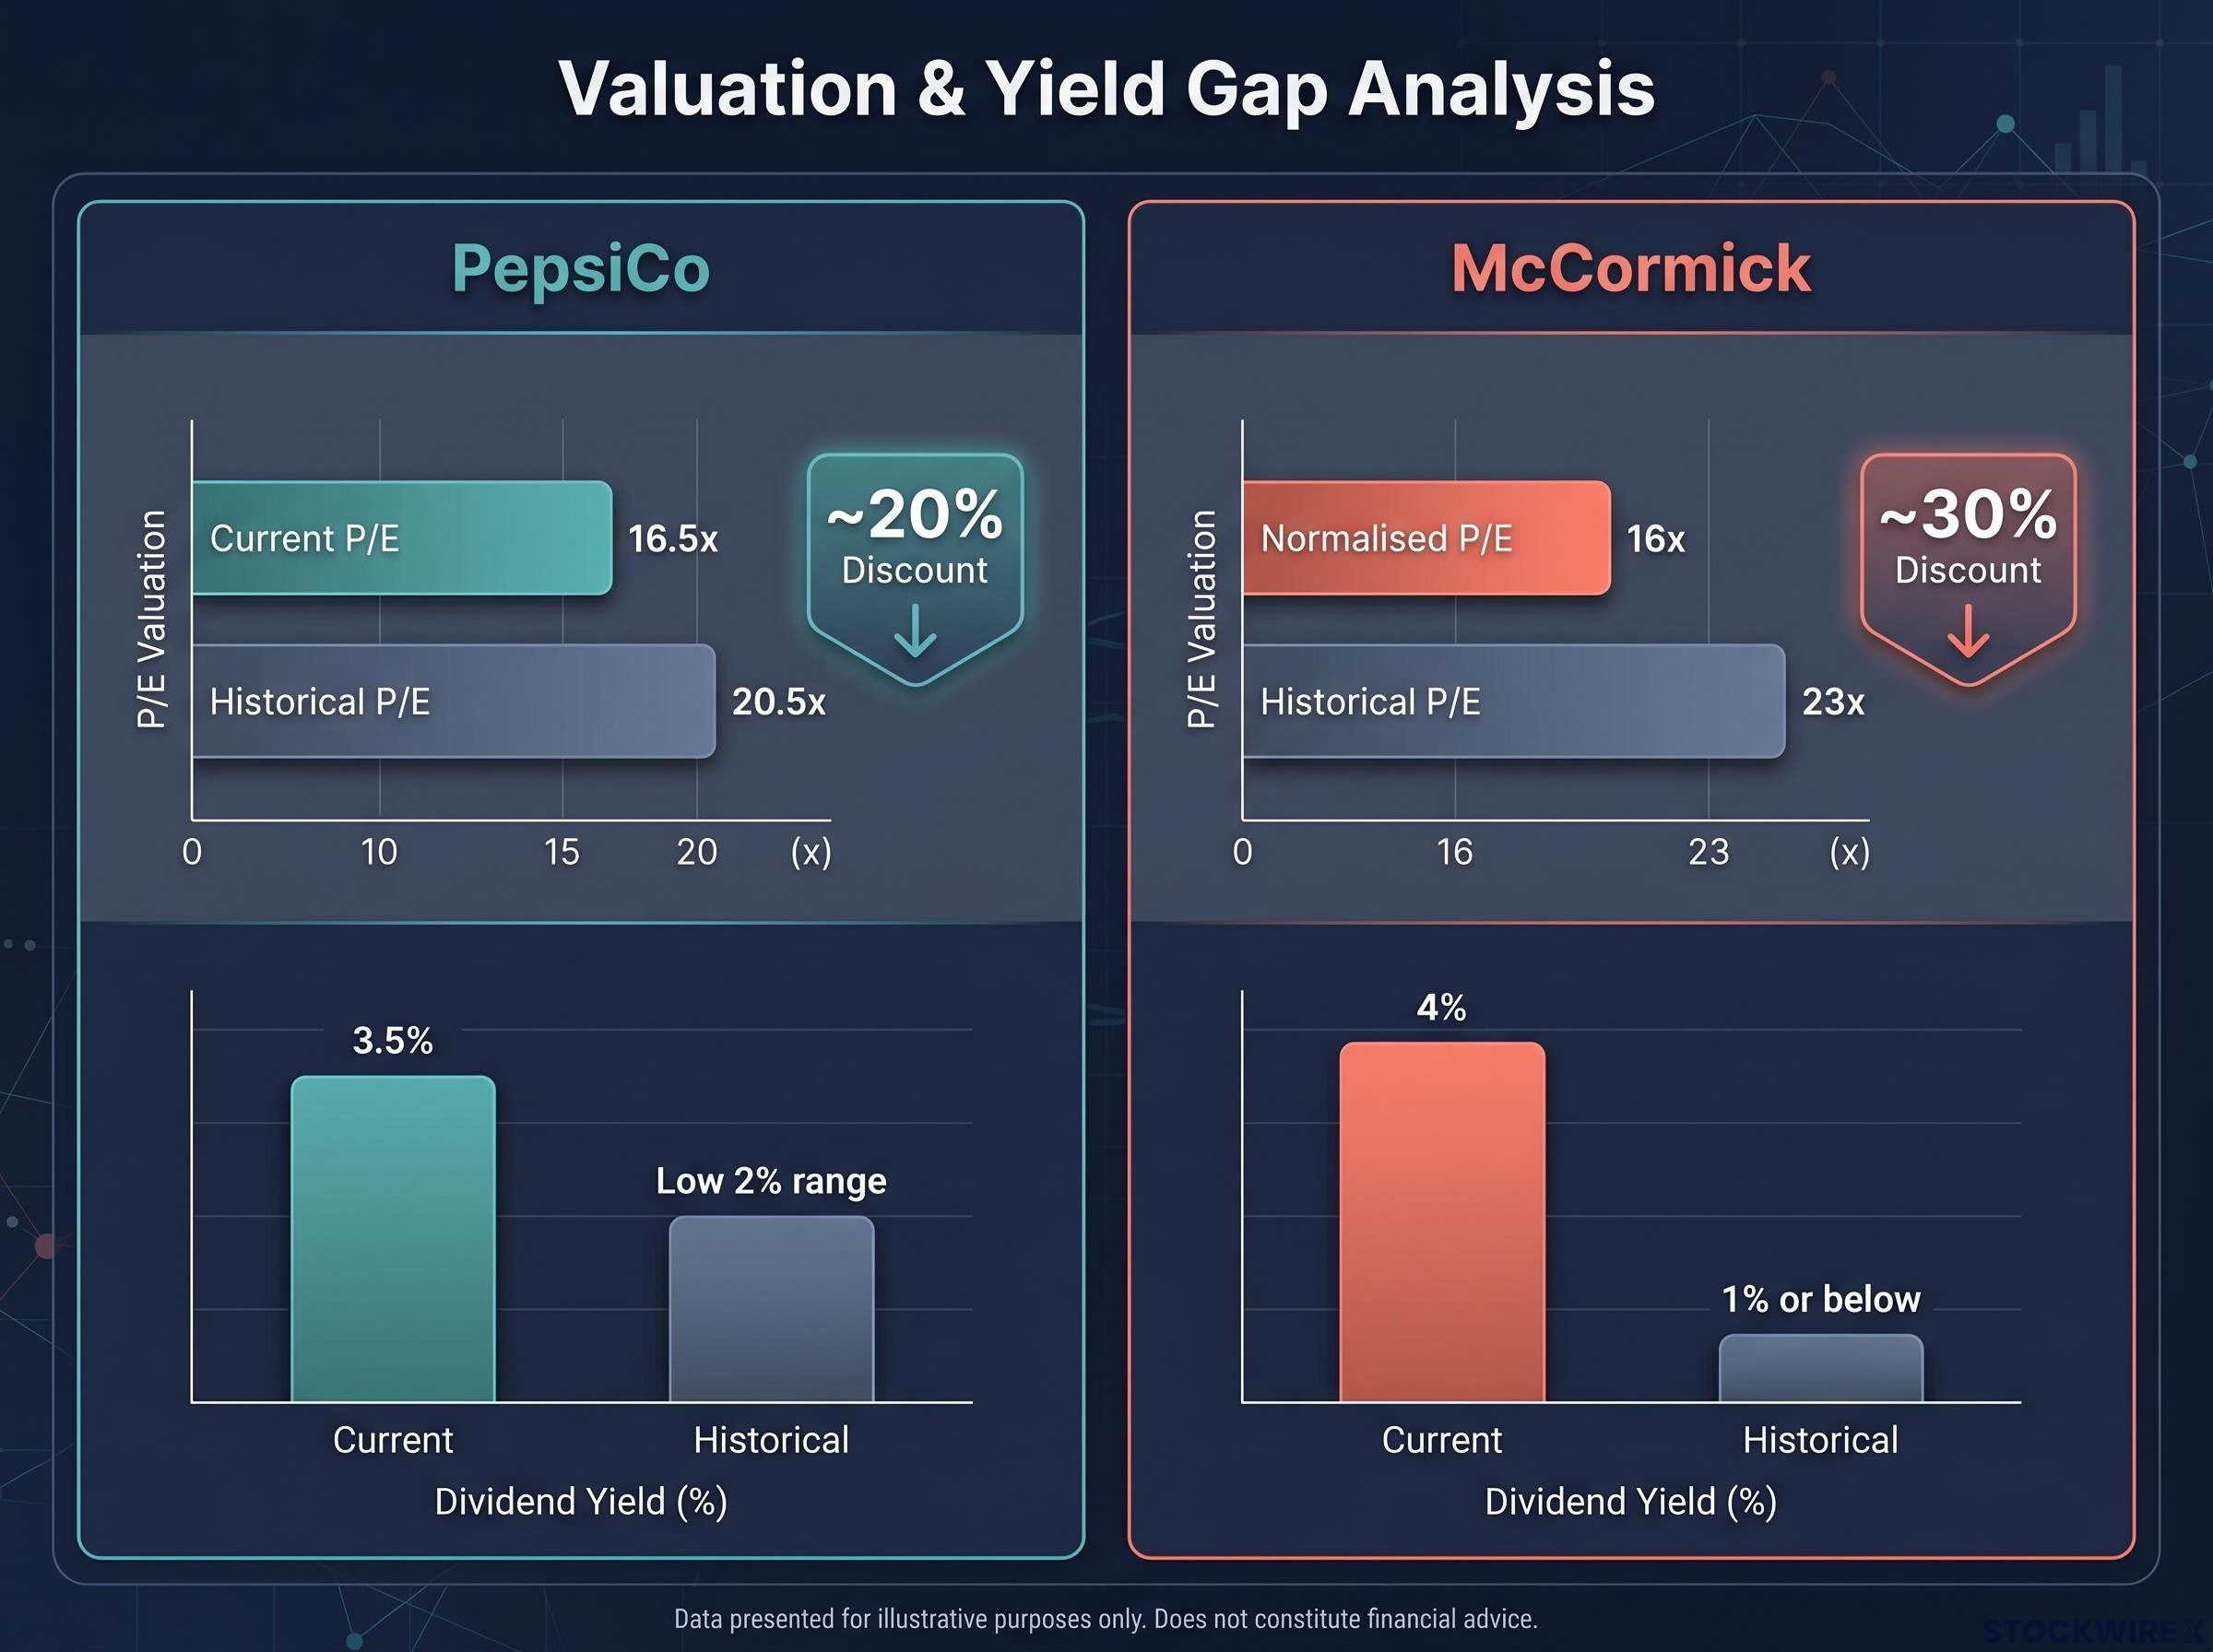
The starting point is the size of the gap itself. According to Fast Graphs data using analyst earnings forecasts, PepsiCo’s blended P/E of approximately 16.5x sits materially below its historical average of roughly 20.5x. That is a discount of nearly 20% to its own norm.
McCormick’s gap is wider, but requires a crucial caveat. The raw trailing P/E of approximately 8.5x is distorted by non-recurring fair-value remeasurement gains from the consolidation of McCormick de Mexico. That figure is not a clean value signal. The normalised P/E, in the mid-teens at roughly 16x, is the correct analytical baseline, and it compares to a historical average of approximately 23x. That represents a discount of roughly 30% to its own historical norm, a valuation last seen somewhere around 2009-2010.
McCormick’s normalised blended P/E of approximately 16x is a valuation level the stock has not traded at since roughly 2009-2010, making this the widest discount to its own history in about 15 years.
The dividend yields tell the same story from the income side. McCormick currently yields approximately 4%, whereas its long-run historical norm has sat at around 1% or under. PepsiCo yields approximately 3.5%. Both figures are elevated precisely because prices have compressed while dividends have continued growing.
Dividend yield signals like the 3.5-4% readings on both stocks are a function of price compression rather than income generation, reflecting that the stock price has fallen relative to a dividend that management has continued raising, and not an indication that the business has become more generous toward shareholders.
| Metric | PepsiCo (PEP) | McCormick (MKC) |
|---|---|---|
| Current blended P/E | ~16.5x | ~16x (normalised) |
| Historical average P/E | ~20.5x | ~23x |
| Discount to historical average | ~20% | ~30% |
| Current dividend yield | ~3.5% | ~4% |
| Historical dividend yield norm | Low 2% range | ~1% or below |
The discount is real and measurable. But the market is rarely this wrong for no reason, and the gap’s existence alone does not constitute an investment thesis. What matters is whether the businesses can justify a return to those historical premiums, and what the arithmetic looks like if they do.
Before the return projections, it helps to understand why these two stocks historically traded at premium multiples in the first place. The answer is tied directly to their dividend classifications.
PepsiCo is a confirmed Dividend King with 54 consecutive years of annual increases. Management committed to returning approximately $8.9 billion to shareholders in 2026 through dividends and buybacks. McCormick qualifies as a Dividend Aristocrat with approximately 39-40 consecutive years of increases, though Dividend King status is not confirmed in available sources.
The distinction between Dividend Kings and Aristocrats matters more than the labels suggest: as of mid-2026, 69 companies hold Aristocrat status while only 56-58 hold King status, with the smaller Kings count reflecting the severity of sustaining an unbroken payout streak for 50 or more years against any economic cycle the past five decades produced.
These classifications matter to the return thesis because they are precisely what has historically justified premium multiples. A five-decade streak signals earnings durability, management discipline, and capital allocation consistency that investors have been willing to pay up for. Any reversion toward historical multiples depends on investors continuing to assign that premium to demonstrated dividend discipline. If the market stops valuing the streak, because growth has slowed or payout ratios have stretched too far, the mean-reversion case weakens regardless of the arithmetic.
The projected return breaks into three components, each contributing independently to the total.
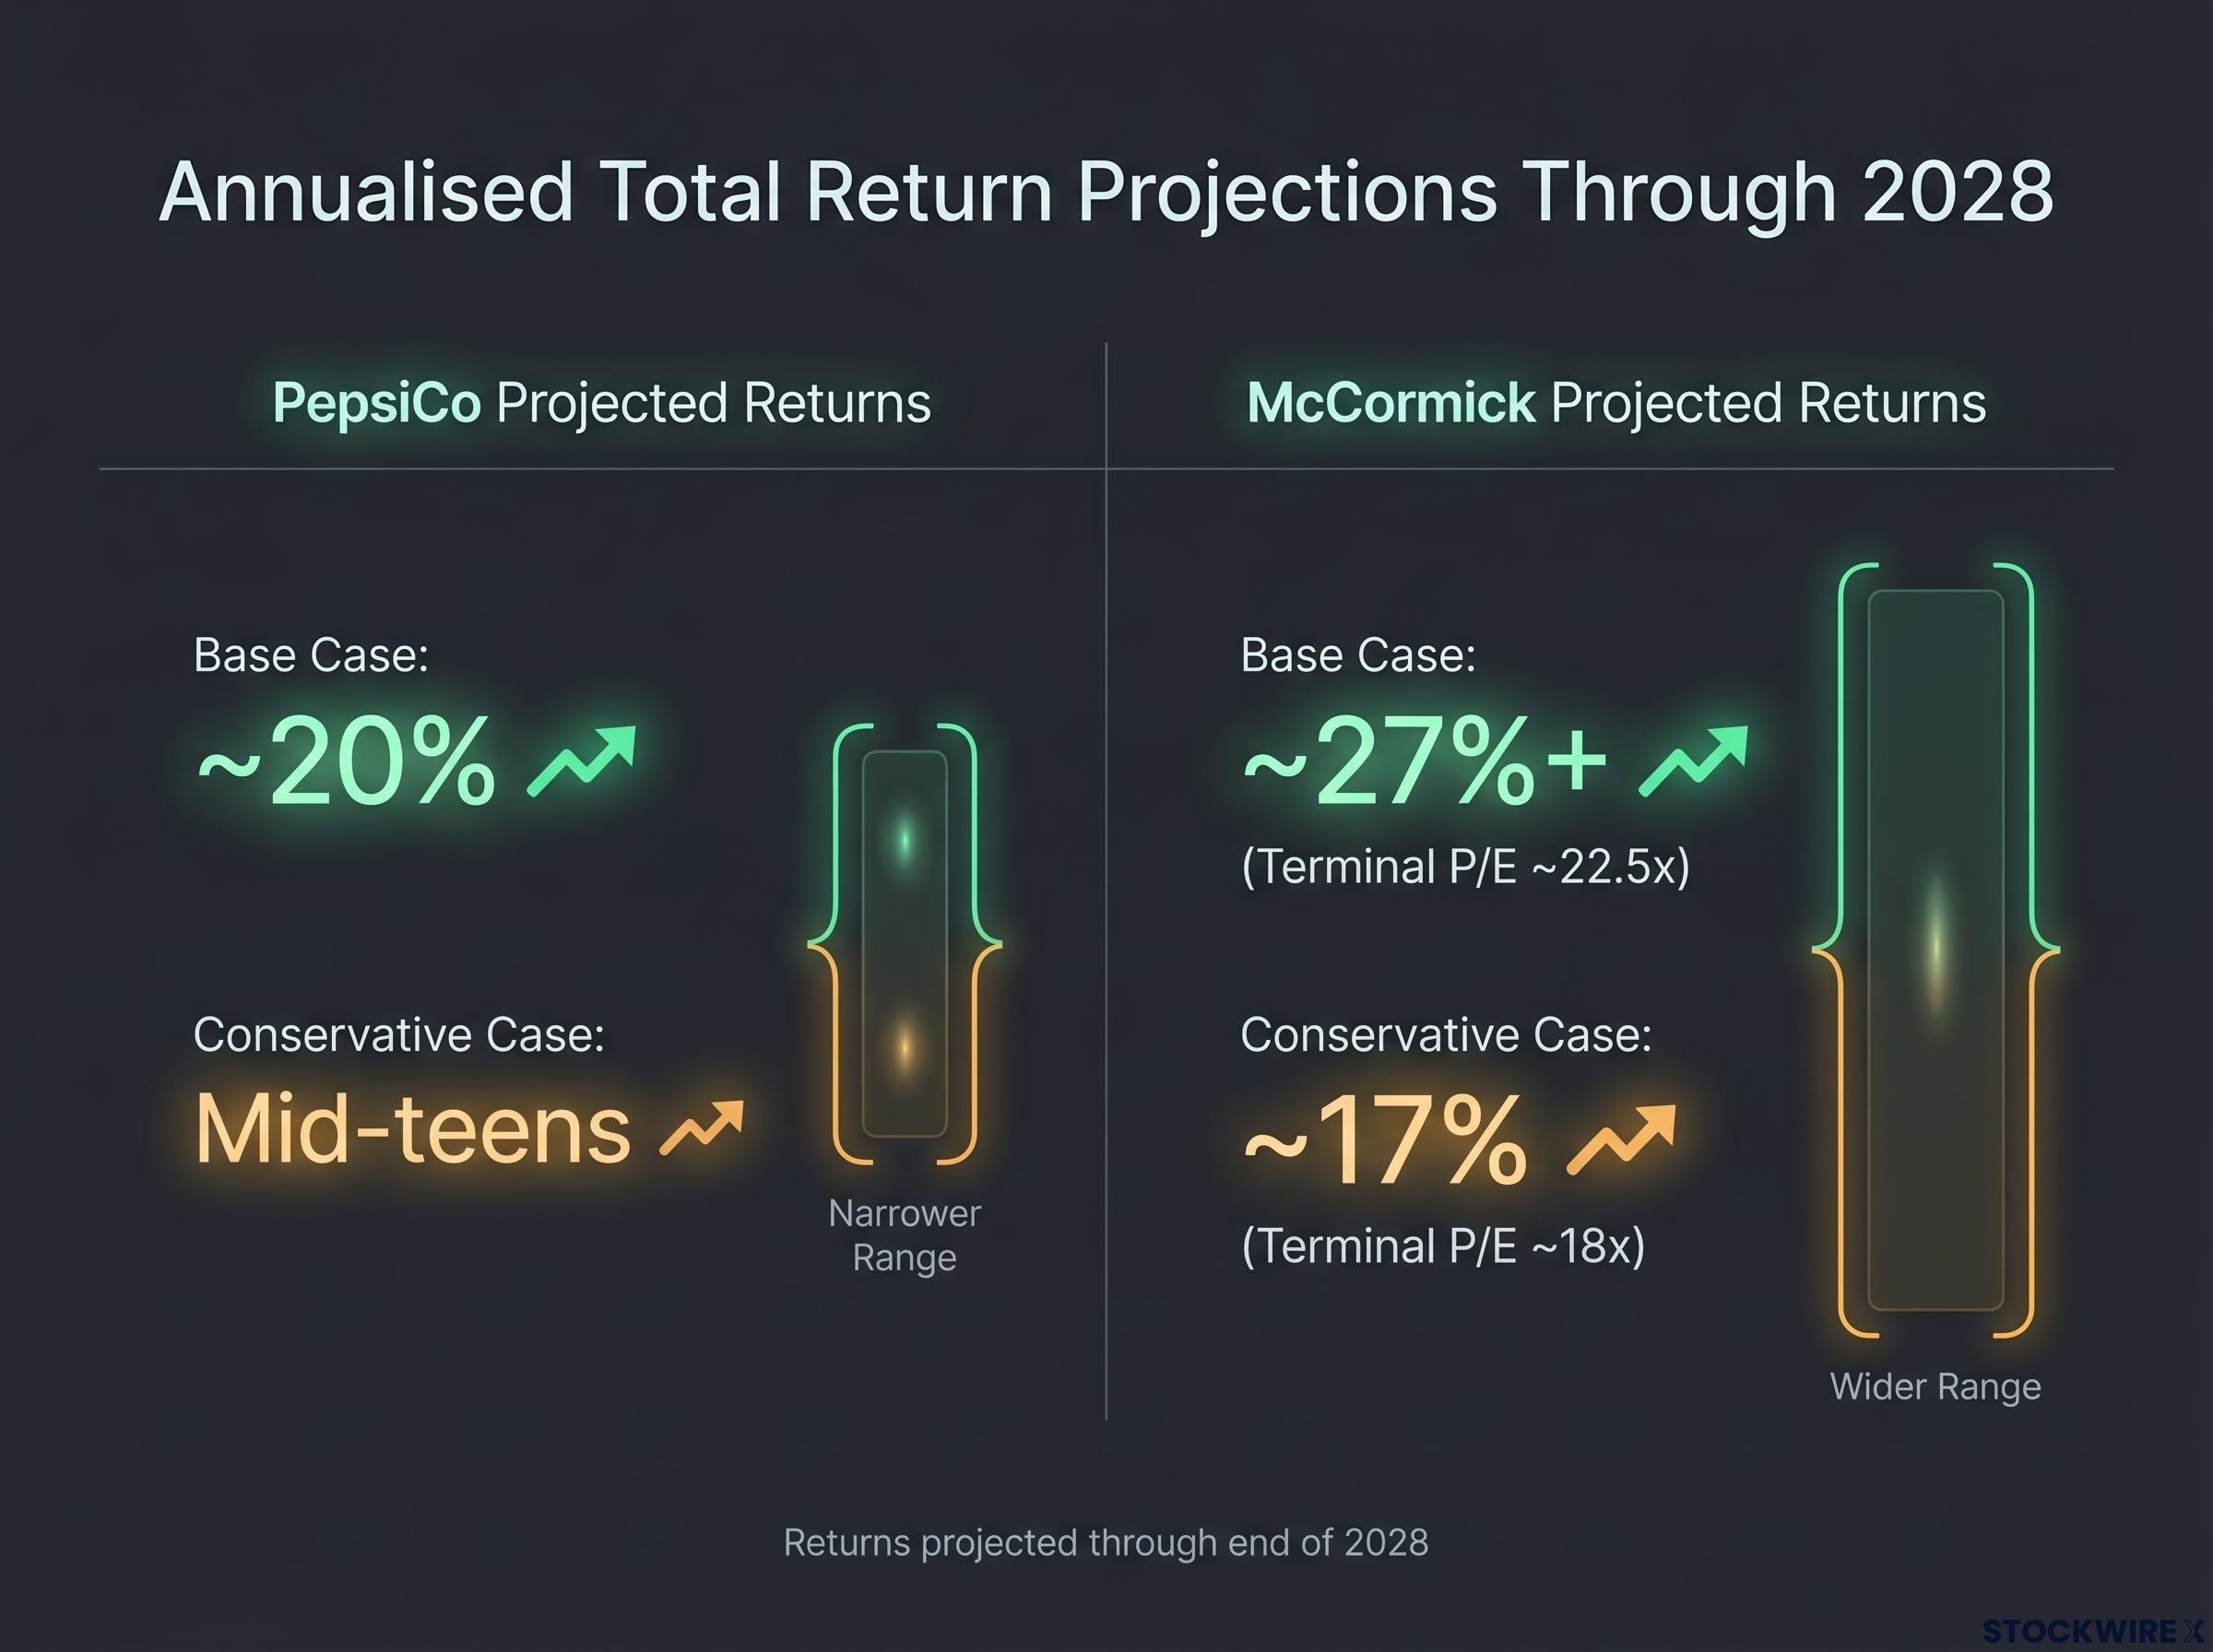
On a combined basis, the base-case scenario points to annualised share price appreciation of approximately 15.5%, with dividends included pushing annualised total returns to approximately 20% through the end of 2028.
Base-case annualised total return for PepsiCo through 2028: approximately 20%, assuming partial reversion to historical multiples and continued mid-single-digit earnings growth.
That figure is ambitious. It requires the market to rerate PepsiCo back toward its historical premium, and Q1 2026 organic revenue growth of just 2.6% (of the 8.5% headline figure, with the remainder from FX and acquisitions) raises a fair question about whether the underlying growth trajectory justifies a low-20s multiple.
A useful comparison: purchasing PepsiCo in 2022 at around 27x earnings, well above that long-run average of roughly 20x, left investors with very little room for valuation-driven upside. The current discount is the mirror image of that overvaluation, and the arithmetic of mean reversion works in both directions.
The implied growth rate embedded in a P/E multiple is what the market is demanding the business deliver to justify its current price, and at 16.5x for PepsiCo, the market is pricing in a meaningful deceleration from the mid-to-high single-digit growth rates that historically supported a 20x-plus multiple.
The same three-component framework applies to McCormick, but the numbers are more aggressive and the variables more numerous.
Expanding from approximately 16x to roughly 22.5x would represent valuation uplift of around 40%. Layering in high-single-digit annual EPS growth (roughly 25-30% cumulative), the base case arrives at annualised share price appreciation of just over 23%, with total annualised returns, including dividends, clearing 27% through to end-2028.
The conservative scenario is equally important. Should the market settle at only approximately 18x rather than restoring anything close to the full historical premium, the annualised total return picture moderates to around 17%. The spread between the 17% conservative case and the 27% base case is itself a measure of the uncertainty embedded in the thesis.
| Scenario | Assumed terminal P/E | Annualised price appreciation | Annualised total return |
|---|---|---|---|
| Base case | ~22.5x | ~23% | ~27%+ |
| Conservative case | ~18x | Low teens | ~17% |
Even in the conservative scenario, where the market never fully restores McCormick’s historical premium, the projected annualised total return of approximately 17% represents a meaningfully positive outcome for a consumer staples holding.
McCormick has guided for fiscal 2026 net sales growth of 13-17%, though 11-13 percentage points of that figure comes from the Mexico acquisition consolidation. The payout ratio has climbed into the 60s percentage range, up from a historical norm that sat in the 40s, and dividend growth that has run at around 8-9% per year is widely expected to slow toward approximately 5% in the coming years. The presenter behind the original analysis disclosed a position in cash-secured puts on McCormick, reflecting a willingness to be assigned shares at current price levels.
The uncomfortable possibility is that both stocks are cheap for legitimate reasons, not purely because of irrational market pessimism. A scenario in which neither company closes its valuation gap by 2028 is not implausible. Identifying the specific conditions under which that happens is how you decide whether the current prices represent risk worth accepting.
This article is for informational purposes only and should not be considered financial advice. Investors should conduct their own research and consult with financial professionals before making investment decisions. Past performance does not guarantee future results. Financial projections are subject to market conditions and various risk factors.
The two stocks present meaningfully different risk-reward propositions, not interchangeable options in the same category.
PepsiCo offers the more legible thesis. The business is simpler, the earnings stream cleaner, and the return projection, while still ambitious at approximately 20% annualised in the base case (mid-teens in a conservative scenario), rests on fewer conditional variables. The $8.9 billion shareholder return commitment in 2026 provides tangible near-term capital return visibility.
McCormick offers a higher projected return, exceeding 27% annualised in the base case, but with a wider scenario range down to approximately 17% in the conservative case. The Unilever Foods integration, accounting normalisation requirements, and elevated payout ratio all introduce variables that investors must be comfortable holding through.
| Metric | PepsiCo (PEP) | McCormick (MKC) |
|---|---|---|
| Base-case annualised total return | ~20% | ~27%+ |
| Conservative-case annualised total return | Mid-teens | ~17% |
| Primary risk variable | Payout ratio; organic growth | Integration; accounting complexity |
| Dividend streak classification | Dividend King (54 years) | Dividend Aristocrat (~39-40 years) |
The position-sizing implication is direct. The wider McCormick scenario range suggests that investors who want exposure to both might weight PepsiCo more heavily if capital preservation is the priority, and McCormick more heavily if they have high conviction in the integration outcome. The valuation gap is real as of mid-2026, but mean reversion is not guaranteed or imminent. The comparison between these two stocks is ultimately a question about how much execution uncertainty you are willing to underwrite in exchange for a higher projected return, and the numbers make that trade-off legible without mandating a single answer.
For readers who want to examine whether the dividend-streak framing itself is the right lens for evaluating PepsiCo and McCormick, our dedicated guide to total return versus dividend investing compares a decade of backtested performance data and a lifecycle framework that shows which approach builds more wealth at each portfolio stage.
—
Undervalued dividend kings are companies with 50 or more consecutive years of annual dividend increases whose current share price implies a P/E multiple materially below their historical norm. PepsiCo, for example, trades at roughly 16.5x earnings against a long-run average of about 20.5x, a discount the market has assigned partly because organic growth has slowed and payout ratios have climbed above historical ranges.
A Dividend King has raised its dividend for 50 or more consecutive years with no index membership required, while a Dividend Aristocrat must be an S&P 500 member with at least 25 consecutive years of increases. As of mid-2026, only 56-58 companies hold King status compared to 69 Aristocrats, reflecting how difficult it is to sustain an unbroken streak across five decades of economic cycles.
The base case projects approximately 20% annualised total return for PepsiCo through 2028, combining roughly 8-9% annualised valuation uplift from P/E expansion toward 21x, mid-to-high single-digit EPS growth, and the current 3.5% dividend yield. A conservative scenario that assumes less multiple expansion points to mid-teens annualised returns.
The 8.5x figure is distorted by non-recurring fair-value remeasurement gains from the consolidation of McCormick de Mexico. The normalised blended P/E of approximately 16x is the analytically meaningful baseline, and it is that figure which sits roughly 30% below McCormick's historical average of around 23x.
For PepsiCo, the key risks are an elevated payout ratio (estimated between 70% and 89%) and organic revenue growth of only 2.6% in Q1 2026, which may not justify a return to premium multiples. For McCormick, the Unilever Foods integration announced in March 2026 introduces execution and synergy risk, while accounting complexity from the Mexico consolidation makes it harder for the market to assign a confident forward multiple.