One in three Australian households now carries an active mortgage. More Australians owe money on their home than own it outright.
That inversion, confirmed by the 2021 census, would have been unthinkable a generation ago. The traditional retirement plan in this country was built on one financial foundation above all others: a home paid off in full by the time the pay cheques stop.
That foundation is eroding. Census figures and generational survey work from Vanguard (2026) show nearly half of Gen Z Australians already expect to reach retirement while still repaying a loan. Retiring with a mortgage in Australia is no longer a niche planning problem. It is becoming the default.
Here is what the numbers actually show about the retirement cost of a mortgage you have not yet paid off: what it takes from your annual income, what the superannuation trade-off really involves, and which three variables should decide your own approach.
How Australia lost its outright ownership majority
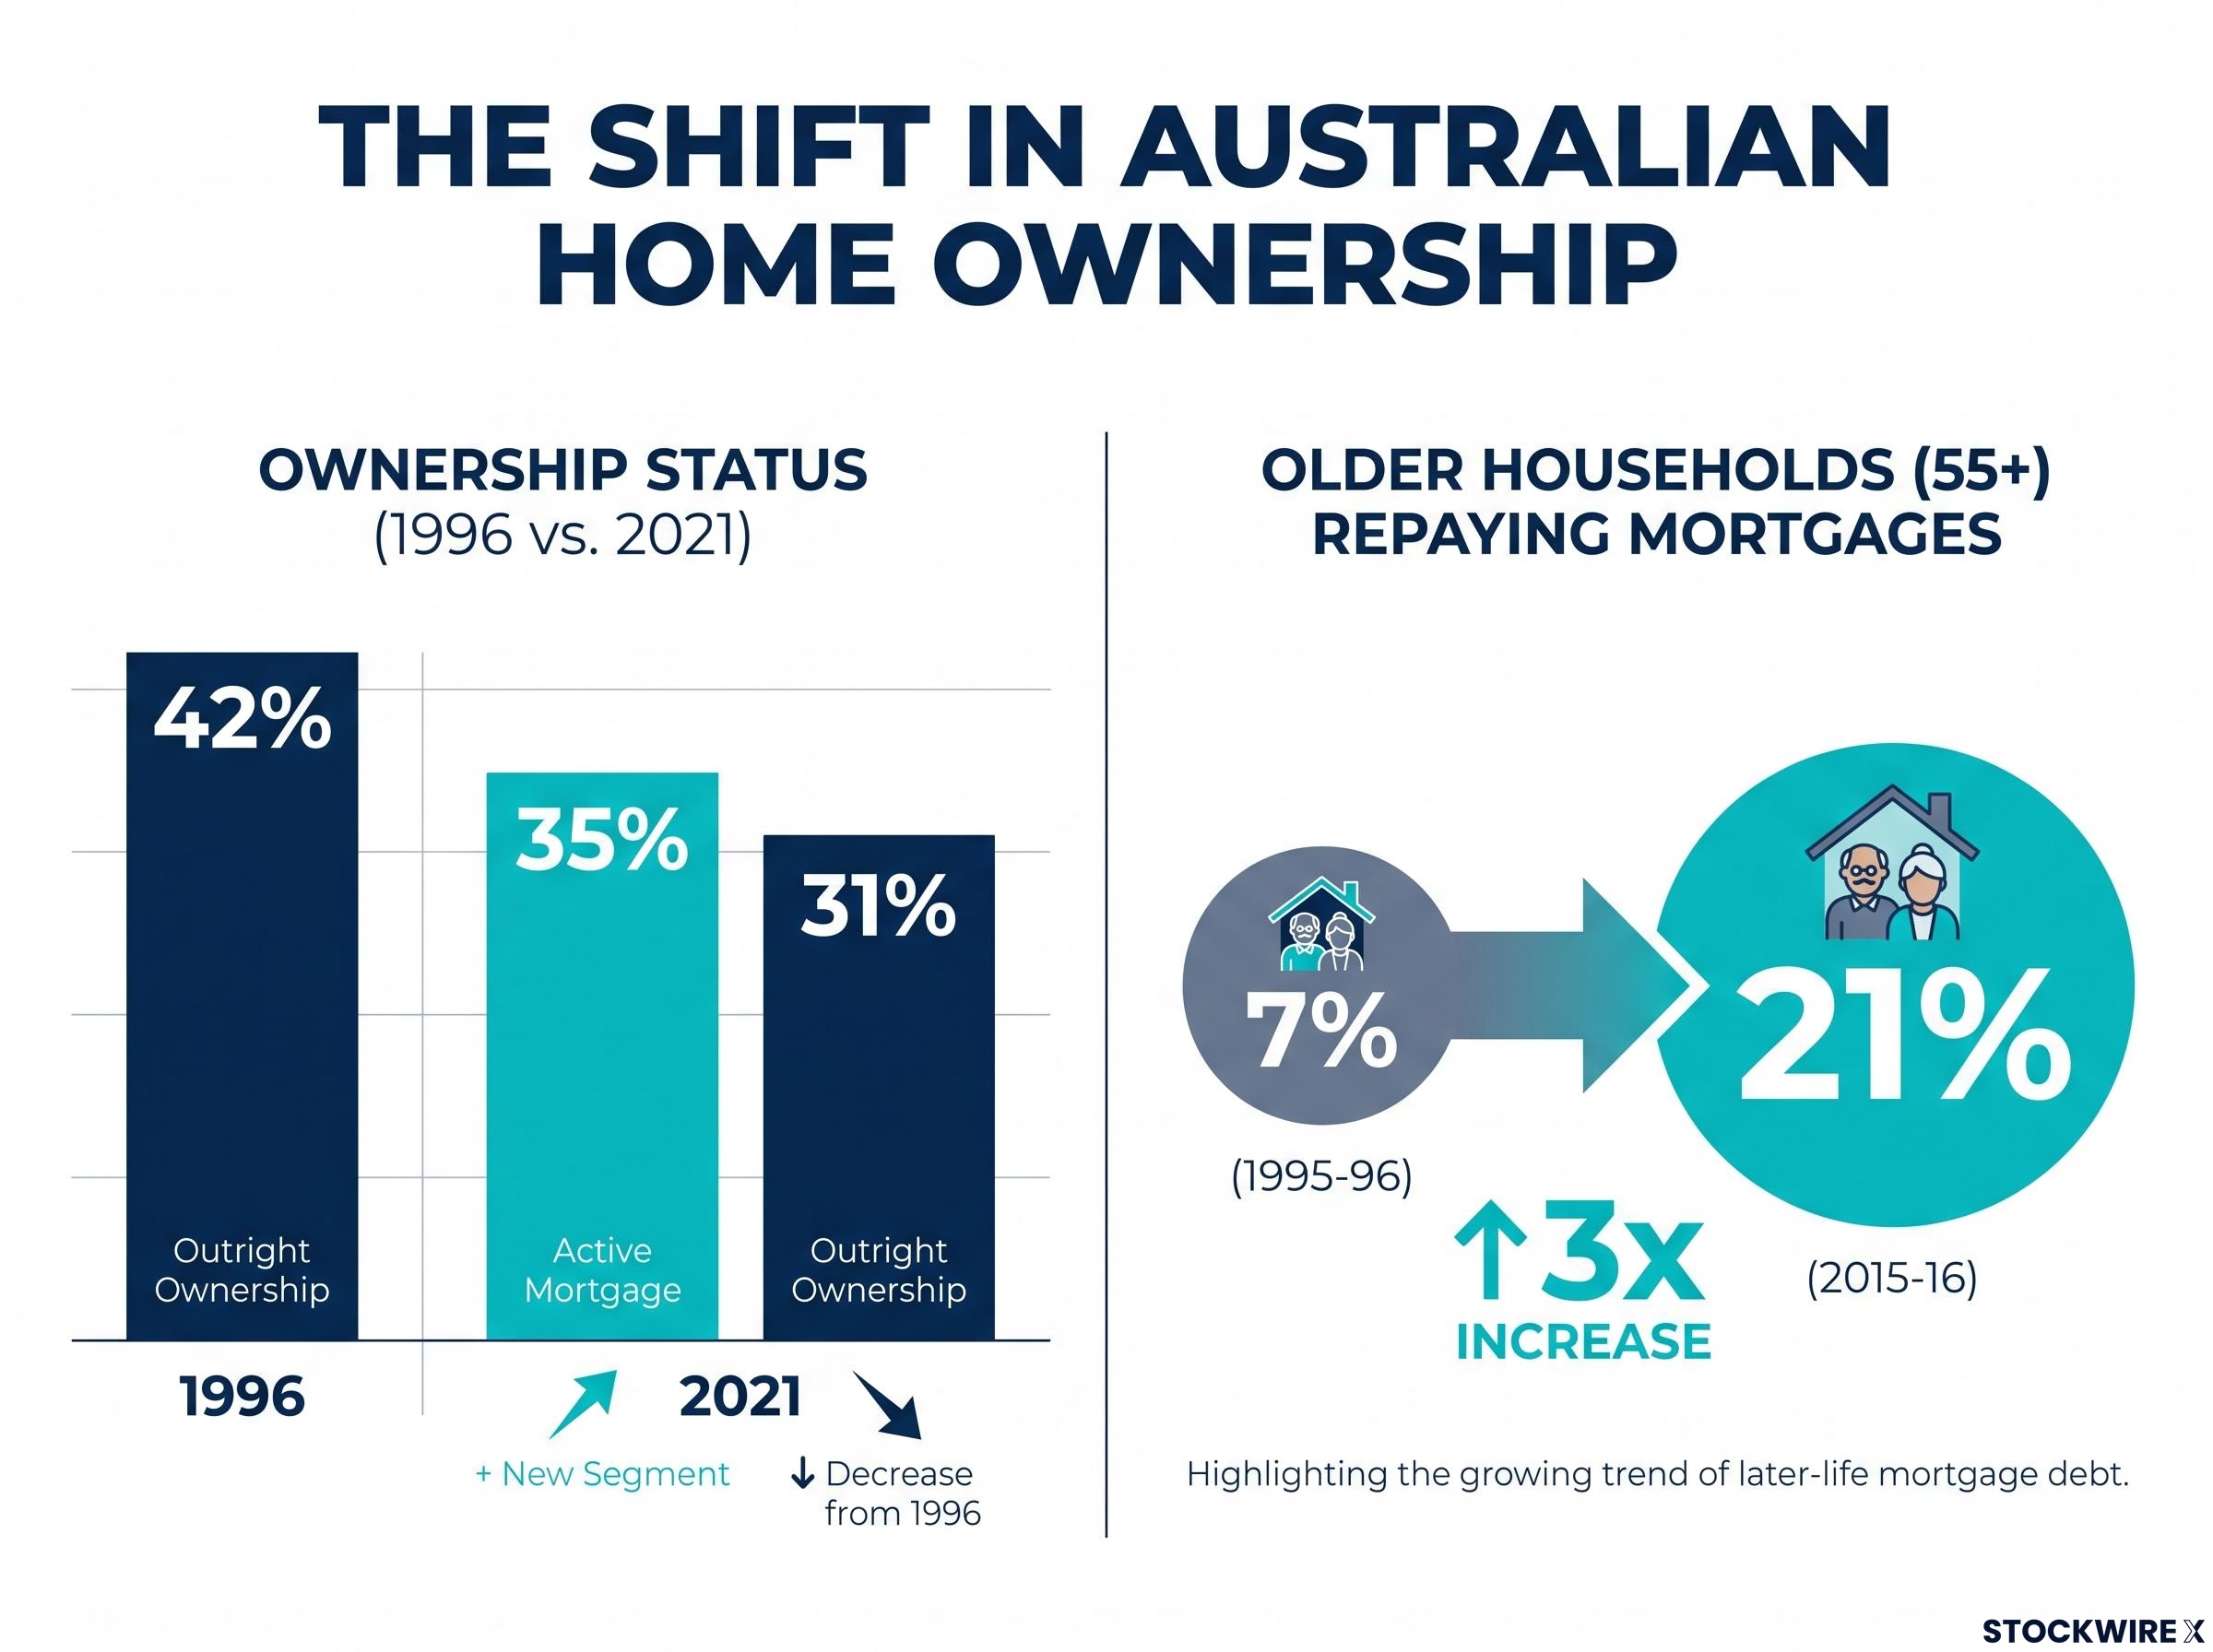
Start with the moment the balance tipped. As of the 2021 census, 35% of all Australian households were carrying an active mortgage, against just 31% who owned their home debt-free. The mortgaged majority has arrived.
The ABS 2021 Census housing data confirms the crossover directly, recording 35% of Australian households carrying an active mortgage against 31% in outright ownership, the first time mortgaged households have outnumbered debt-free owners in the modern census series.
That crossover did not happen overnight. Outright ownership across all households sat at 42% in 1996. Over the following 25 years it fell to 31%, a contraction of more than a quarter of the outright-owning base.
The shift hits older Australians hardest, and that is where the assumption behind retirement planning starts to crack. Among households led by someone aged 55 or over, the share still making repayments tripled between 1995-96 and 2015-16, climbing from 7% to 21%.
The pre-retirement cohort tells the same story more sharply. Between 1996 and 2013, the proportion of Australians aged 55 to 64 still repaying a mortgage grew from under 20% to 45%. Nearly half of people in the decade before retirement age were still servicing home debt.
| Measure | 1996 | 2021 |
|---|---|---|
| Outright ownership (all households) | 42% | 31% |
| Active mortgage (all households) | Below outright | 35% |
| Older households (55+) still repaying | 7% (1995-96) | 21% (2015-16) |
The scale of the debt behind these percentages is the part that lands hardest.
The size of the shift in one number Mortgage debt held by Australians aged 55 and over rose roughly 600% in real terms between 1987 and 2015, from around $27,000 to more than $185,000.
Read together, these figures carry a clear message. The tripling of mortgage-holding among older Australians is not a quirk of one generation passing through. It signals that outright ownership can no longer be treated as a given planning input for anyone now in their forties or fifties. If you assumed your home would be clear by the time you retired, the data is telling you to check that assumption rather than inherit it.
When big ASX news breaks, our subscribers know first
Three forces pushing the mortgage finish line into retirement
The retirement mortgage problem is not one bad decision. It is three structural forces compounding on each other, and they interact in a way that quietly extends the finish line well past the point where income stops.
- Later entry into the market. Buyers aged over 40 made up nearly 19% of first home buyers in the most recent year reported, up from roughly 5% in 2005. The average first home buyer is now estimated at 33 to 37 years of age.
- Larger loans. The average new owner-occupier loan reached approximately $735,000 in the March quarter 2026, according to ABS Lending Indicators. Bigger balances take longer to clear at any given rate.
- Term resets on refinancing. Refinancing frequently restarts the clock at a fresh 30-year term. A borrower who refinances at 45 into a new 30-year loan is committed to repayments until age 75.
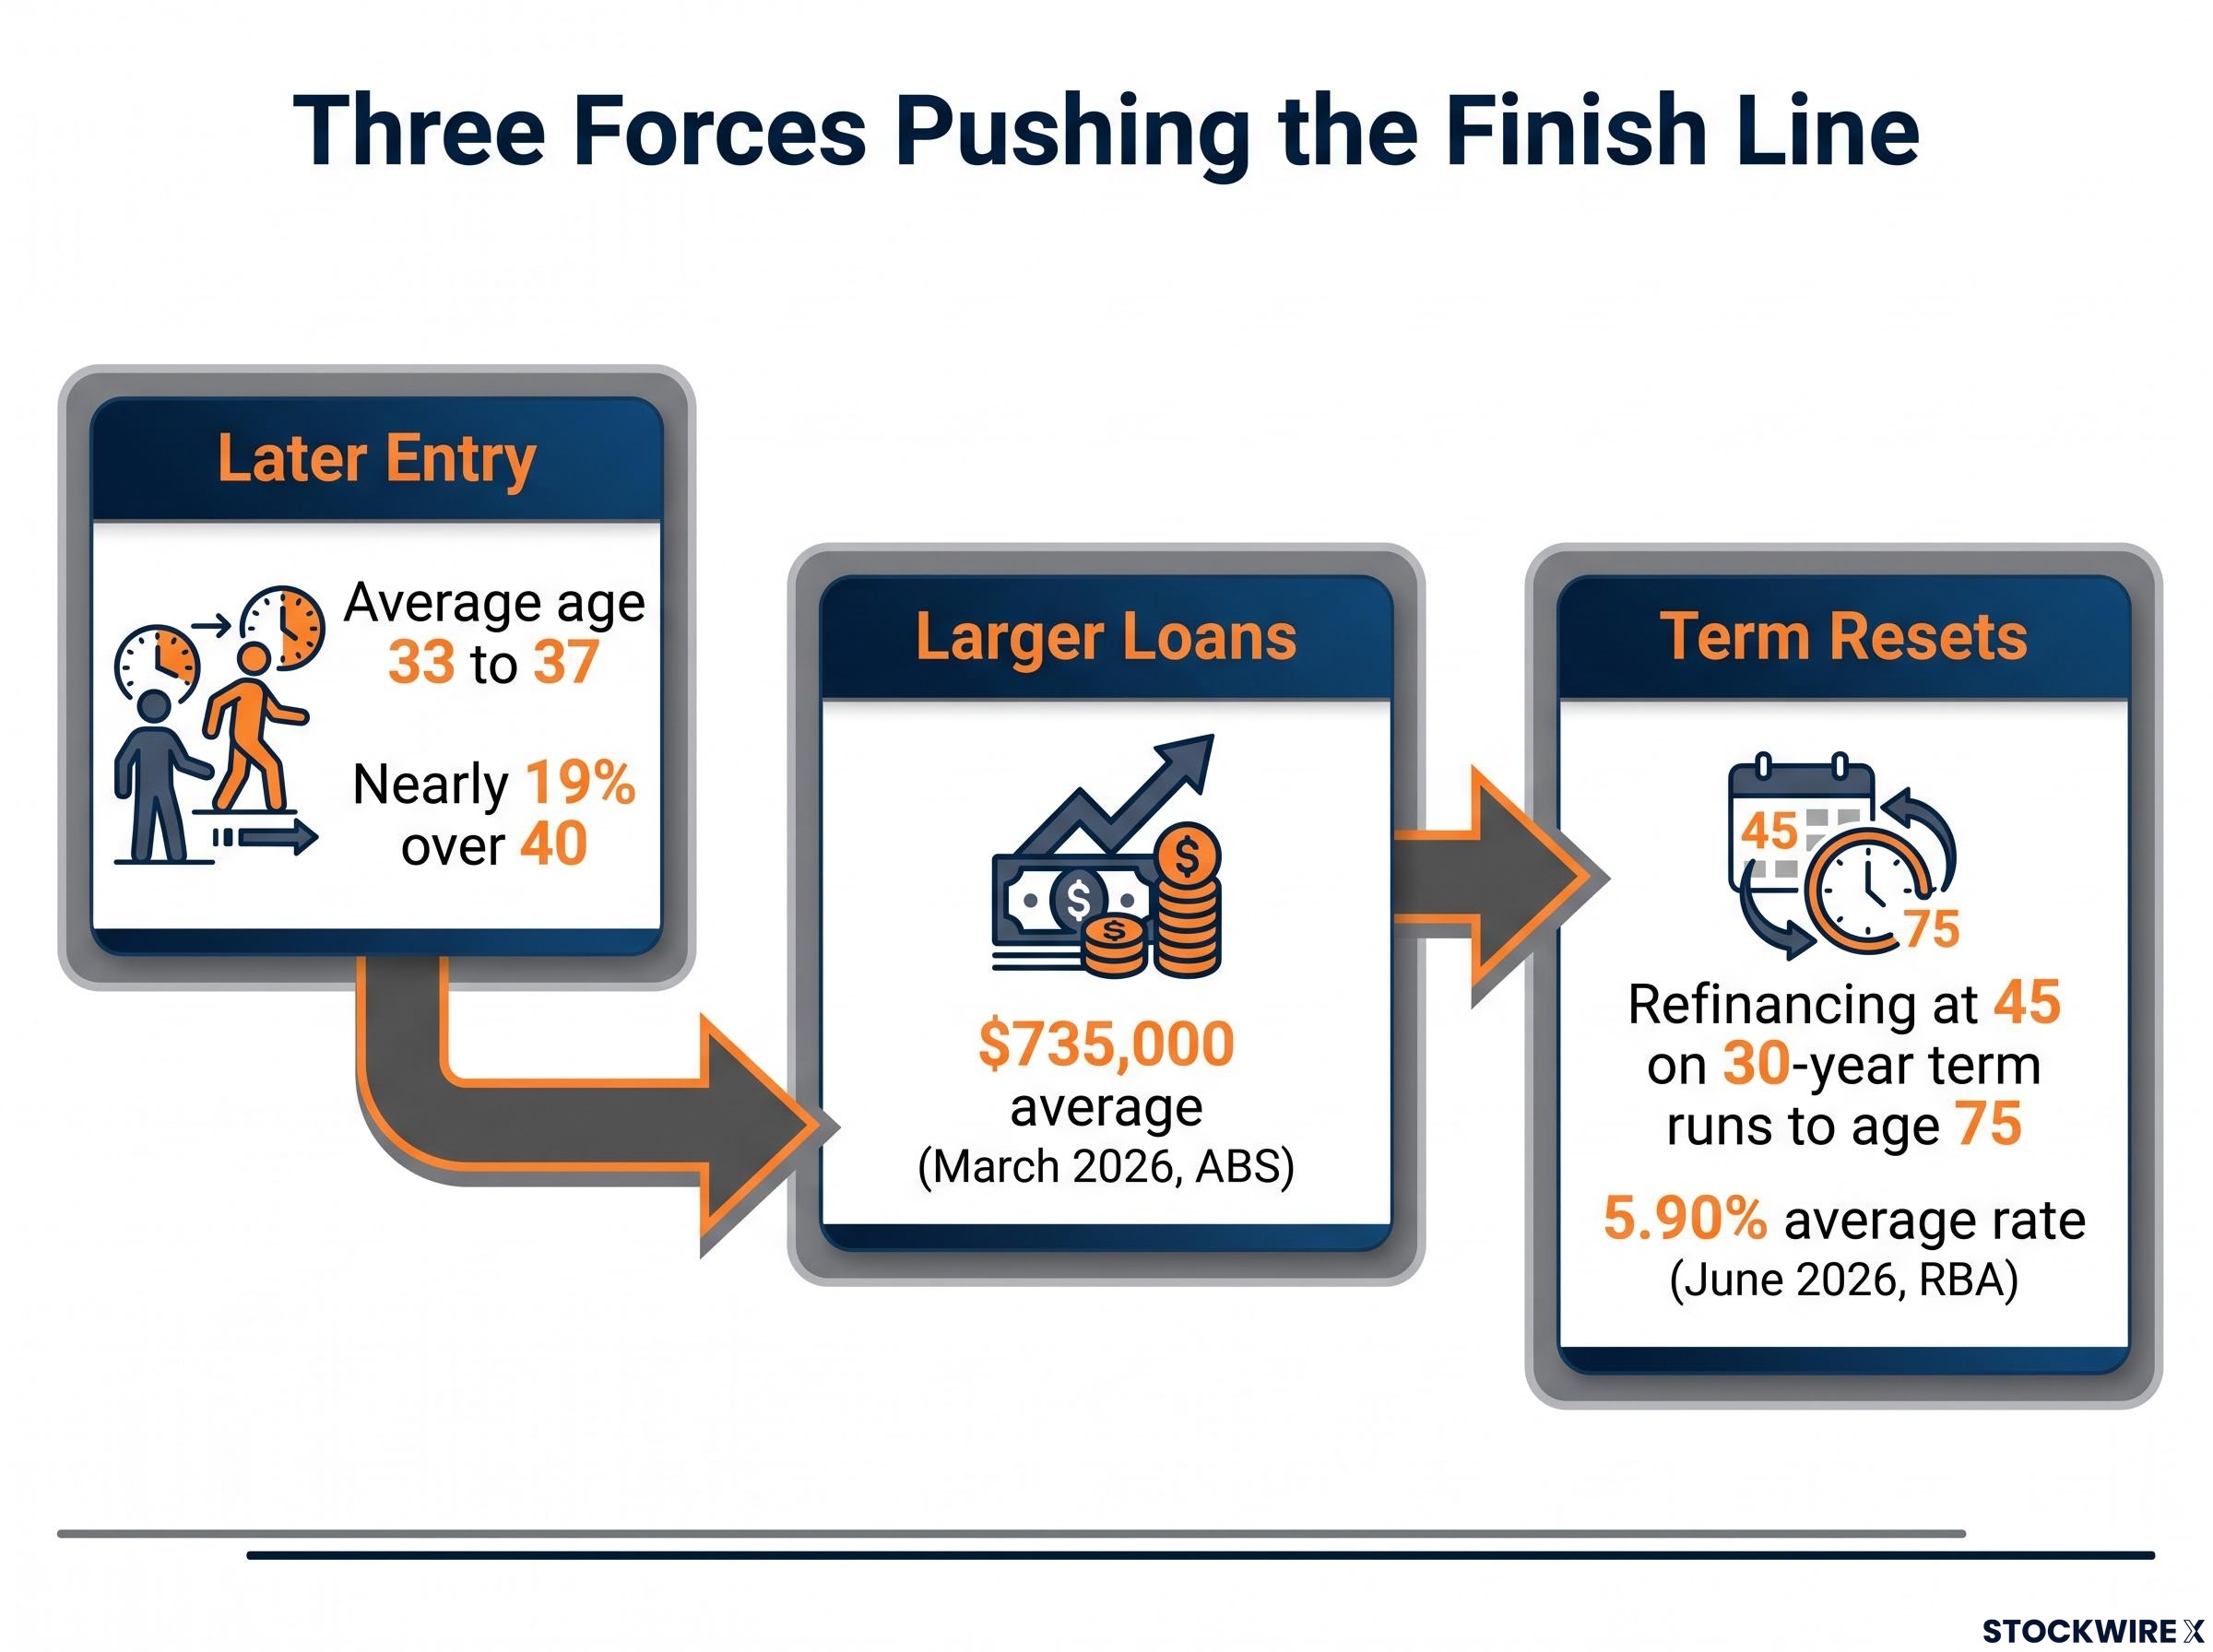
Follow the compounding logic through a single borrower. Enter the market at 37, take a $735,000 loan, then refinance at 45 into a new 30-year term, and the repayment schedule now runs to age 75. None of those three moves is unusual. Together they push the debt a decade past where a previous generation would have finished.
Even without refinancing, the arithmetic is unforgiving. A standard 30-year mortgage started at age 40 concludes at 70, three years beyond Age Pension eligibility. With the average variable owner-occupier rate around 5.90% per annum as of June 2026 per RBA data, and some lenders now offering 40-year terms, the pressure on the timeline is structural rather than personal.
The same forces that eroded outright ownership rates are also reshaping property’s role in long-run wealth building: KPMG analysis confirms that structural property tailwinds have reversed, with the median home now costing nine to ten times average income and the falling interest rate driver that powered earlier generational gains now exhausted.
There is a behavioural layer too, and it deserves to be stated without judgement. Mortgage equity withdrawal, interest-only periods and redraw use among older borrowers have all stretched timelines further, often triggered by adverse life events such as job loss or relationship breakdown rather than by strategic choice.
If you bought your first home at 36 and have refinanced once, the maths of reaching retirement debt-free is already tighter than a quick mental calculation suggests. The value of separating these three forces is that it tells you which one is driving your own position, and that is where any realistic plan has to start.
What lenders now require from older borrowers
The regulator has already noticed the trend, and it now shapes what older applicants can borrow. Under ASIC’s responsible lending guidance and APRA’s Prudential Practice Guide APG 223, lenders must scrutinise how a loan will be serviced once employment income ends. This is the “exit strategy” requirement.
APRA’s APG 223 residential mortgage lending guide sets out the prudential expectations lenders must meet when assessing loan serviceability, including specific scrutiny of how repayments will continue once employment income ceases, which is the regulatory basis for exit strategy requirements that older borrowers now routinely encounter.
Acceptable strategies are specific: a documented downsizing plan with expected sale proceeds, selling an investment property, or drawing on superannuation. Vague intentions to simply keep working longer are explicitly treated as insufficient.
Consumer advocates raise an important caveat. These rules stop lenders writing loans that cannot be serviced, but they do not guarantee that your retirement income will be adequate afterwards, particularly where superannuation is the planned exit vehicle. Passing the lender’s test is not the same as passing your own.
What a mortgage in retirement actually costs, in dollars
Here is the figure that reframes the entire question. Grattan Institute research puts the value of outright homeownership at more than $23,000 a year to the average Australian household aged 65 and over. That is the imputed rent you effectively pay yourself by not owing anyone, and it equals nearly 70% of the full single Age Pension.
The housing cost gap behind that number is stark. Retirees who own outright spend around 5% of their income on housing. Renters and mortgaged retirees spend 25% to 30%. A mortgage does not just remove a lump sum from your balance sheet; it eats a quarter of your income every year it survives.
To see what that does to living standards, set it against the retirement benchmarks. The Association of Superannuation Funds of Australia (ASFA) publishes the widely used standard for what different lifestyles cost, and its figures assume a homeowner with no mortgage payments.
| Household type | Lifestyle standard | Annual income required | Super lump sum at 67 |
|---|---|---|---|
| Couple (homeowner) | Comfortable | $77,375 | $730,000 |
| Single (homeowner) | Comfortable | $54,840 | $630,000 |
| Single (homeowner) | Modest | $35,503 | $110,000 |
| Single (renter) | Modest | $50,055 | $340,000 |
Figures are ASFA December 2025 quarter, released February 2026.
The renting comparison is the cleanest proxy for what carrying housing costs into retirement actually does. A modest lifestyle for a single renter needs $50,055 a year, against $35,503 for a single homeowner. That is a gap of $14,552 every year, and it maps directionally to the burden a mortgaged retiree faces.
The anchor figure Outright homeownership is worth more than $23,000 a year to the average household aged 65 and over, equivalent to nearly 70% of the full single Age Pension. Source: Grattan Institute.
The point is not academic. That income gap is large enough to decide whether you land in a comfortable or merely modest retirement under Australia’s own benchmarks. If you are in your forties or fifties and have not modelled your position against these numbers, you are almost certainly underestimating what your remaining mortgage will cost your retirement income.
The average Australian aged 50-54 holds approximately $198,400 in superannuation, a figure that sits more than $430,000 below the ASFA comfortable retirement threshold, and superannuation balance benchmarks by age show that the compounding gap widens sharply for every year contributions are redirected to mortgage servicing instead.
The income divide hidden inside the mortgage statistics
The burden does not fall evenly, and the Finder data makes that plain. Finder’s 2026 Home Loan Report found 76% of borrowers earning above $200,000 a year expect to be mortgage-free before retirement, against only 25% of those earning below $50,000.
That split matters because lower-income borrowers also tend to hold smaller superannuation balances and have fewer levers to pull. The retirement mortgage problem concentrates precisely where the financial cushion is thinnest.
Younger Australians are already building their plans around this reality. Vanguard’s 2026 research found 48% of Gen Z and 37% of millennials expect to retire with mortgage debt, and 39% intend to use a superannuation lump sum to clear the balance. These cohorts are not planning around the problem. They are planning for it.
Using superannuation to clear the debt: the trade-offs that determine whether it makes sense
For most mortgaged Australians approaching retirement, this is the decision that matters. Should you empty part of your super to kill the loan? The honest answer is that it depends, and the reasons it depends are worth understanding before anyone reaches for a lump sum.
There are two legitimate arguments, pulling in opposite directions. Clearing the mortgage removes non-deductible debt, cuts your monthly outgoings, and can move your assessable assets below the Age Pension threshold. Retaining super keeps a tax-advantaged, compounding pool intact, which may outperform your mortgage rate over a long enough horizon.
Super return assumptions built on the last decade’s 7.8%-8.1% balanced fund performance embed a structural bias: those returns were driven by a one-off disinflation tailwind that regulators including APRA, the RBA, and Treasury have explicitly warned cannot be extrapolated forward, which makes the investment-versus-mortgage-rate comparison more uncertain than a headline number suggests.
The Age Pension mechanics are where this gets counterintuitive. The family home is exempt from the assets test, while most superannuation is assessable once you reach pension age. Paying down a mortgage with super can therefore shift your balance below the pension cut-off and unlock eligibility.
The reverse trap is just as real. Holding the same money as cash or in an offset account keeps it assessable, which can actively reduce your pension. Sitting on the funds rather than clearing the debt can cost you twice.
Whether the trade favours you comes down to four factors:
- Your current super balance relative to the assets-test threshold (a single homeowner cut-off sits around $695,500).
- Your expected investment return inside super versus your mortgage interest rate.
- The number of years remaining on the loan.
- Your access conditions, including preservation age and eligibility for a transition-to-retirement (TTR) income stream, which permits up to 10% super withdrawal a year while still working.
Then there is the longevity risk, and the system-level regulators have flagged it directly.
The systemic warning The Retirement Income Review warns that widespread use of super to clear housing debt calls the adequacy and sustainability of the broader superannuation system into question.
The behavioural evidence backs the concern. Morningstar analysis of ABS data indicates that in 2022-23, more than one in four dollars of super lump sums withdrawn by retirees went to property-related spending, including mortgages. AHURI research found older retired mortgagors drawing super to service debt saw balances fall sharply, in one tracked pattern from $471,000 to $271,000 between 2010 and 2014, even as their property equity rose.
Whether tapping super improves or damages your retirement outcome depends on all three of the first factors above: return inside super versus the mortgage rate, assessable assets versus the pension threshold, and years left on the loan. Until you have compared all three, you are not yet in a position to make this call.
What the numbers demand of Australians who will not be mortgage-free by 65
The finish line has moved, the income cost is measurable in tens of thousands of dollars a year, and the super trade-off is genuinely conditional rather than settled. A reader who carries a mortgage past retirement faces a real, quantifiable gap, and the worst case is that higher income need, depleted super, and reduced pension eligibility converge in the same person at the same time. For lower-income borrowers in the Finder data, that convergence is not a tail risk. It is the statistically likely outcome, and it deserves to be treated as a planning priority now.
Three variables decide your own exposure. Quantify each before making any move:
CGT reform and super interact in a way that has materially shifted the analytical hierarchy for top-bracket earners: the Treasury Laws Amendment (Tax Reform No. 1) Act 2026, effective 1 July 2027, exempts superannuation funds from the new 30% minimum tax on real gains, pushing the pre-tax hurdle rate for super to beat a 6% mortgage to negative 0.66% under Morningstar modelling.
- The age at which your mortgage will actually be paid off, given your current repayments rather than your original schedule.
- Your projected super balance at 67, measured against ASFA’s benchmarks (a comfortable couple needs $77,375 a year, backed by a $730,000 lump sum) and against the assets-test cut-off.
- Whether that projected balance leaves you eligible for a full, part, or no Age Pension. The full single rate is a material figure, so pension status materially changes the maths.
One timing note. The August 2026 census has been taken, but updated housing results are not expected until June 2027, so the 2021 figures used throughout remain the most current official picture. The trend they capture has not reversed.
This article is for informational purposes only and should not be considered financial advice. Investors should conduct their own research and consult with financial professionals before making investment decisions. Past performance does not guarantee future results, and any projections are subject to market conditions and various risk factors.