Financial markets are pricing a roughly 90% probability that the Reserve Bank of Australia raises the cash rate at its 28-29 September 2026 meeting. The unusual part is the timing: that decision lands fewer than 24 hours before the next Australian inflation print, forcing the Board to act on data it has already seen rather than the reading everyone is waiting for.
That sequencing is what makes this moment structurally different from earlier in the 2026 tightening cycle. The question has stopped being whether the RBA has done enough. It is now how much further rates go, and how long they stay there.
The consensus has hardened around a higher-for-longer path. The RBA’s own May 2026 forecasts assumed a cash rate near 4.7% by the end of the year, and ASX futures are pricing the rate holding around 5% through 2027. That is no longer a fringe view; it is the base case.
This piece breaks down what the data actually tells you about the road ahead for Australian rates: why markets are this confident, what could still derail a September move, and what a prolonged rate plateau means for the fixed income, REITs, bank stocks, and rate-sensitive equities in your portfolio.
Why markets are treating a September hike as a near-certainty
The 90% market-implied probability of a September hike, cited in Vantage Markets analysis by senior market analyst Hebe Chen in late September 2026, is not a mood reading. It is the output of a specific chain of evidence that has stacked up over the winter.
Start with what the money is actually saying. When markets price a hike this heavily, they are telling you the cost of being wrong about a hold has become asymmetric. Anyone positioning for a surprise pause is betting against a great deal of conviction.
Here is what is driving that conviction:
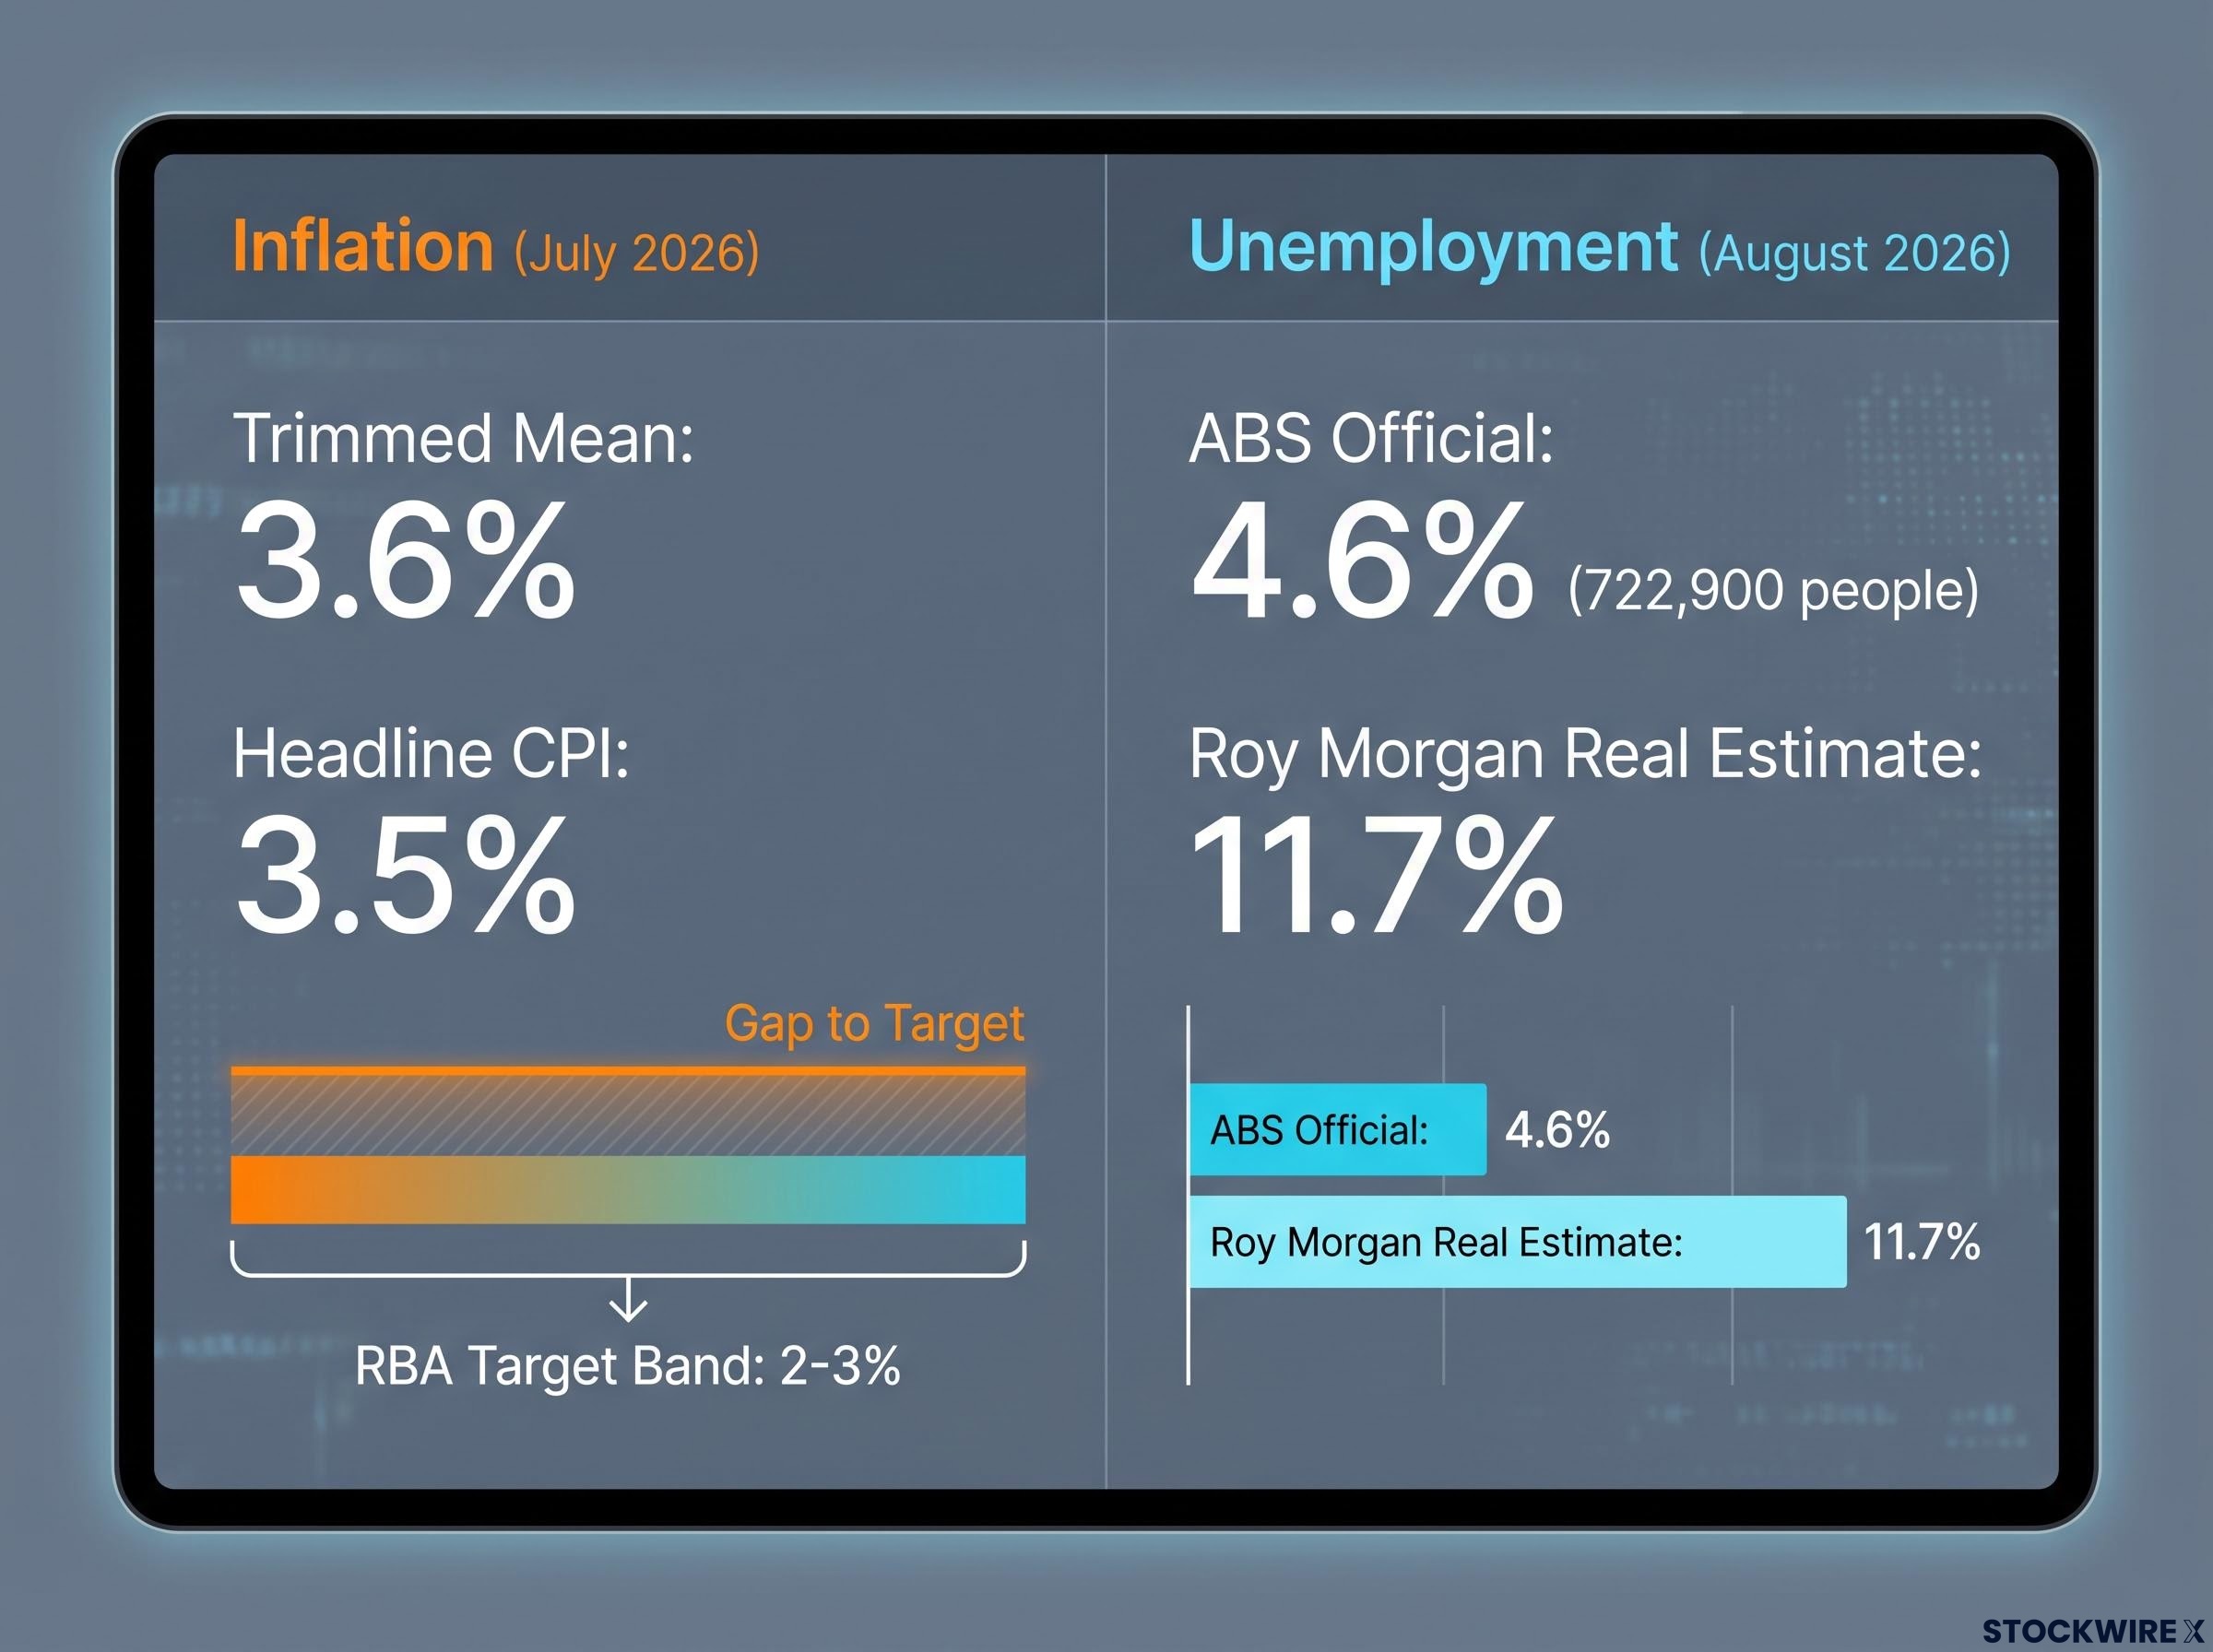
- Trimmed mean inflation, the RBA’s preferred underlying measure, has been stuck at 3.6% for two consecutive months, well above the 2-3% target band.
- The labour market is still adding jobs even as unemployment drifts higher, denying the RBA a clean slack argument to justify a pause.
- The RBA’s own forecast path assumes a cash rate near 4.7% by end-2026, which is institutional cover for hikes beyond the current 4.35%.
- ASX futures pricing points to a cash rate around 5% holding through 2027.
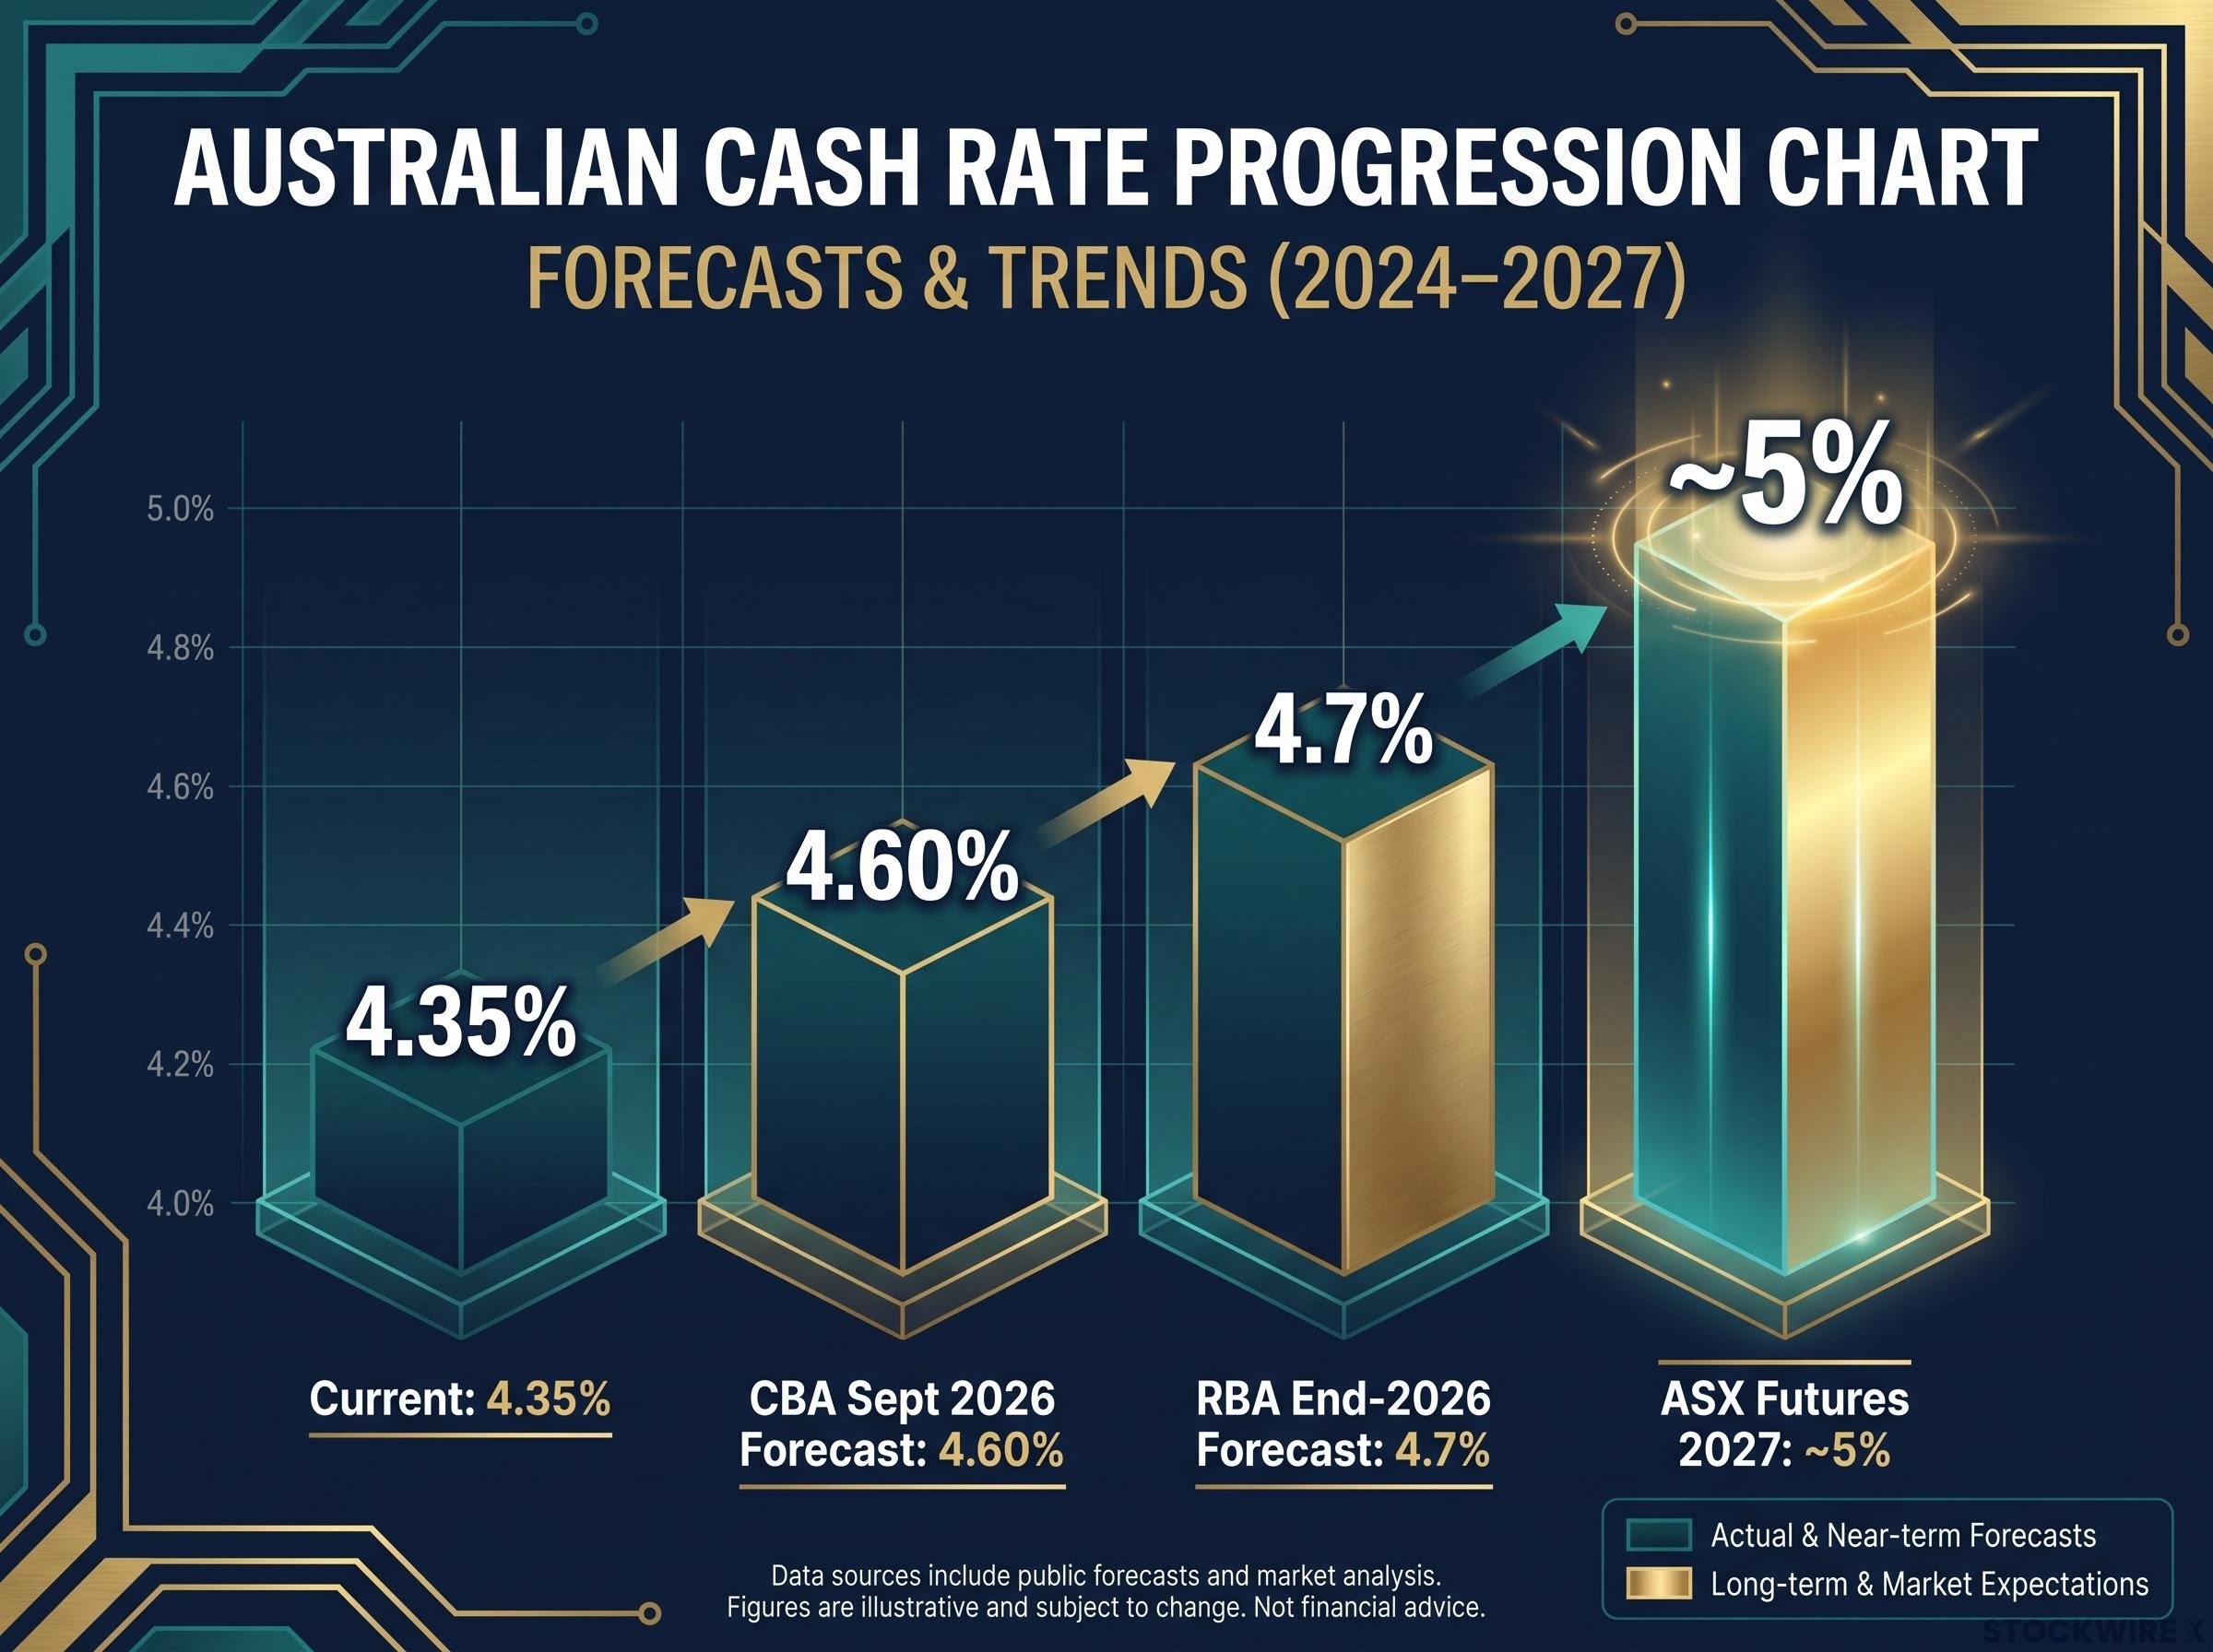
Commonwealth Bank has put a number on it. In its 24 September 2026 note, the bank forecast a 25-basis-point increase to 4.60% at the September meeting, a view that sits with the majority of major domestic institutions.
The RBA’s May Statement on Monetary Policy set the tone months earlier.
The RBA’s May 2026 Statement on Monetary Policy noted that labour-market and capacity pressures are expected to ease more than previously forecast, reflecting an assumption that the cash rate increases to 4.7 per cent by the end of 2026, up from the 4.2 per cent assumed in February.
Rewind to earlier in the year and the debate was whether the RBA had already finished tightening. That framing has collapsed. What markets are pricing now is not the end of the cycle but the length of the plateau, and the September decision is the next confirmation of that shift.
When big ASX news breaks, our subscribers know first
The inflation and labour data keeping the RBA’s hand forced
If markets are this confident, it is because the data underneath the pricing has refused to cooperate with the doves. Two pillars hold the hawkish case up, and neither has softened in a way the RBA could point to as progress.
The first is inflation. According to the ABS CPI release dated 26 August 2026, trimmed mean inflation held at 3.6% in the year to July 2026, unchanged from the June reading. Headline CPI came in at 3.5%.
Trimmed mean inflation is the RBA’s preferred policy signal precisely because it strips out volatile items like fuel and government-administered price changes, isolating the persistent domestic price pressures the Board can actually influence through rate settings.
Two months of no movement, against a 2-3% target, is the signal that matters here. It tells you the RBA is not in a position to declare victory. The September hike, if it comes, is a response to evidence that underlying price pressure is not fading, not an act of pre-emptive caution.
The ABS release points to where that stickiness lives.
The ABS July 2026 CPI data identify housing-related costs, including rents, new dwelling purchases, and utilities, alongside insurance and financial services, and food, as leading contributors to persistent annual inflation.
None of those are transitory categories. Housing costs in particular reflect a structural supply-demand imbalance that a few rate rises do not quickly resolve, which is precisely why the underlying figure has flatlined rather than fallen.
Housing cost inflation at 6.3% annually and electricity up 22.5% annually were identified as structural contributors to CPI well before the July 2026 data confirmed the same categories as the source of persistence, suggesting these components have been a consistent drag on disinflation throughout the 2026 tightening cycle.
| Indicator | Latest reading | RBA target or threshold |
|---|---|---|
| Trimmed mean inflation (annual) | 3.6% (to July 2026) | 2-3% target band |
| Headline CPI (annual) | 3.5% (to July 2026) | 2-3% target band |
| Unemployment rate (seasonally adjusted) | 4.6% (August 2026) | No slack signal yet for a pause |
What the labour market data actually shows
The second pillar is employment, and it is doing the RBA no favours. The ABS Labour Force release of 24 September 2026 showed unemployment rising 0.2 percentage points to 4.6% in August, with 722,900 people out of work.
The detail that matters is buried in how it rose. Commonwealth Bank’s commentary flagged that unemployment climbed to 4.6% while employment was still growing. A labour market that keeps creating jobs is not one the RBA can lean on to argue for a pause.
Some commentators reach for a broader gauge. Roy Morgan’s August 2026 estimate of “real unemployment”, which counts under-employment and marginal attachment differently from the ABS, sat at 11.7% of the workforce.
That figure is methodologically distinct from the official rate and is used to argue the labour market is weaker than headline numbers suggest. For rate policy, though, the RBA works off ABS data, and the ABS picture is of a labour market cooling too slowly to force its hand toward a cut.
The case against another hike, and why it has not yet prevailed
The cautionary case deserves a fair hearing, because the disagreement is not confined to outside commentators. The RBA itself has recorded dissent.
At the 5 May 2026 meeting, eight Board members voted to lift the cash rate to 4.35% while one voted to hold at 4.10%, citing concern about the cumulative weight of prior tightening. That is an institutional signal that reasonable people inside the Bank see over-tightening as a live risk.
The May 2026 rate decision established the institutional backdrop for the current debate: eight Board members voted to hike while one dissented, a margin that revealed the threshold between tightening and holding was narrower than the consensus framing suggested at the time.
Since then, the Board has held at 4.35% in both June and August. That ambiguity cuts both ways: dovish observers read the holds as reluctance to squeeze households further, while hawks read them as patience before the next move up.
Here is what the over-tightening case actually rests on:
- Recorded internal dissent at the May meeting, with one Board member preferring a lower rate.
- Two consecutive holds in June and August, read by some as caution rather than pause-before-hike.
- Roy Morgan’s broader “real unemployment” measure of 11.7%, pointing to stress the headline 4.6% rate does not capture.
- The RBA’s own acknowledgement that higher rates will weigh on households.
That last point comes straight from the Bank.
The RBA’s May 2026 Statement on Monetary Policy acknowledged that higher interest rates are expected to further dampen household spending and labour demand.
In practice, that risk looks like mortgage holders on variable rates diverting more income to repayments, and consumers pulling back on discretionary spending as real incomes stay squeezed. The scenario the cautious camp fears is a Board that keeps tightening into a slowdown it cannot yet see in the lagging data.
Why has that view not won? Because the evidence in front of the Board, sticky underlying inflation and a labour market still adding jobs, points the other way. Understanding the cautionary case matters less because it is likely to prevail in September and more because over-tightening is the scenario that would reprice rate-sensitive assets fastest if it arrived.
What higher-for-longer actually means for Australian investors
Set the policy debate aside and price the environment you are actually investing into. The cash rate sits at 4.35%, a move to 4.60% looks probable in September, the RBA’s own forecast points near 4.7% by year-end, and ASX futures have the rate around 5% through 2027.
That is not a brief tightening cycle. It is a sustained plateau, and it means positioning not just for the September decision but for a cash rate that could stay above 4.5% for the whole of 2027. Each asset class responds to that duration differently.
The higher-for-longer rate plateau was the consensus major bank view as early as April 2026, with Westpac projecting a terminal rate of 4.85% and CBA and ANZ both revising previously cautious outlooks upward as second-round oil price effects fed through to construction and services costs.
| Asset class | Rate headwind | Rate tailwind | Key variable to watch |
|---|---|---|---|
| Australian government bonds | Existing long-duration prices fall as yields rise | New buyers access running yields near decade highs | Trimmed mean inflation trajectory |
| REITs and property equities | Higher discount rates compress valuations | Rising rents support operational income | Refinancing exposure over 2026-2027 |
| Banks and financials | Mortgage stress and arrears lift credit risk | Wider net interest margins at higher rates | Household arrears trend |
| High-dividend defensives | Bonds and term deposits compete with dividends | Earnings-backed yields hold their appeal | Real yield versus dividend yield gap |
Fixed income: the case for new buyers vs existing holders
The relationship is mechanical. When yields rise, the price of bonds already issued at lower yields falls, which pressures anyone holding long-duration paper bought earlier in the cycle.
The flip side is the entry point. Australia’s 10-year government bond yield sat near 5.4% in late September 2026, according to Tradingeconomics data, close to its highest in about a decade.
For a new buyer, that is a running yield not seen in years. With trimmed mean inflation at 3.6%, the real yield, nominal yield minus inflation, is in positive territory for the first time in a long stretch, which is what makes fixed income more genuinely attractive now than at any point in the cycle so far.
The equity picture is more mixed. For REITs, higher discount rates compress valuations, but the same ABS housing data driving inflation, rising rents in particular, supports the operational income of residential and some commercial landlords. That is a real tension, not a straightforward negative.
Banks sit on a similar knife-edge. Higher rates can widen net interest margins, but as borrowing costs stay above 4.35%, the risk of rising mortgage stress and arrears introduces a credit-quality question that offsets some of that margin benefit.
Commentators often draw the parallel to the post-GFC period, when sustained high real yields compressed REIT and utility valuations but eventually opened up attractive fixed income entry points once inflation convincingly turned. The current setup, rates above 4% for an extended run with core inflation easing only gradually, fits that pattern of prolonged adjustment rather than a short, sharp shock.
Past performance does not guarantee future results. Financial projections are subject to market conditions and various risk factors.
What the September decision will and will not resolve
A September hike would confirm something important: that the RBA’s commitment to its inflation mandate is taking precedence over near-term worries about household stress, and that the higher-for-longer path has moved from market speculation to official policy.
What it will not resolve is whether the Bank has calibrated correctly. The rate decision lands fewer than 24 hours before the next inflation print, meaning the Board is acting on July data while the market waits on the newer reading. That release will immediately test the decision.
For investors, the print that follows is arguably the bigger event than the hike itself. A further upside surprise in trimmed mean inflation would push the ASX futures path harder toward 5%. A meaningful downside surprise would be the first credible signal that the rate plateau might arrive sooner than markets currently price.
Three forward variables will determine how long rates stay elevated, in order of priority:
- Trimmed mean inflation trajectory. Watch for any move below 3.5%. It is currently stuck at 3.6%, and a break lower is the clearest sign the RBA is winning.
- Unemployment trend. The rate rose from 4.4% in June to 4.6% in August. Whether it keeps drifting toward 5% or stabilises matters more than the level itself.
- Household consumption data. Signs that spending is slowing enough to ease services inflation would give the Board room to pause.
The RBA has been consistent about the goal.
The RBA Board has stated it will continue taking whatever steps it deems necessary to return inflation durably to the 2-3 per cent target band.
Treating the September decision as the end of rate uncertainty would misread the situation. The data releases that follow are where the forward path is actually set, and that is where managing your exposure earns its keep.
This article is for informational purposes only and should not be considered financial advice. Investors should conduct their own research and consult with financial professionals before making investment decisions. These statements are speculative and subject to change based on market developments and economic conditions.