
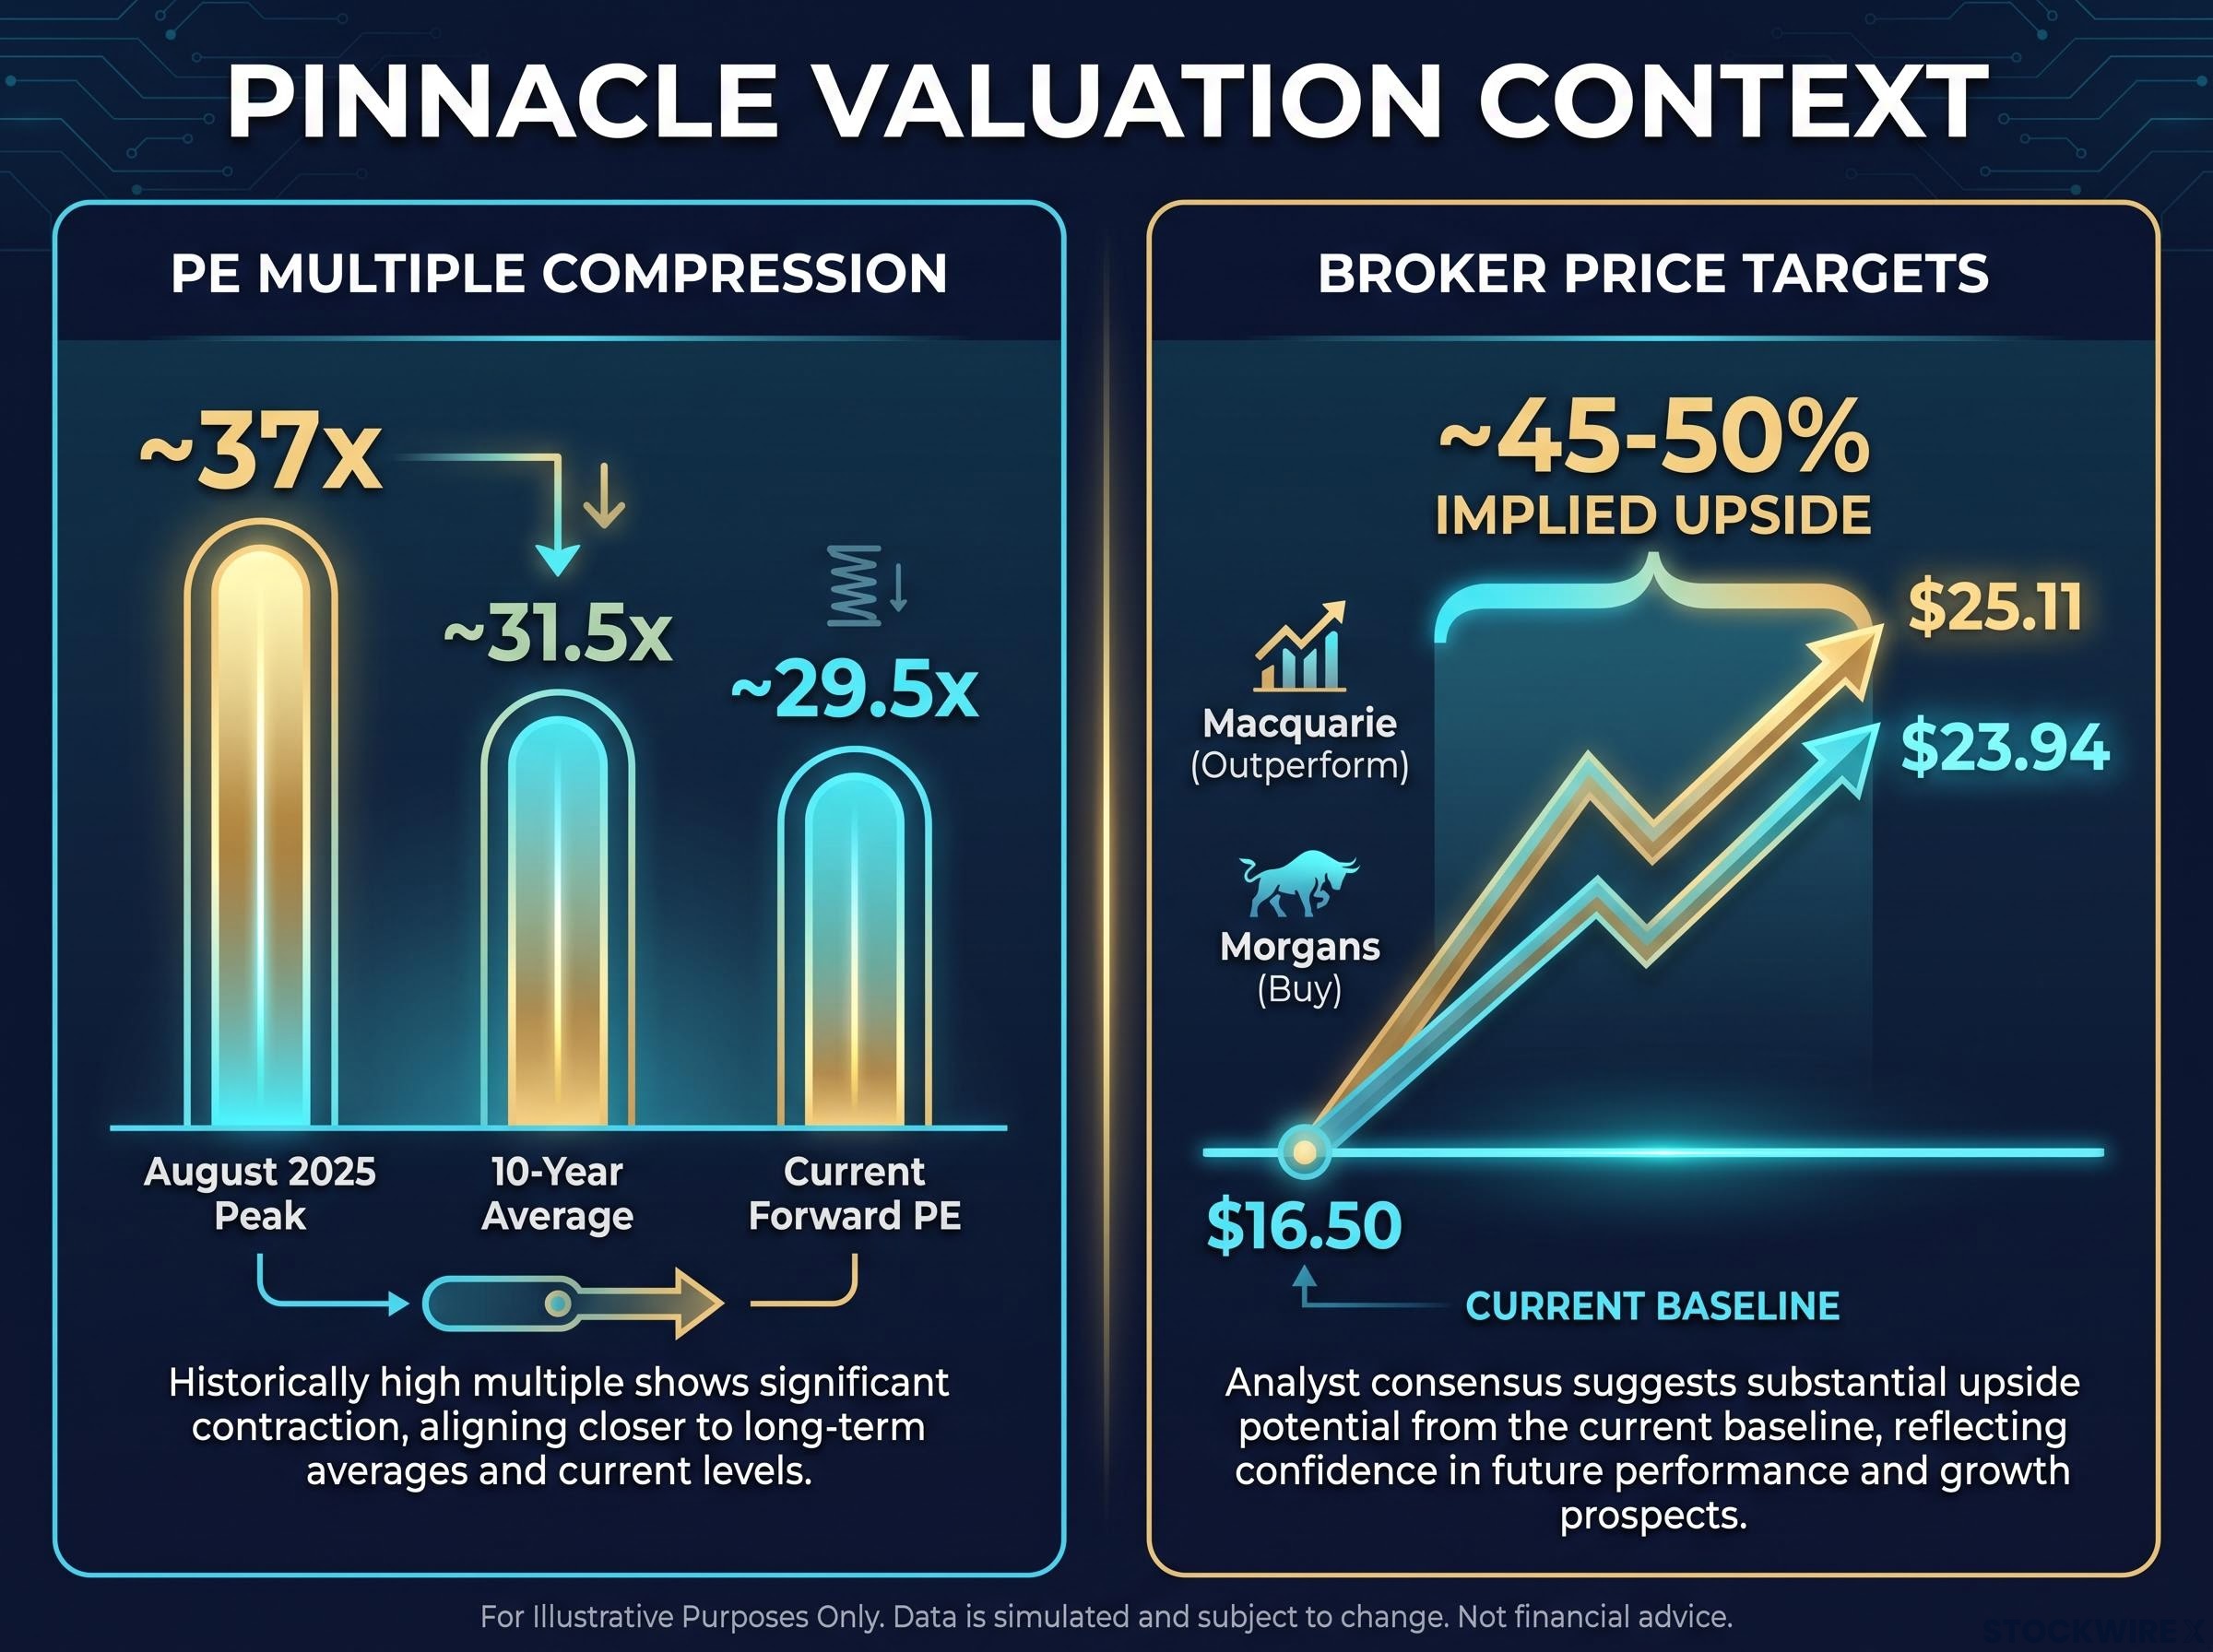
Pinnacle Investment Management has shed roughly 33% from its August 2025 peak. The stock, last trading at $16.50, has derated to a forward earnings multiple of roughly 29.5x, sitting fractionally under the 10-year average PE of approximately 31.5x. Broker targets from Macquarie and Morgans point to 45-50% upside from the current price.
The timing compresses the decision. Pinnacle’s FY26 full-year result lands tomorrow, 4 August 2026, which means investors reading this have hours to form a view, not days. The performance-fee headwinds that drove the derating are well understood. The open question is whether the Q3 flow surge and base-fee growth are strong enough to shift sentiment.
Here are six metrics and contextual signals that will determine whether today’s valuation reset is an opportunity or a value trap. After this, you will know exactly what numbers to watch when the result drops and what each one means for the investment case.
Where the multiple sits after a 33% share price retreat
Pinnacle peaked in August 2025 at a forward PE of approximately 37x, a level that assumed the business could maintain its exceptional FY25 performance-fee momentum. That assumption proved too optimistic. Since that high, the share price has pulled back roughly 33%, leaving it flat year-to-date and around 22% lower across the prior twelve months. The multiple has compressed to approximately 29.5x on a forward basis, a fraction beneath the 10-year historical average of roughly 31.5x.
That compression matters. It tells you the market has already absorbed the known negatives: the performance-fee normalisation, the base-effect pressure from an exceptional FY25, the reported earnings decline. The stock now needs to disappoint on forward metrics to fall materially further from here.
Two broker targets quantify the gap. Macquarie (Outperform) sits at $25.11. Morgans (Buy) sits at $23.94. Both imply roughly 45-50% upside from the current price.
| Metric | Value |
|---|---|
| Current share price | $16.50 |
| Forward PE | ~29.5x |
| 10-year average PE | ~31.5x |
| Peak PE (August 2025) | ~37x |
| Macquarie target | $25.11 (Outperform) |
| Morgans target | $23.94 (Buy) |
| Implied upside | ~45-50% |
When big ASX news breaks, our subscribers know first
What Pinnacle actually is (and why the multi-affiliate model matters for reading results)
Pinnacle is not a fund manager in the traditional sense. It holds equity interests across a collection of specialist investment boutiques, among them Plato, Antipodes, Metrics, Hyperion, and Coolabah, receiving a share of each affiliate’s management and performance fees in exchange for three things:
- Staked ownership: Pinnacle holds equity interests across the affiliate network, aligning incentives and sharing in each boutique’s growth.
- Scalable distribution: Pinnacle provides centralised distribution, marketing, and institutional sales, allowing boutiques to focus on investment management.
- Dual fee streams: Revenue comes from base management fees (stable, recurring, tied to funds under management) and performance fees (volatile, tied to affiliate outperformance against benchmarks).
The operating leverage is the key. As funds under management (FUM) grow, base-fee revenue grows proportionally, but Pinnacle’s costs do not scale at the same rate. That is why the platform has grown from seven boutiques with roughly $23 billion in FUM back in December 2016 to 18 affiliates managing $202.5 billion by December 2025.

This matters for reading the FY26 result correctly. H1 FY26 base-fee revenue (on a 100% basis across affiliates) grew 24% year-on-year to $546.6 million. At the Pinnacle level, performance fees fell 63% year-on-year, dropping from $36.4 million to $13.4 million after tax.
The 63% decline is the number that spooked the market and drove the derating. Understanding that base fees simultaneously grew 24% is what separates investors reading the result correctly from those reacting to the headline. The reported profit weakness is primarily a performance-fee comparison problem, not evidence of structural decline.
Q3 net flows and why the inflow story is running well ahead of expectations
The Q3 flow number landed as a genuine surprise. Pinnacle reported net inflows of $9.4 billion for the third quarter of FY26.
At $9.4 billion, Q3 net inflows covered roughly 85% of the $11.1 billion that Macquarie had forecast for the full second half of FY26, and Q4 is yet to be counted.
That single quarter effectively front-loaded the second-half flow story. Combined with record H1 inflows of $17.2 billion, three-quarter cumulative flows are already in exceptional territory. Broker full-year forecasts cluster around $31.4 billion (Macquarie) to $33 billion (Morgans), and the Q3 result suggests those estimates may prove conservative.
The number that matters most tomorrow is not reported profit. It is the closing FUM figure at 30 June 2026. That figure determines FY27 base management fee revenue, which is the primary driver of forward earnings capacity. With FUM already at $202.5 billion as of December 2025, a strong Q4 flow quarter and positive market returns would push the closing number higher still.
The Q3 result effectively tells you that Pinnacle’s organic growth engine is running materially ahead of where the market expected it to be. That is the most direct evidence available that the derating may be overdone.
Six metrics that will determine the market’s reaction tomorrow
The result drops on 4 August 2026. Here is the checklist: what to look for, what the consensus expects, and what a beat or miss looks like for each metric.
The pre-result scorecard
| Metric | Consensus expectation | Beat signal | Miss signal |
|---|---|---|---|
| 1. Full-year net inflows | $31.4-$33 billion | Above $33 billion | Below $30 billion |
| 2. H2 performance fees | ~$33 million (Morgans) | Above $35 million | Below $25 million |
| 3. Full-year NPAT | $149.6-$157.6 million | Above $158 million | Below $145 million |
| 4. Final dividend | ~31-32 cents (implied) | Above 32 cents with maintained franking | Below 29 cents or reduced franking |
| 5. PAM acquisition update | Integration progress and timeline | Accelerated earnings contribution | Delays or cost overruns |
| 6. FY27 qualitative guidance | Commentary on fee normalisation | Confidence on performance fee recovery | Cautious language on flows or fees |
Full-year dividends are forecast at 60.3 cents (Macquarie) and 61.1 cents (Morgans), implying a final dividend of approximately 31-32 cents against an interim of 29.0 cents paid at a 96% payout ratio. Commentary on payout sustainability at that elevated ratio will be as closely watched as the number itself.
Each of these six metrics is a pass/fail test for a different part of the investment thesis. If you know the benchmark going in, you can assess the result in real time rather than waiting for broker notes to form a view.
How PNI has moved on result days historically
Pinnacle does not drift on results days. It moves.
- FY25 full-year result (5 August 2025): Shares gained 2.6% at the open to reach $21.88, extended to a 4.7% gain by the close at $22.32, and then added a further 9.4% the next session to finish at $24.43.
- 1H FY25 result (4 February 2025): The stock rose 2.7% at the open to $17.35, pushed as high as $18.48 for an intraday gain of 9.4%, faded back to near its opening level by the close, and then recovered 3.1% the following day to $17.97.
The pattern is consistent: multi-day moves rather than single-session reactions, with the direction contingent on how the result sits relative to consensus on flows and fees.
With the stock now trading below its historical average PE and 33% off its peak, the asymmetry tilts. Upside surprise risk may be larger than downside risk relative to recent history, because the derating has already priced in much of the known bad news. That said, any disappointment on flows or dividends can still be punished. The historical pattern tells you that waiting for the result to settle before acting may cost a significant portion of the move if the numbers come in strong, because PNI tends to gap and run rather than drift gradually higher.
What the evidence says heading into tomorrow
Three signals support a positive result reception:
- After a 33% retreat from its August 2025 peak, the stock’s forward PE of roughly 29.5x has slipped below the 10-year historical average of approximately 31.5x, reflecting a valuation that has already absorbed considerable bad news.
- The Q3 FY26 update showed net inflows of $9.4 billion, a figure that on its own accounted for roughly 85% of what Macquarie had modelled for the full second half, pointing to organic growth momentum well ahead of prior expectations.
- Broker targets of $23.94-$25.11 imply 45-50% upside, with both Macquarie and Morgans maintaining constructive ratings.
Two genuine risk factors could disappoint:
- H2 performance fees remain the swing variable. Morgans forecasts $33 million, but this requires a meaningful recovery in affiliate investment performance during the second half.
- H1 NPAT of $67.3 million (down 11% year-on-year) reflects the base-effect pressure from an exceptional FY25, and the full-year reported number will still carry that headwind even if the business is fundamentally healthy.
The evidence tilts toward a market that has already absorbed most of the known negatives. What remains uncertain is whether the flow story and fee recovery are strong enough to close the gap to analyst targets over the next twelve months.
This pre-result setup suits an investor with a 12-month-plus horizon who can tolerate result-day volatility in exchange for exposure to the longer-term FUM compounding thesis. The derating has done the work of compressing the multiple; the result tomorrow determines whether the base-fee growth and flow momentum can do the work of expanding it again.
This article is for informational purposes only and should not be considered financial advice. Investors should conduct their own research and consult with financial professionals before making investment decisions. Past performance does not guarantee future results. Financial projections are subject to market conditions and various risk factors.