
The most important number for valuing an ASX biotech is rarely found in its financial statements. It sits in a clinical trial data table, buried in a response rate or a survival curve, and it separates investors who understand this sector from those who misread it entirely.
ASX-listed oncology companies routinely trade with no revenue, no earnings, and multimillion-dollar market capitalisations. The logic supporting those valuations is not income-based; it is probability-based. Clinical trial milestones function as the sector’s equivalent of earnings beats. Each data readout revises the market’s estimate of whether a drug will ever reach commercialisation, and that revision is what moves price. Pancreatic cancer treatment has become one of the highest-stakes arenas in this framework precisely because historical outcomes have been so poor. Any credible efficacy signal carries scientific and commercial weight that few other indications can match.
What follows decodes how oncology trial metrics translate into probability-weighted pipeline value, why the KRAS inhibitor combination space is drawing institutional capital, and what Amplia Therapeutics’ ACCENT trial illustrates about de-risking milestones and re-rating events in ASX micro-cap biotech.
Why ASX biotech valuations are built on probability, not profit
Traditional valuation metrics, P/E ratios, EV/EBITDA, revenue multiples, are structurally irrelevant for pre-revenue biotechs. There is no income to discount. Instead, the market treats each development programme as a sequence of risk gates, from preclinical work through Phase 1, Phase 2, Phase 3, and regulatory approval, and discounts the potential peak sales of the asset by the probability of clearing each gate.
Four components anchor a probability-weighted pipeline valuation:
- Peak commercial opportunity: the estimated addressable market, pricing, and penetration for the target indication
- Probability of approval: starting from historical phase transition base rates and adjusted by trial data
- Time to revenue: remaining development timeline, discounted at rates appropriate for high-risk biotech
- Partnership optionality: the probability-weighted value of licensing, co-development, or acquisition proceeds
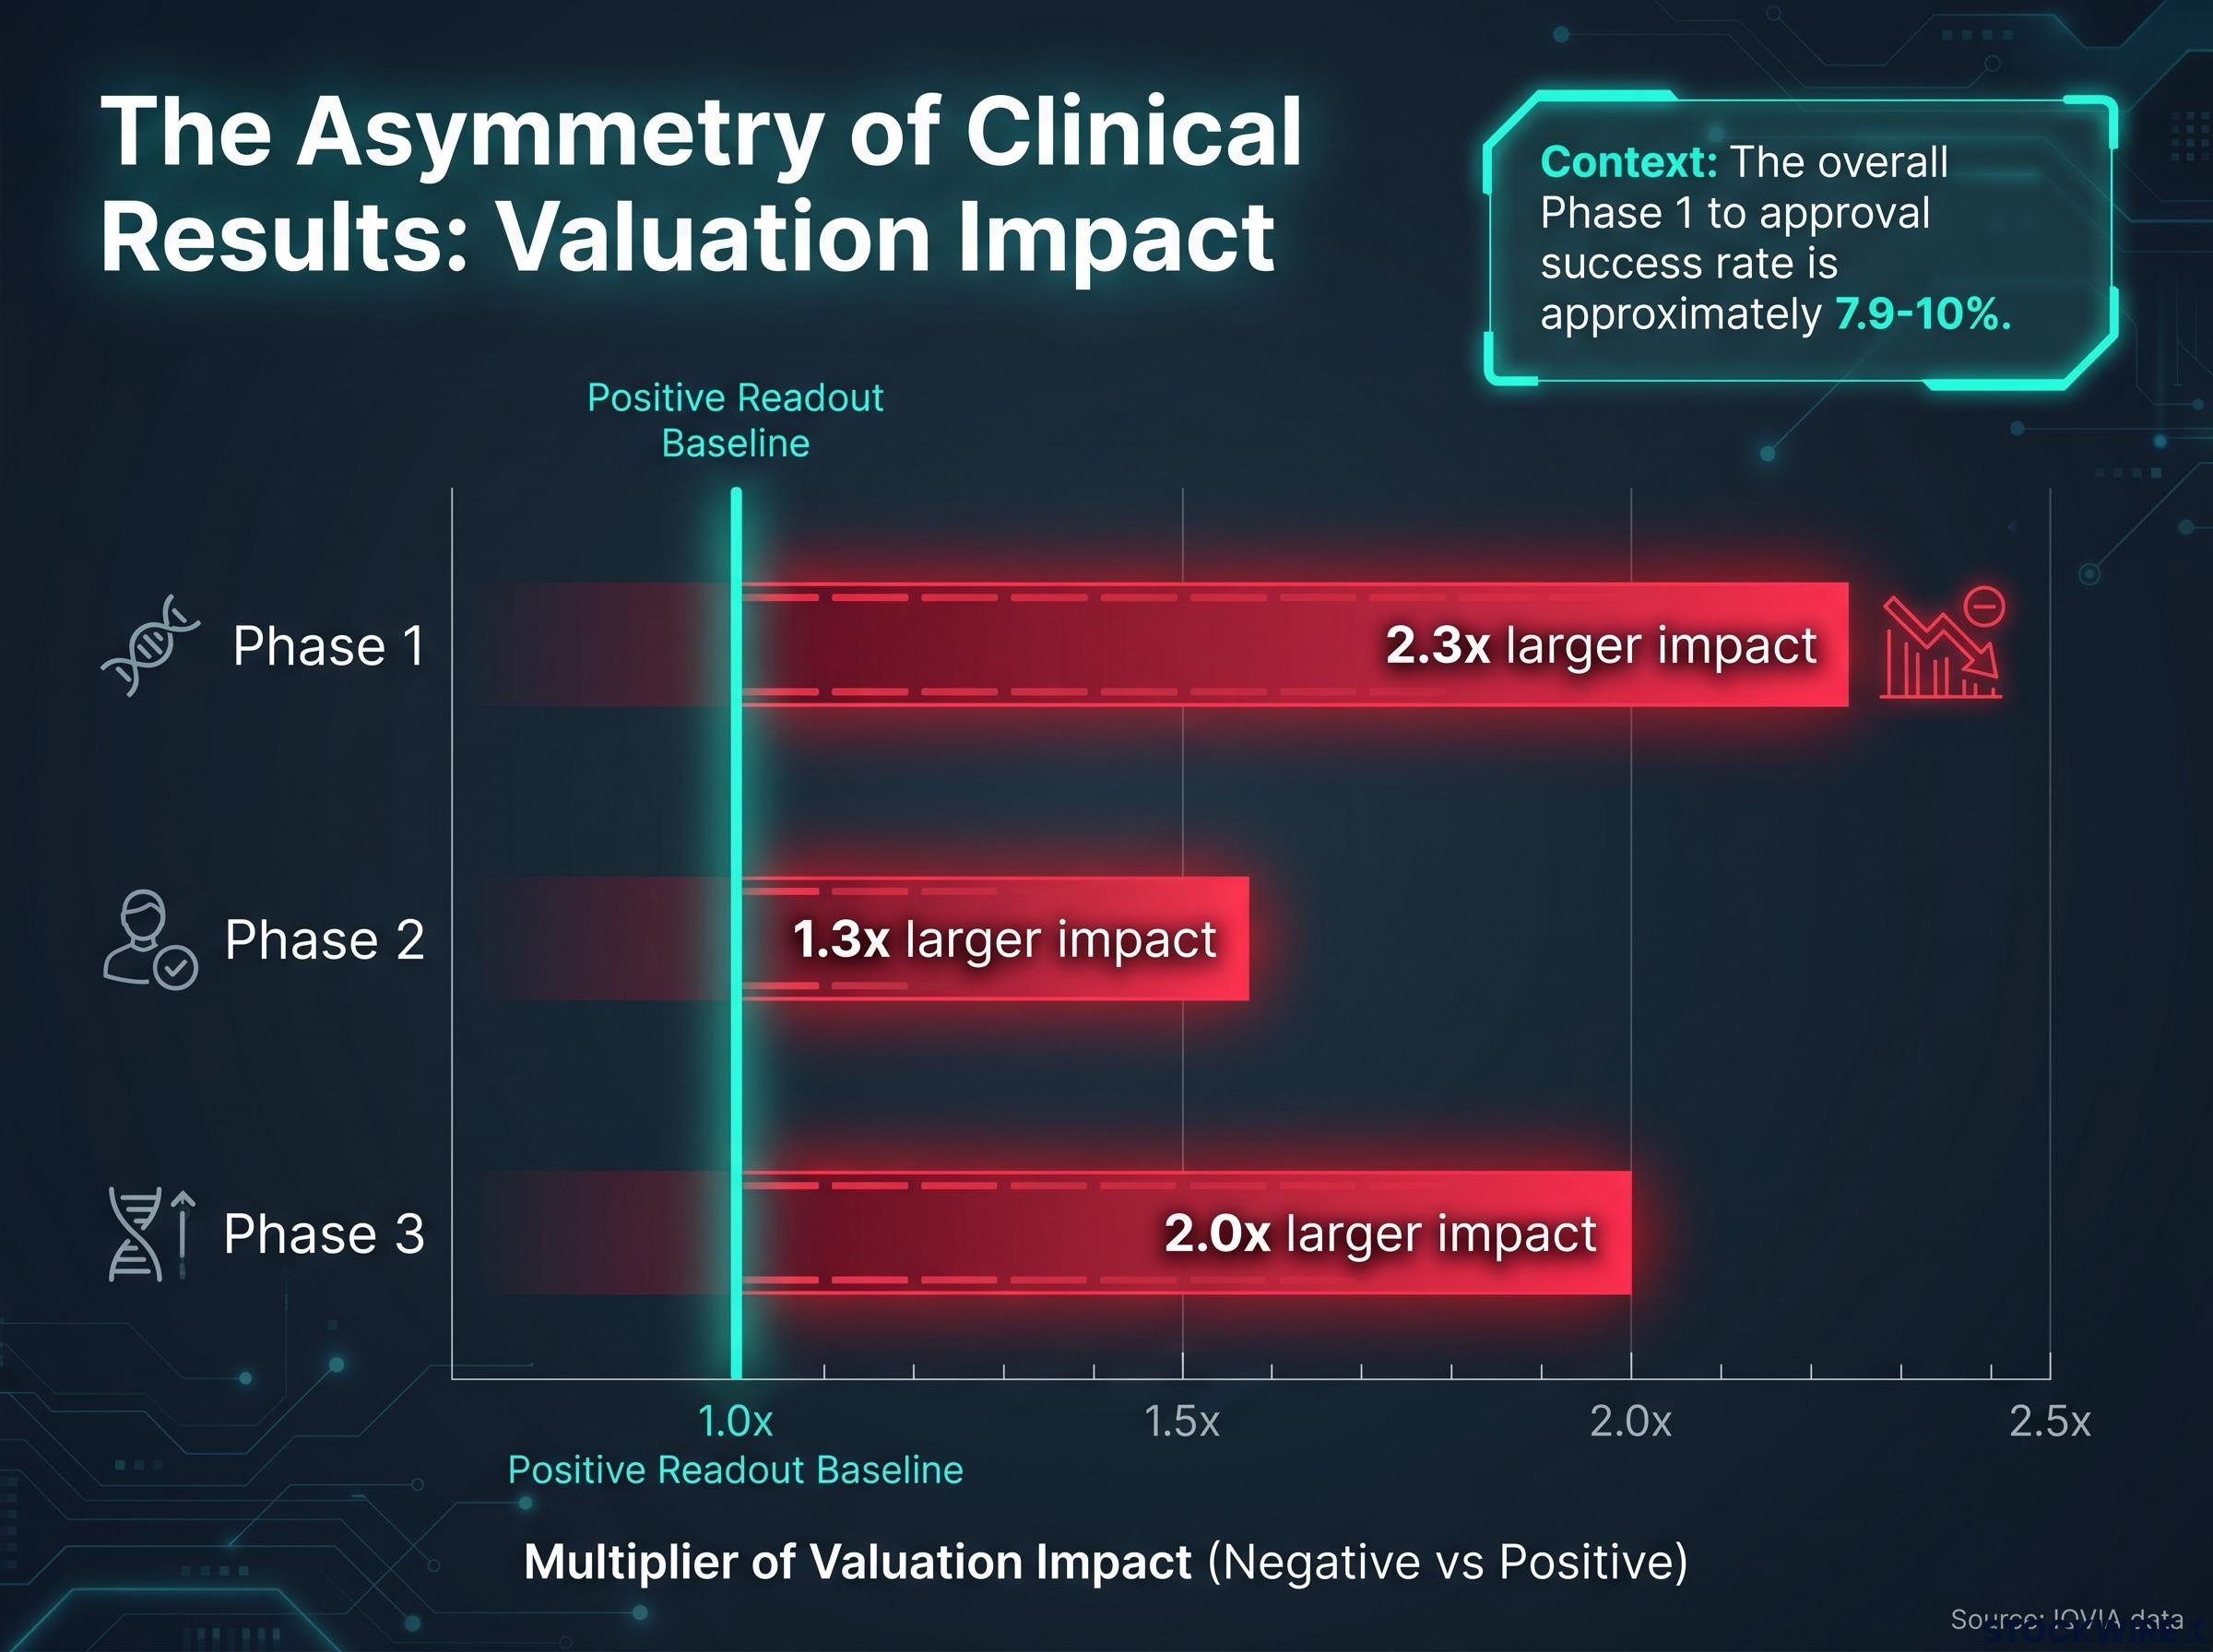
According to IQVIA research on emerging biopharma companies (those under $1 billion in market capitalisation), valuations are highly sensitive to clinical readouts because most value is concentrated in one or a few pipeline assets. The overall Phase 1 to approval success rate sits at approximately 7.9-10%. On the ASX specifically, even operational validation events such as ethics submissions and reimbursement decisions have triggered 6-25%+ single-day moves in healthcare stocks.
The probability model described above does not operate in isolation from the broader regulatory environment; ASX healthcare sector risks have compounded in 2025-2026 as FDA staffing reductions create unpredictable approval backlogs that directly affect the timeline assumptions built into any biotech’s net present value calculation.
The asymmetry of good and bad news in clinical results
The stakes cut in both directions, but not equally. IQVIA data quantifies the asymmetry: negative clinical readouts produce approximately 2.3 times larger valuation impacts than positive ones in Phase 1, 1.3 times in Phase 2, and 2.0 times in Phase 3. For a single-asset micro-cap, where one programme failure can permanently impair the entire company’s equity value, this asymmetry is the defining risk characteristic of the sector.
When big ASX news breaks, our subscribers know first
Pancreatic cancer as the most unforgiving test case in oncology
Pancreatic ductal adenocarcinoma (PDAC), the most common form of pancreatic cancer, has historically resisted treatment with a consistency that few other solid tumours match. The biology explains why. PDAC tumours build a dense, fibrotic barrier (called the stroma) around themselves that physically limits how much drug can reach the cancer. That same microenvironment suppresses the immune system’s ability to attack the tumour, neutralising approaches that have worked in other cancers.
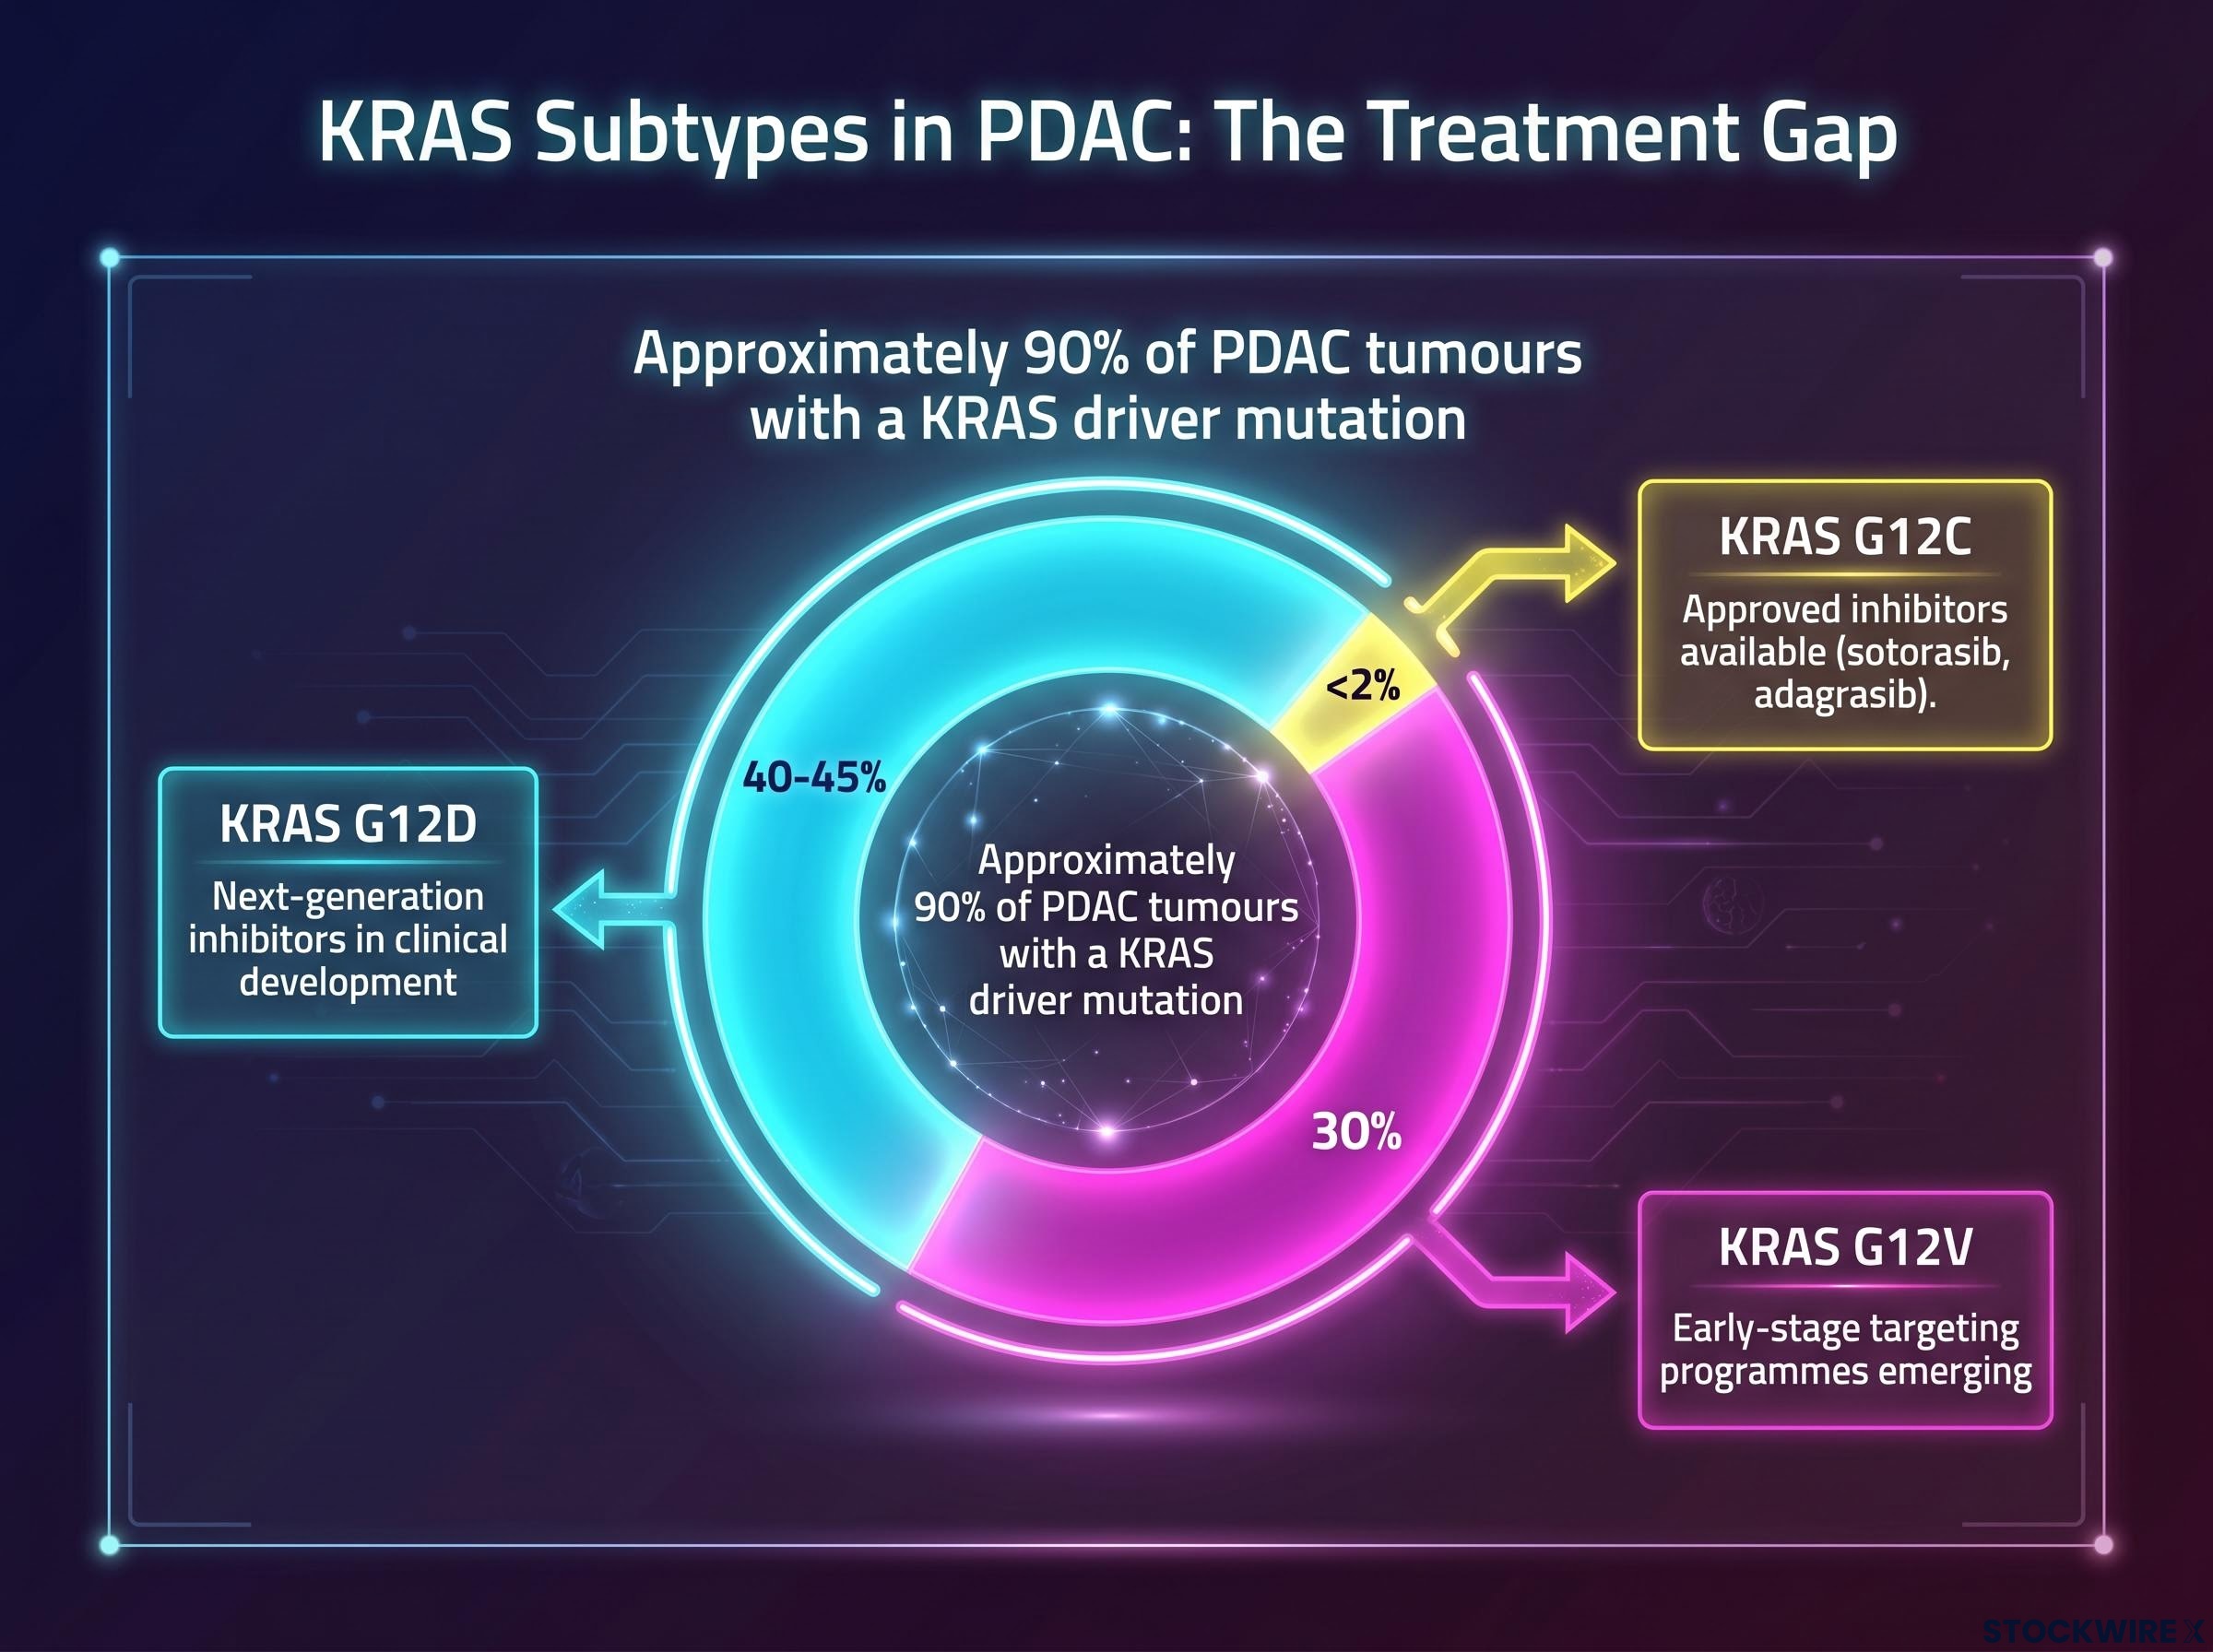
Approximately 90% of PDAC tumours carry a KRAS driver mutation, making KRAS the dominant oncogenic pathway in this cancer.
For decades, KRAS was considered undruggable. That changed when first-generation KRAS G12C inhibitors, sotorasib and adagrasib, demonstrated clinical proof-of-concept in lung cancer and reached commercialisation. Their success validated the broader strategy of KRAS blockade and triggered a wave of institutional capital into next-generation programmes targeting the KRAS subtypes that dominate in PDAC.
| KRAS Subtype | Approximate Frequency in PDAC | Current Therapeutic Targeting Status |
|---|---|---|
| KRAS G12D | 40-45% | Next-generation inhibitors in clinical development |
| KRAS G12V | ~30% | Early-stage targeting programmes emerging |
| KRAS G12C | <2% | Approved inhibitors available (sotorasib, adagrasib) |
The gap is stark. The subtypes with approved drugs account for less than 2% of PDAC cases. The subtypes that dominate the disease, G12D and G12V, are where the next wave of clinical and commercial activity is concentrated. Any combination strategy showing activity against these subtypes attracts institutional attention precisely because the unmet need is so large and the historical bar so low.
Decoding trial metrics as capital allocation signals
Three clinical metrics form the primary language of early-oncology capital allocation. They emerge in a specific sequence, and each one carries a different weight in a probability model.
- Objective response rate (ORR) appears first. It measures the percentage of patients whose tumours shrink by a predefined amount. ORR is the initial hard efficacy signal in Phase 1b-2 trials.
- Complete response (CR) rate emerges concurrently. It measures the percentage of patients in whom all measurable disease disappears. In aggressive tumours like PDAC, CRs are rare, and their presence signals exceptional depth of activity.
- Median overall survival (mOS) matures last. It is the definitive endpoint for most Phase 3 approvals and the number that ultimately determines whether a drug changes patient outcomes.
| Metric | What It Measures Clinically | What It Signals for a Probability Model | Typical Availability |
|---|---|---|---|
| ORR | Proportion of patients with meaningful tumour shrinkage | First evidence the drug is active; compared against standard-of-care benchmarks (~20-30% in PDAC settings) | Phase 1b-2 interim data |
| CR Rate | Proportion of patients with complete disappearance of measurable disease | Amplifies confidence in response quality; rare CRs in PDAC indicate exceptional activity | Concurrent with ORR |
| mOS | Median time patients survive from treatment start | Definitive efficacy measure; even directionally favourable early trends raise Phase 3 success probability | Late Phase 2 or Phase 3 |
The distinction investors need is that ORR performance matters relative to benchmarks, not in absolute terms alone. In high-unmet-need indications, a strong ORR can also support accelerated approval pathways, pulling forward modelled time-to-market and enhancing net present value before survival data mature. Early mOS, meanwhile, is treated as directional input rather than conclusive evidence, and markets price this distinction. Data quality matters as much as data direction.
Amplia Therapeutics and the FAK inhibitor combination thesis in PDAC
Focal adhesion kinase (FAK) is a signalling protein involved in cell adhesion, migration, and the maintenance of the dense stromal barrier that makes PDAC so difficult to treat. Preclinical and early clinical work suggests that inhibiting FAK can remodel the tumour stroma to improve drug penetration and reduce the immunosuppressive signals that shield the cancer from immune attack.
That mechanism positions a FAK inhibitor not as a standalone agent but as an enabling combination backbone, a drug designed to make other treatments work better.
Anti-fibrotic approaches in PDAC are attracting capital across multiple ASX programmes simultaneously; Syntara’s amsulostat targets LOX enzymes to break down the same dense stromal barrier that FAK inhibition addresses through a different mechanism, illustrating that the stroma remodelling thesis has sufficient scientific credibility to draw independent government-funded validation.
What each ACCENT data readout means for probability-weighted pipeline value
Amplia Therapeutics (ASX: ATX) and its lead compound narmafotinib (AMP945) provide a case study in how this logic plays out for a listed company. The ACCENT Phase 1b/2a trial evaluates narmafotinib in combination with gemcitabine and nab-paclitaxel in PDAC patients.
Each ACCENT data readout, ORR against standard-of-care benchmarks, any CRs in a disease where they are exceptionally rare, directionally favourable survival trends, adjusts the probability-weighted assessment of the full pipeline. If the combination produces activity materially above the 20-30% ORR range typical of the treatment setting, the market revises its estimate of Phase 3 success probability upward. Emerging mOS trends feed into late-stage trial probability modelling. FDA engagement on a registration-enabling Phase 3 design would represent a structural inflection by collapsing regulatory uncertainty and clarifying the probability model.
Investors who want to examine the specific numbers behind the framework described here will find our full explainer on the ACCENT trial results covers the independently verified 8% complete response rate, the 36% objective response rate against MPACT benchmarks, and the progression-free and overall survival comparisons across all major chemotherapy regimens.
The platform positioning argument adds a separate valuation layer. Narmafotinib’s potential as a combination partner extends across multiple paths:
- Standalone PDAC programme (ACCENT trial)
- KRAS inhibitor combination partnerships
- Additional indication expansion beyond PDAC
- Licensing or co-development with larger pharmaceutical companies
Each path represents a partly independent probability of value realisation, which justifies adding partnership optionality as a distinct line item in a probability-weighted model. This is the structural advantage of a platform asset over a single-indication bet.
Distinguishing high-weight milestones from low-weight announcements
Not all milestones carry equal weight. Because “milestone” announcements are powerful narrative tools in biotech promotion, investors need a filter.
| Milestone Type | De-Risking Weight | Reason |
|---|---|---|
| Externally scrutinised ORR/CR data above benchmarks | High | Changes the probability model with hard, comparable data |
| Formal FDA feedback on registration design | High | Collapses regulatory uncertainty on endpoints, comparators, and sample size |
| Licensing or co-development activity | High | External validation of programme quality by a party risking its own capital |
| Directionally favourable survival data | Moderate-High | Supports Phase 3 probability; early data is directional, not conclusive |
| “First patient dosed” or “trial initiated” | Low | Operationally necessary but does not change probability of success |
| Non-quantified “encouraging trends” | Low | Narrative without data; no basis for model revision |
A well-telegraphed FDA design meeting can have as much or more valuation impact than a single incremental ORR update, because it defines the regulatory bar the drug must clear, allowing investors to model probability of success against known criteria.
Formal FDA feedback on trial design demonstrates in practice what the probability model describes in theory: Starpharma’s Type C guidance meeting confirmed that European clinical data combined with its preclinical package would support a US Investigational New Drug application, collapsing the regulatory uncertainty that previously prevented any credible timeline modelling for its US commercial pathway.
IQVIA’s research reinforces this point: company valuations respond not just to efficacy and safety data but to events that clarify prospects, and regulatory feedback is among the most powerful of those clarifying events.
The milestones that will actually define the KRAS combination era in PDAC
As first-generation KRAS inhibitor approvals validate the broader strategy, institutional attention is expanding toward earlier-stage combination partners. The milestones that determine which assets attract that capital are clinical and regulatory, not financial.
For PDAC oncology assets, the five milestone categories most likely to drive genuine valuation shifts, ranked by de-risking weight, are:
- Externally scrutinised ORR and CR data that outperform relevant benchmarks in a defined PDAC population
- Formal FDA or major regulator feedback on a registration-enabling study design
- Directionally favourable survival data, even from small cohorts
- Initiation of credible combination trials with validated KRAS or other backbone partners
- Licensing, co-development, or acquisition activity that monetises the programme before approval
The overall Phase 1 to approval success rate of approximately 7.9-10% is the base rate every investor must hold when applying any upward probability adjustment. Most assets in this space will not reach commercialisation.
The BIO clinical development success rates report covering 2011-2020 quantifies the oncology-specific approval likelihood at 5.3% from Phase 1, meaningfully below the cross-indication average, which underscores why any credible efficacy signal in PDAC carries disproportionate weight in a probability-weighted model.
That base rate is the discipline check. Investors who time entry around genuine de-risking events rather than narrative peaks carry a structurally better risk-to-reward profile. Regulatory clarity, particularly FDA engagement, tends to precede or catalyse strategic interest from larger pharmaceutical companies, connecting the regulatory milestone directly to the partnership optionality layer in a probability-weighted model.
What separates capital discipline from speculation in ASX biotech
In a sector where valuations move on probability revisions rather than reported earnings, the investor’s task is specific: assess which upcoming milestones are genuinely capable of changing the probability model, and size positions accordingly.
Capital discipline means positions sized around genuine de-risking milestones, with awareness of phase transition base rates and dilution risk. Speculation means positions sized on narrative alone, without reference to data benchmarks or regulatory anchors. The distinction is not about conviction; it is about the quality of evidence behind the conviction.
The probability-weighted framework introduced earlier provides a structured checklist for that discipline:
- Peak commercial opportunity: Is the addressable market large enough to justify the risk?
- Probability of approval: Has trial data moved the probability above base rates, and by how much?
- Time to revenue: How many years and how much dilution sit between here and commercialisation?
- Partnership optionality: Does the asset’s mechanism position it as a credible combination partner within a validated theme?
The KRAS and FAK combination space in PDAC is an instructive current example. The themes are real, the science is credible, and the milestones are identifiable. But the base rates mean that rigorous milestone evaluation remains the non-negotiable foundation of any position.
This article is for informational purposes only and should not be considered financial advice. Investors should conduct their own research and consult with financial professionals before making investment decisions. Past performance does not guarantee future results, and the clinical development outcomes discussed are subject to significant uncertainty. The Phase 1 to approval success rates cited reflect historical averages and individual programmes may differ materially.