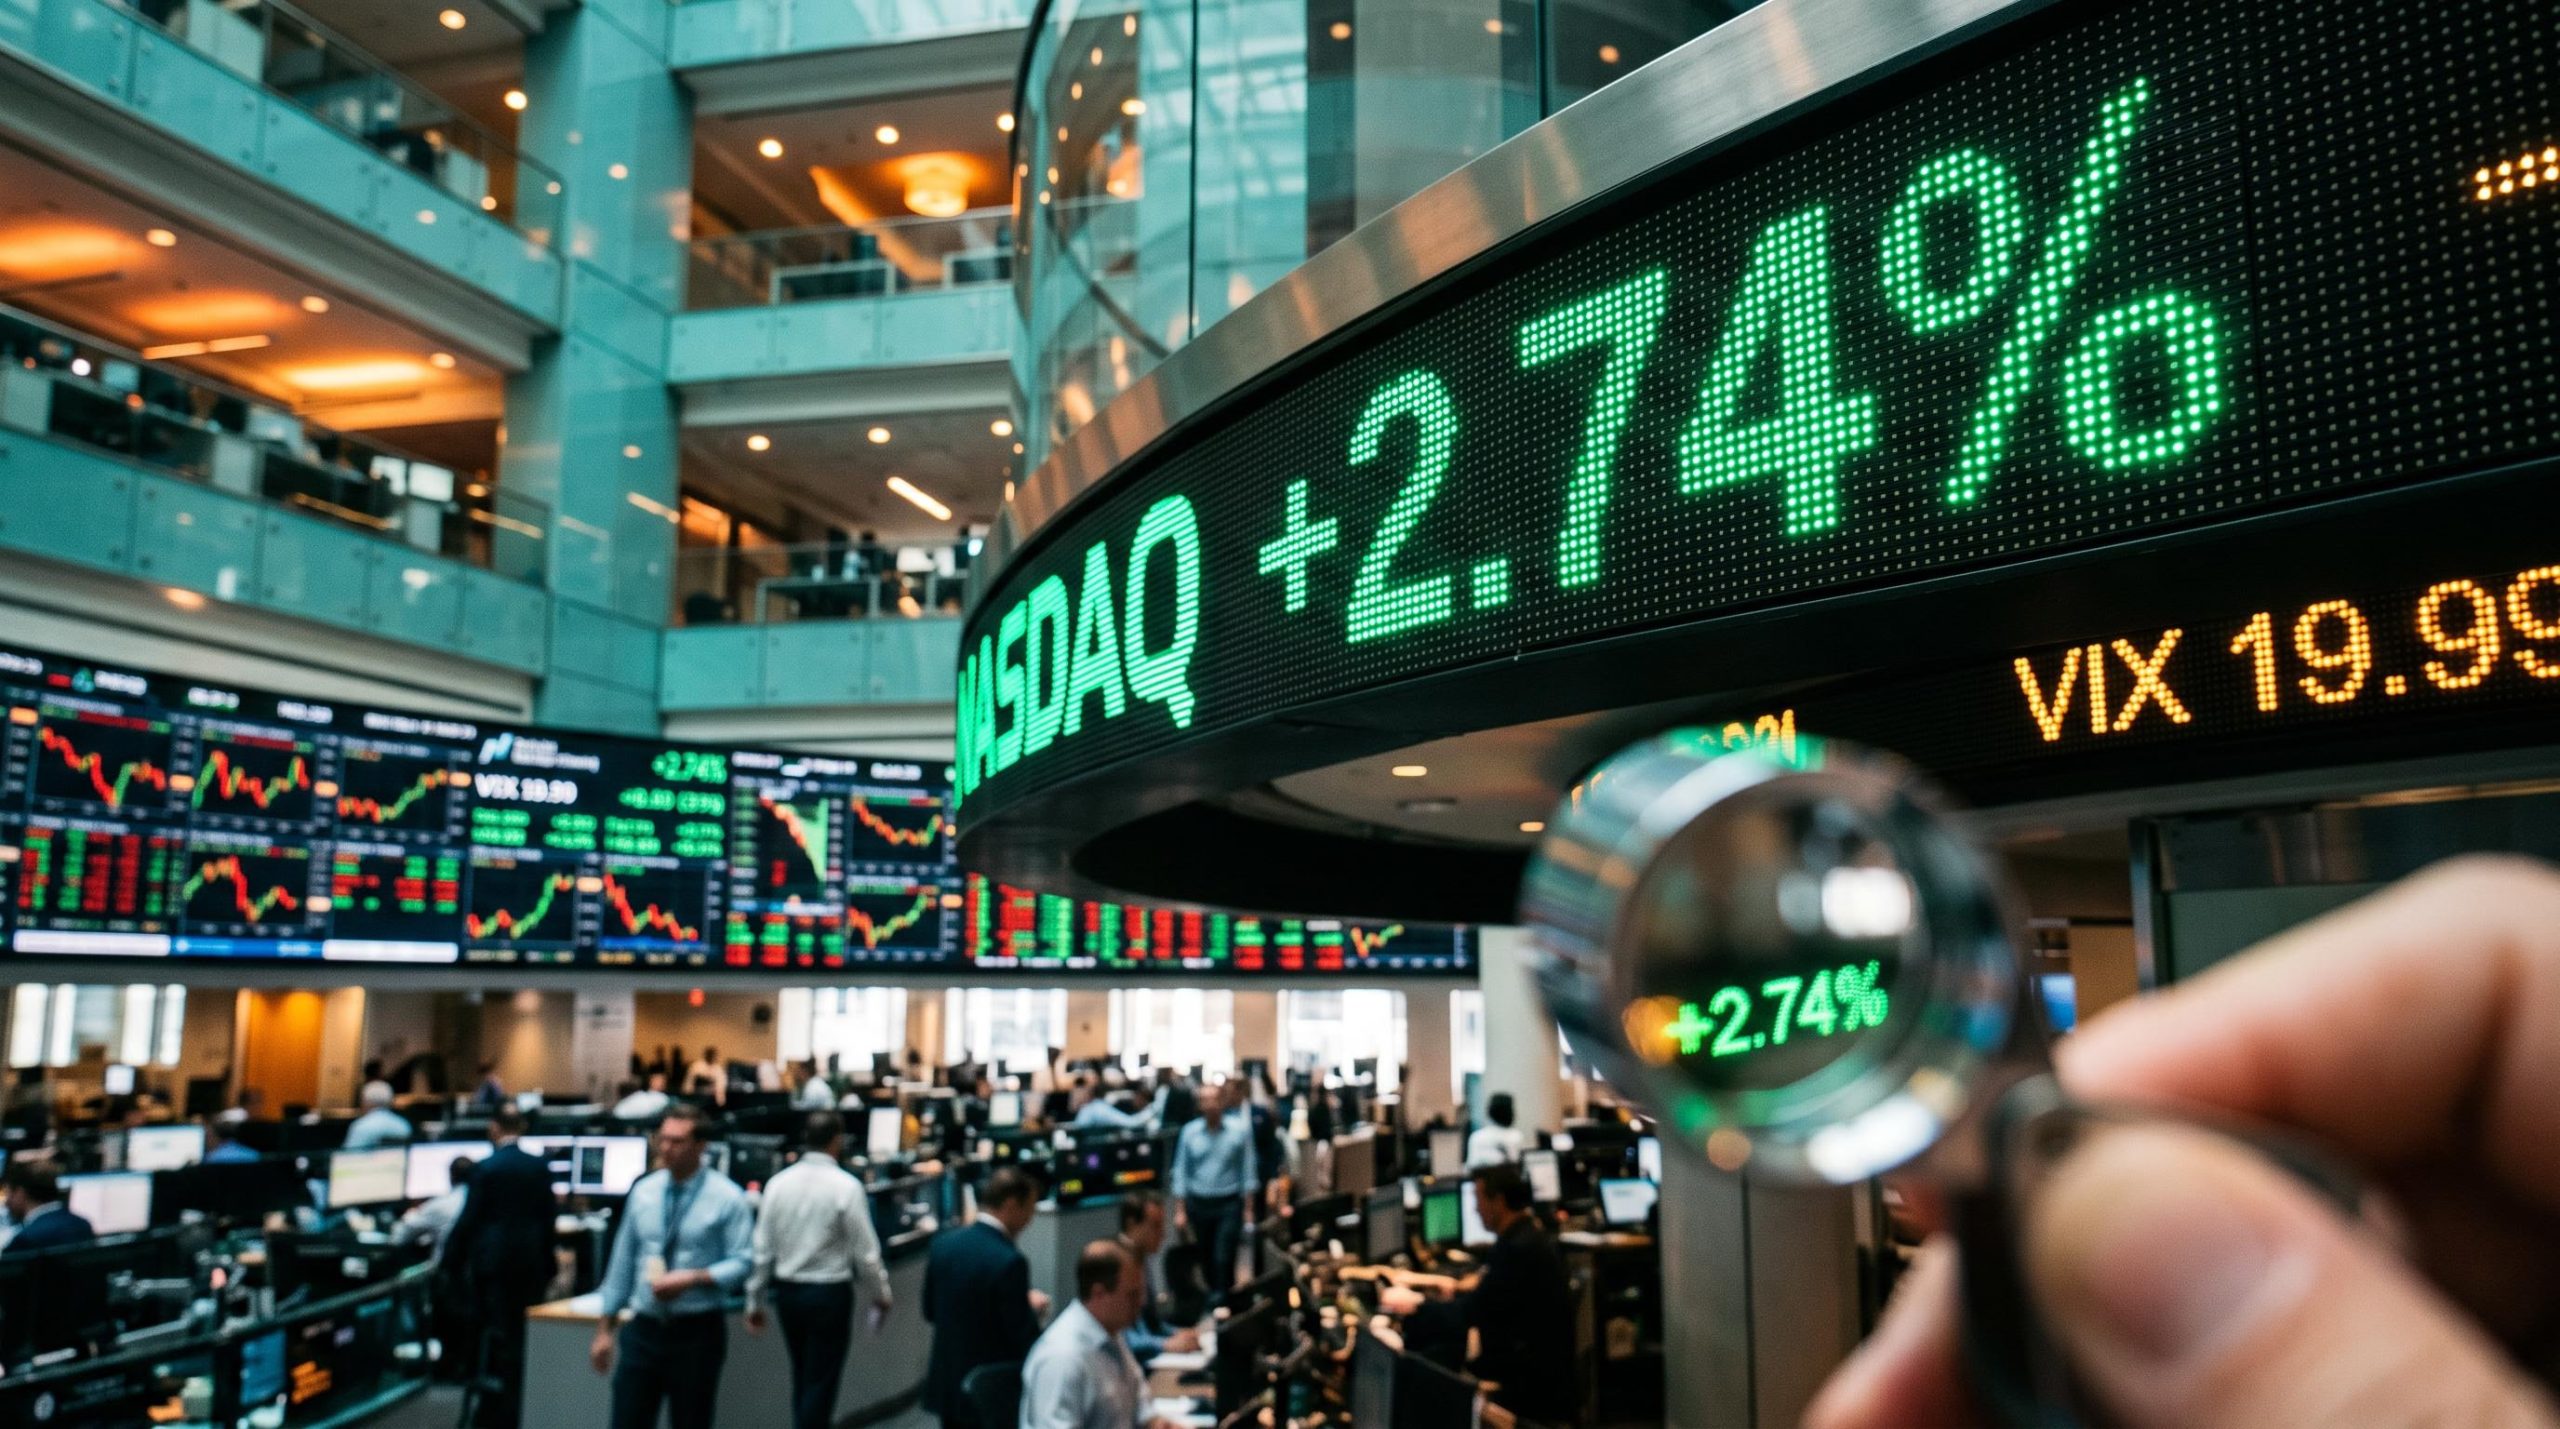
The Nasdaq Composite jumped 2.74% on Monday, its best session since April. Two trading days earlier, it suffered its worst day in 19 months, a 5.5% fall that pushed it into correction territory.
A rebound that large feels like an all-clear, but the arithmetic says otherwise. Getting back a 5.5% loss takes more than a 2.74% gain.
The same session carried warning signs alongside the relief. Nvidia fell while most chipmakers rallied, because its board had opened an independent investigation involving its chief executive. Citi also chose Monday to cut US equities and global technology to Neutral.
This piece shows you how to tell a tradable snapback from a durable recovery using three signals: breadth, the VIX and positioning. It also explains why AMD and Nvidia moved in opposite directions on the same day, and why that split matters if you hold the sector.
How big was the snap back, and what did the numbers actually show?
The rebound came in three stages, and each one told a different story.
On Thursday 5 November, the Nasdaq dropped 5.5% and entered correction territory, meaning it closed more than 10% below its 6 October record. Every S&P 500 sector fell. Decliners outnumbered advancers 6.1 to 1, and the VIX, Wall Street’s gauge of expected volatility, jumped 11.57 points to 28.18.
Friday brought a bounce, but a lopsided one. The Nasdaq rose 1.09% while the Dow slipped 0.46%, so buyers went back into beaten-down tech without much conviction anywhere else.
Monday was different, as the table shows.
| Index | Nov 6 close | Nov 6 move | Nov 9 close | Nov 9 move |
|---|---|---|---|---|
| Nasdaq Composite | 24,579.43 | +1.09% | 25,253 | +2.74% |
| S&P 500 | 7,376.86 | +0.31% | ~7,550 (approx.) | +2.35% to +2.42% |
| Dow Jones | 51,285.73 | -0.46% | 52,390 | +2.15% |
| Russell 2000 | 2,754.11 | +0.89% | 2,843 | +3.22% |
Reports on Monday’s S&P 500 close differ slightly, so treat that figure as approximate. Industrials led with 3.78%, followed by Consumer Discretionary at 3.05% and Information Technology at 2.87%. Copper climbed to US$6.36, recovering from a 17-week low, and the 10-year Treasury yield held near 4.86%.
The breadth on Monday is the real change from Friday. The Nasdaq still sits below its 6 October record, however, so you should read Monday’s headline as relief. It does not prove the selloff is over.
When big ASX news breaks, our subscribers know first
Why did AMD surge while Nvidia fell?
The semiconductor rally looked like one trade, but two separate stories sat inside it. The iShares Semiconductor ETF (SOXX) rose more than 7% after falling about 13% the week before, and Broadcom added roughly 9%. That recovery came after a 5 November rout in which the Philadelphia Semiconductor Index fell about 12%, Nvidia 9% and AMD 17%.
- AMD: analyst upgrade, 9 November, shares up 12-13%
- Nvidia: board investigation announced 8 November, shares closed down 4.2% after an intraday low of -8.7%
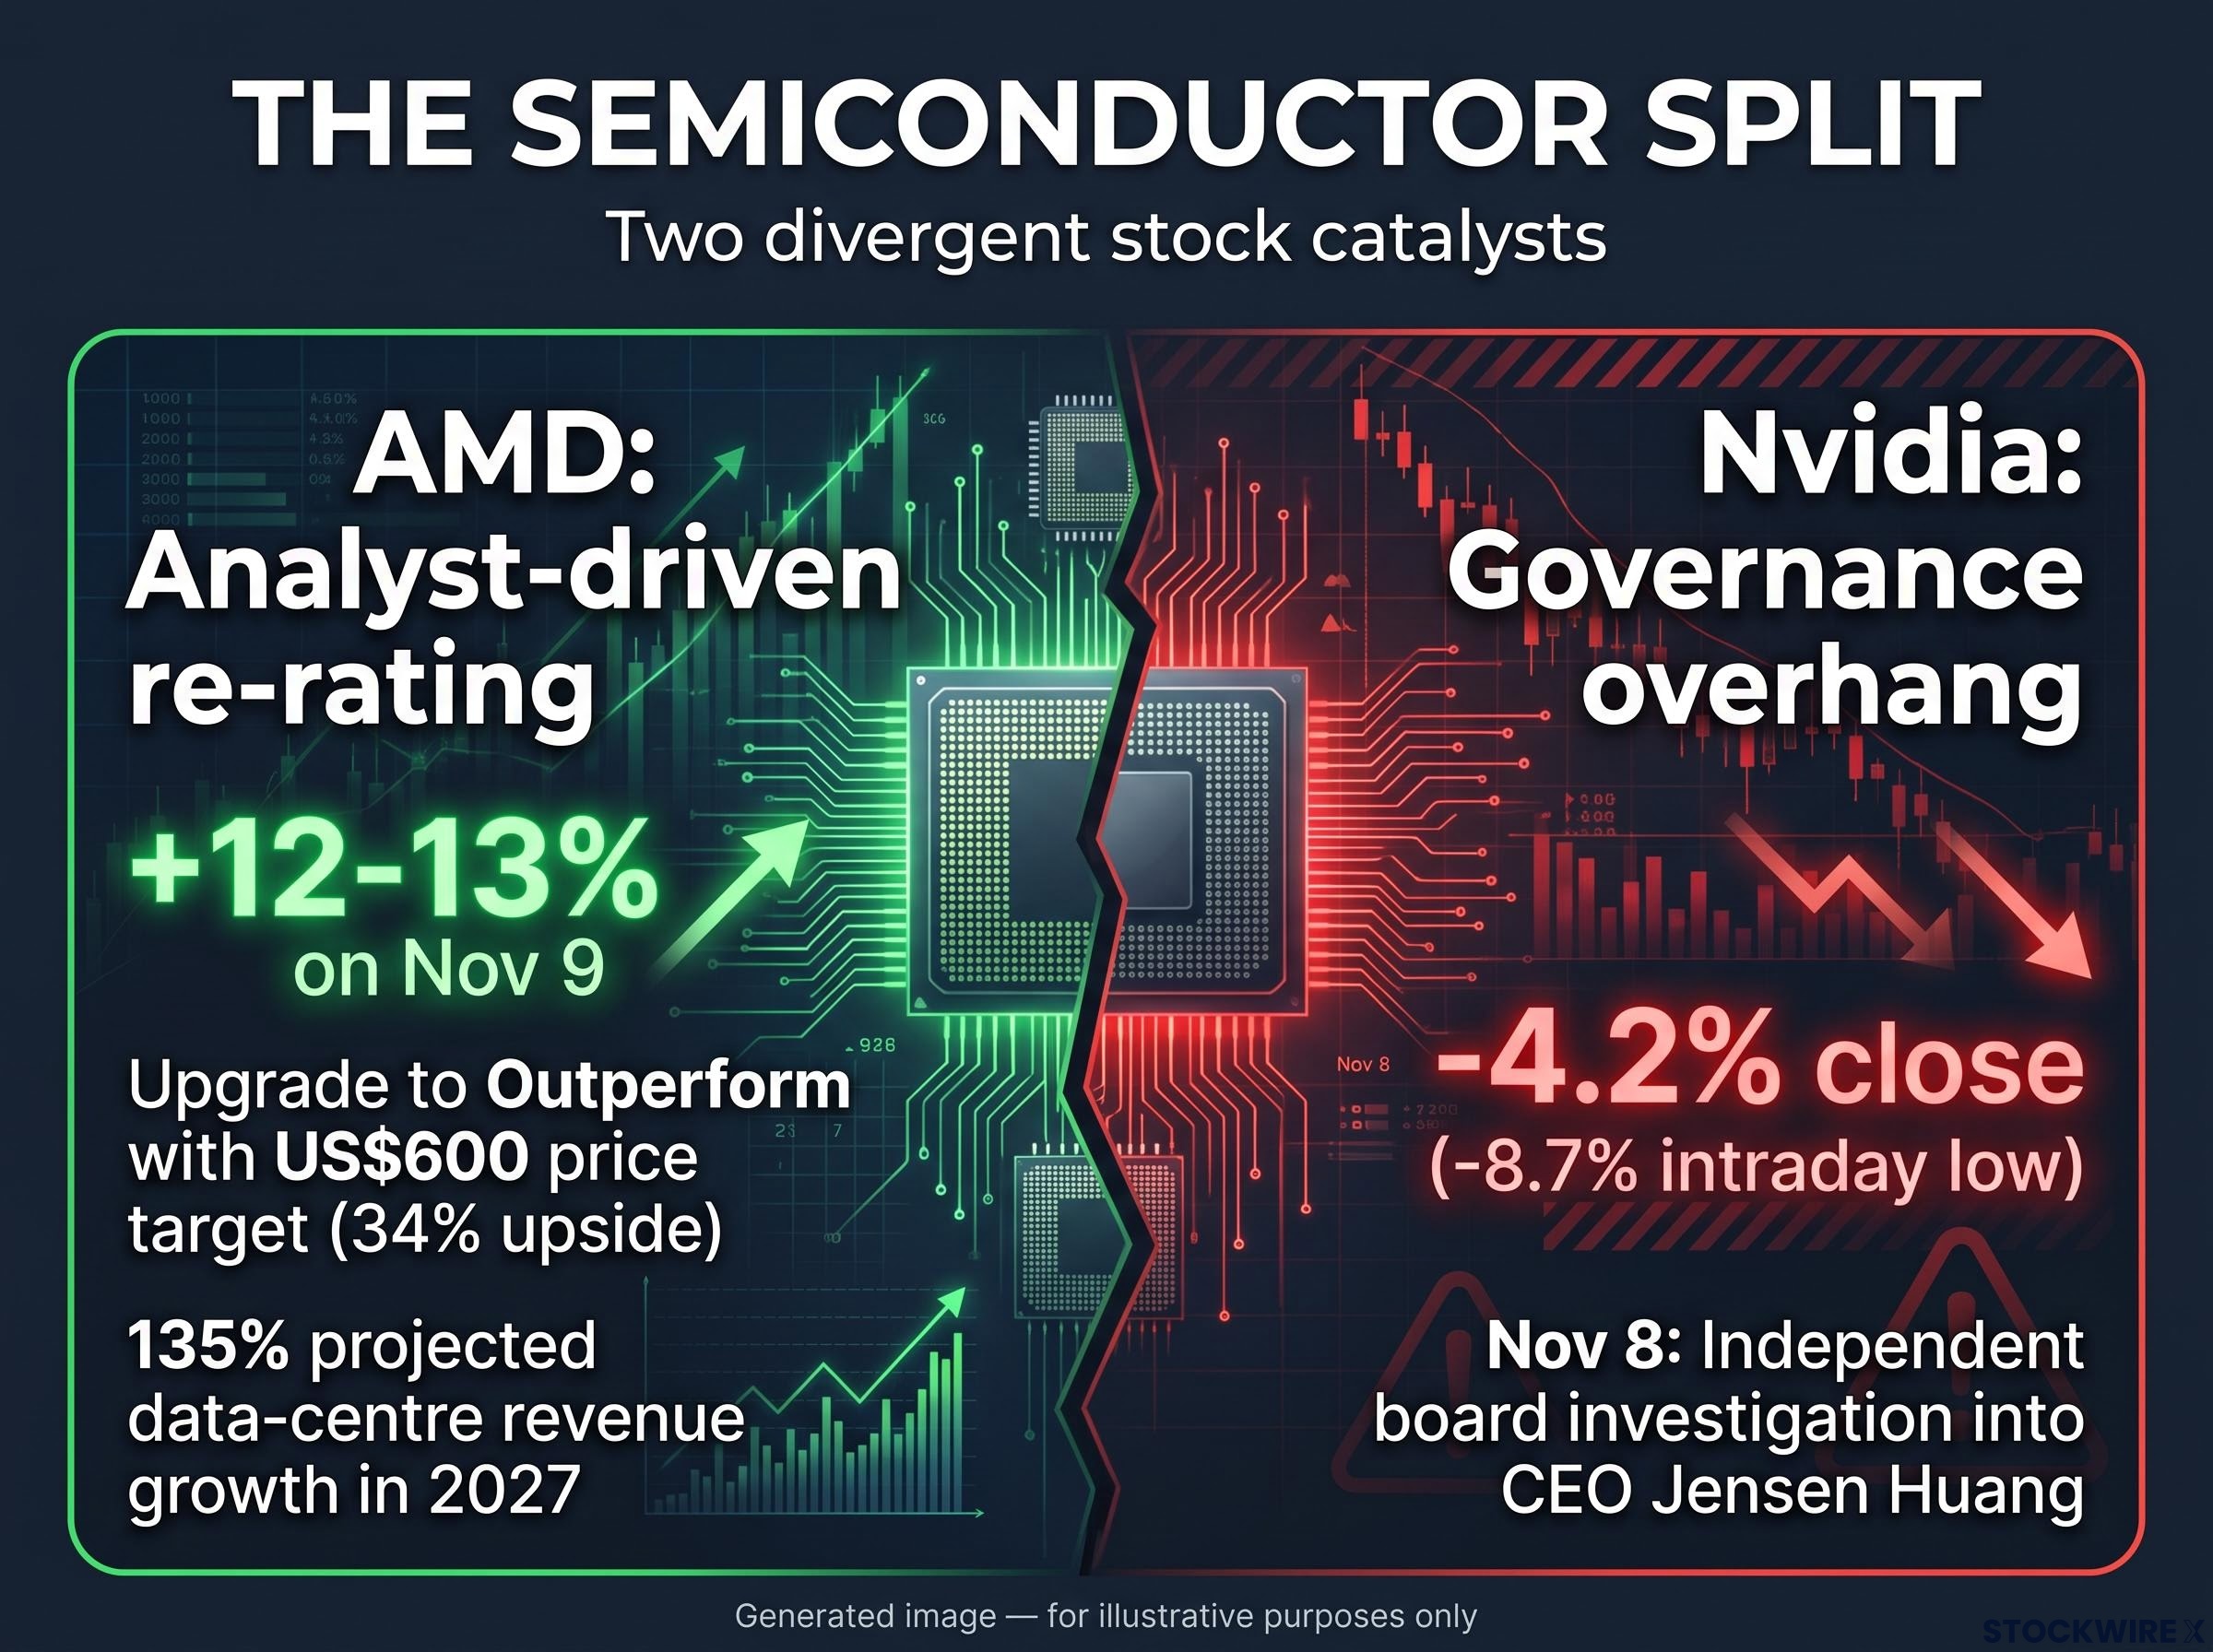
AMD shares surged 12-13% on an analyst upgrade to a US$600 target, while Nvidia dropped to a 4.2% lower close following news of a board investigation.
AMD: an analyst-driven re-rating
Oppenheimer’s Rick Schafer upgraded AMD from Perform to Outperform with a US$600 price target, which implies about 34% upside from the 6 November close. His argument is that AMD is becoming a lasting supplier of AI computing. He points to customer wins spanning several product generations, its Helios rack-scale systems, the release schedule for its Instinct chips and progress on its open software stack.
According to CNBC and secondary summaries, Schafer projects data-centre revenue growth of 135% in 2027. He also expects data centres to make up about 85% of sales, with roughly 3 GW of computing capacity in 2027 rising to 4 GW in 2028. The original note was not publicly accessible, so these figures are as reported.
Nvidia: a governance overhang
On 8 November, Nvidia’s board announced an independent investigation after reports that co-founder and CEO Jensen Huang had been the target of a “foreign intelligence effort”. The board said it has no reason to believe national security or company secrets were compromised. Huang remains CEO.
Dan Ives, Yorkville Ives & Co. Ives described the episode as a “black eye” for Huang and expects congressional inquiries, which he sees weighing on the stock for some time.
Congressional interest is Ives’s expectation, not a confirmed development. Elsewhere among the megacaps, Tesla gained 5.5%, Amazon 3% and Alphabet about 1%.
The split shows that sector-wide AI demand and single-stock risk can move independently. If you treat “chipmakers” as one position, an index-level rally can hide a problem in your largest holding.
End-market exposure explains much of this divergence: AMD and Broadcom ride different parts of the AI capex wave, while handset-focused names such as Qualcomm have contracted in the same quarter.
Why is Citi cutting US tech after the bounce, and who disagrees?
A downgrade on the best day since April looks odd. Citi’s reasoning is that the rally does not fix the problems that caused the selloff.
Strategist Beata Manthey cut US equities and global technology from Overweight to Neutral and raised continental Europe ex-UK to Overweight. She warned that Nasdaq positioning could swing to net-short, which means more money betting on falls than on gains. Citi remains constructive on technology over the long term but sees poor near-term risk-reward.
The pressures behind last week’s slide have not gone away:
- Doubts about whether heavy AI spending will pay off quickly enough.
- Policy risk around data-centre construction, energy use and financing.
- Index concentration in a handful of megacap AI names.
- Rates staying higher for longer after a strong jobs report.
- Forced selling as stop-losses triggered and funds cut risk.
Oil adds to the pressure. The Iran war has stalled Gulf dealmaking, with M&A falling to about US$5bn in Q3 from US$69bn a year earlier.
Strategists are divided on what comes next.
| Strategist | Firm | Stance | Key reason |
|---|---|---|---|
| Jay Hatfield | Infrastructure Capital Advisors | Neutral | Selloff overdone, but S&P 500 likely rangebound to year-end |
| John Stoltzfus | Oppenheimer | Constructive | If profits hold, markets can exceed prior levels |
| Chris Senyek | Not specified | Cautious | S&P 500 only slightly above its 200-day average |
| Beata Manthey | Citi | Defensive | Positioning may not have reset |
Goldman’s William Marshall offers a conditional, more constructive read on rates. He expects the 10-year yield to settle in a 4.75-5.0% range if risk-asset volatility fades and energy relief persists. Past performance does not guarantee future results, and projections like these depend on market conditions.
These are informed views that genuinely conflict: one camp sees a valuation reset, the other the start of an AI-trade unwind. You should treat the rebound as a move you could trade, with risk still unresolved, rather than as a signal in either direction.
How can you tell whether a rebound will last? Breadth, the VIX and positioning
You do not need a forecast to judge a bounce. Three signals cover most of it, and this week’s numbers show how each one works. This is general market education, not a recommendation.
| Signal | Nov 5 | Nov 6 | Nov 9 | What a durable rebound looks like |
|---|---|---|---|---|
| Breadth | Decliners 6.1 to 1 | Uneven, Dow lower | Advancers 3 to 1+ | Broad participation across sectors |
| VIX | 28.18 | 25.64 | 19.99 | Falling and staying low |
| Russell 2000 | Lower | +0.89% | +3.22% | Small caps confirming |
Breadth
Breadth measures how many stocks join a move. Advancers are stocks that closed higher and decliners are stocks that closed lower. On 5 November, decliners led 6.1 to 1 and every sector fell. On 9 November, advancers led by more than 3 to 1 and nearly every sector rose. A rally that most stocks join is more likely to last than one carried by a few names.
Market breadth indicators such as the RSP/SPY ratio, net volume and the advance-decline line often disagree with the headline index, which is why a single strong session can overstate how healthy a rebound really is.
VIX
The VIX measures implied volatility, which is the size of the price swings options traders expect over the next 30 days. It fell from 28.18 to 25.64 to 19.99, including a 22.04% drop on Monday.
A falling VIX suggests forced selling is easing. On its own, it confirms only that fear has cooled. It is more convincing when broad advances and stable yields come with it, as they did this week.
Positioning and confirmation
Positioning tracks how heavily traders lean one way, using futures, options and broker data. When short bets are crowded, the traders holding them have to buy back shares to close out, and that buying can force prices sharply higher. When long bets are crowded, the risk is a further wave of selling.
Citi’s net-short warning is a reminder that a squeeze can create a rally that fades once the covering stops. Small caps help here: the Russell 2000 outperformed on both days. Be careful if the rebound is led by the same names that drove the selloff, because that can make breadth look stronger than it is.
On this test, you have two signals passing. Positioning is still unproven.
What to watch after the Nasdaq rebound: a short checklist for the weeks ahead
The evidence points to a tradable snapback with far better breadth than Friday’s. It is not yet a confirmed reversal. These are the signals worth tracking:
- The 10-year yield, now about 4.86%, compared with Goldman’s 4.75-5.0% range
- Whether the VIX holds near 19.99 or climbs back towards its recent highs
- How the S&P 500 behaves around its 200-day moving average
- Developments in the Nvidia investigation
- Oil prices and news on the Iran war
The Nasdaq, at 25,253, still has ground to recover before it reaches its 6 October record. Let a sustained shift in two or three of these signals change your view, rather than any single day’s headline, and size your positions to your own risk tolerance.
For readers wanting an earlier case study, our deep-dive into the August tech bounce shows chip stocks recovering only about 10% of their drawdown.
This article is for informational purposes only and should not be considered financial advice. Investors should conduct their own research and consult with financial professionals before making investment decisions.