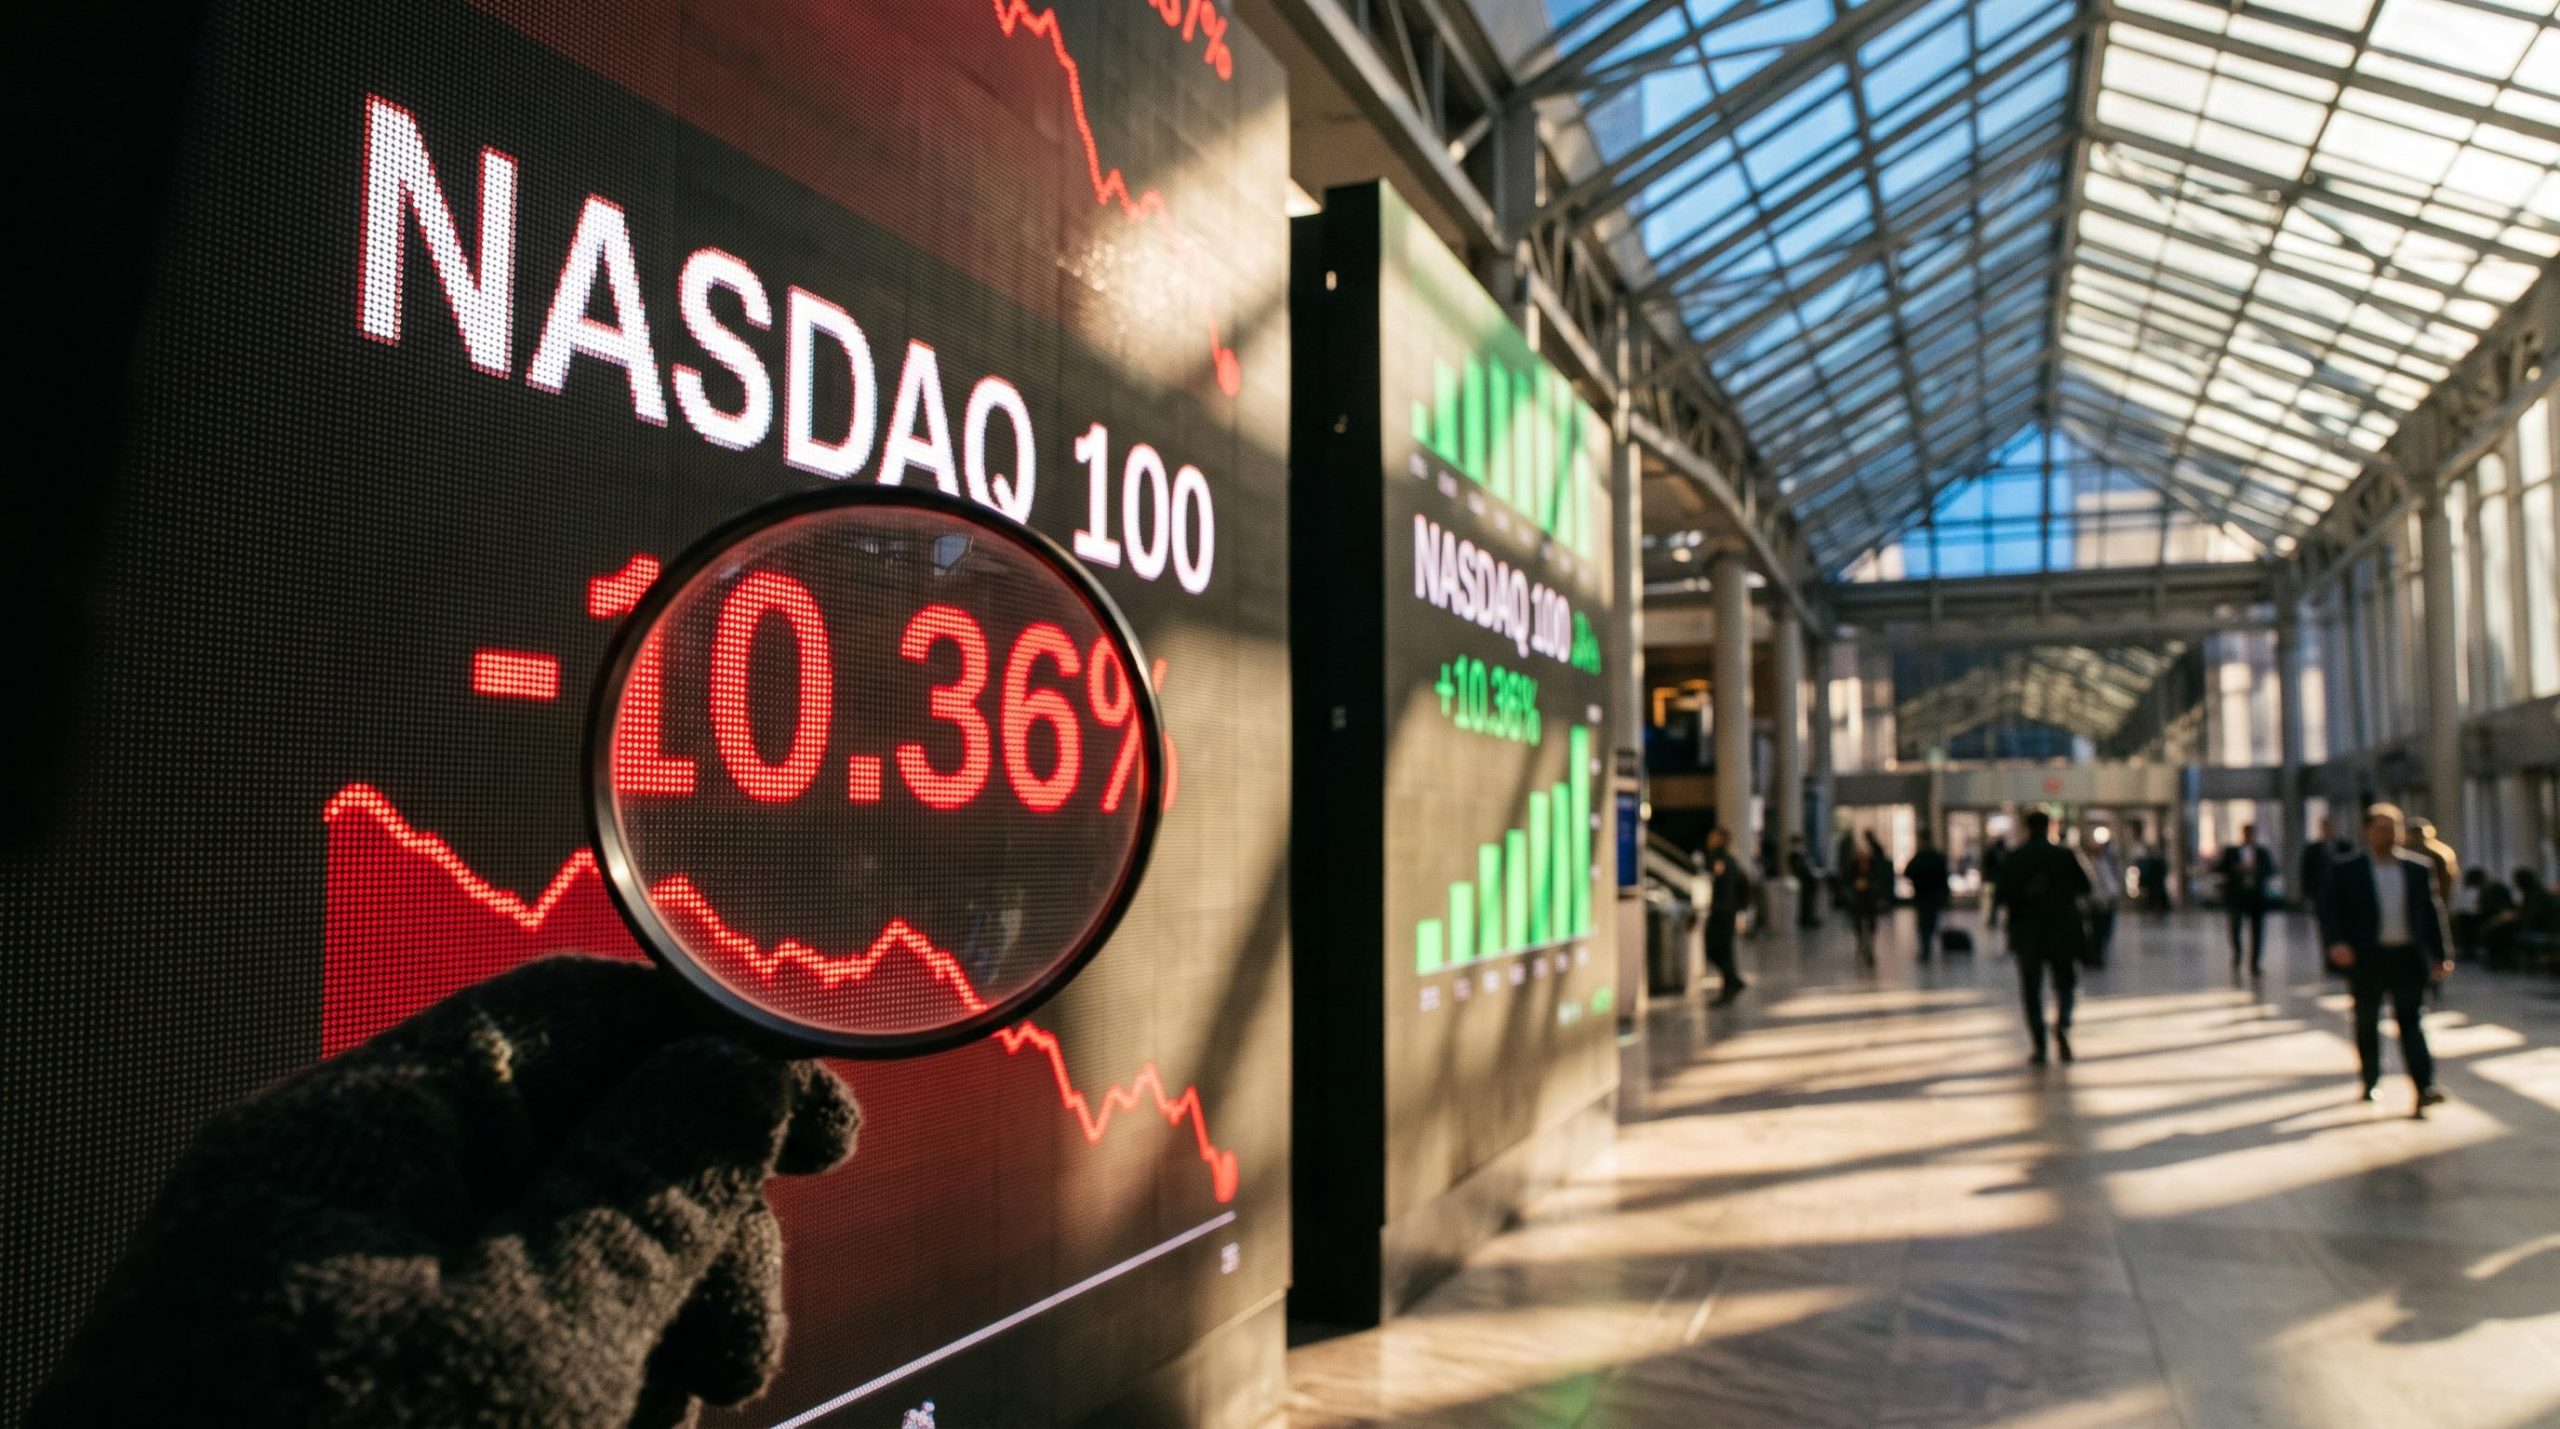
The Nasdaq 100 finished 2 November 2026 in correction territory, 10.36% below its 6 October peak. On the same day, more than two-thirds of the stocks in the S&P 500 rose. If you read only the headline, you could easily mistake a selloff in a handful of giants for a verdict on the whole market.
The session was busy. The Nasdaq 100 fell 1.39% to 27,989.82, while the equal-weighted S&P 500 gained 0.73%. The day sat between two catalysts: Apple reporting results after the close, and US midterm elections on 3 November.
That combination makes yesterday a useful case study. The way the indexes split apart shows how much a few companies now steer the headline numbers.
Here is how to read a single session through three lenses: index concentration, breadth gauges and earnings guidance. Each tells you something different about where the risk in your portfolio actually sits.
Why did the Nasdaq 100 fall into correction while most stocks rose?
The screen told two stories at once. US stocks opened higher on calmer geopolitical worries and a firm reading from the Institute for Supply Management’s (ISM) manufacturing survey. That survey tracks factory activity each month. At its best, the S&P 500 was up 1.08% intraday.
Then chipmakers turned. The Philadelphia Semiconductor Index slid through the afternoon and closed down 3.37%. That reversal erased the S&P 500’s gain and pushed the Nasdaq 100 past the threshold for a correction, which is a fall of at least 10% from a recent peak.
| Measure | Move | Level or note |
|---|---|---|
| S&P 500 | -0.5% | Up as much as 1.08% intraday |
| Nasdaq 100 | -1.39% | 27,989.82, 10.36% below the 6 October peak of 31,224.47 |
| Philadelphia Semiconductor Index | -3.37% | Kept sliding through the session |
| Equal-weighted S&P 500 | +0.73% | Rose despite the tech selloff |
| S&P 500 stocks advancing | More than two-thirds | Broad participation beneath a negative headline |
The cause was a question about money. Bloomberg framed the concern as whether Big Tech’s vast infrastructure commitments will earn back what they cost. Steve Sosnick, chief strategist at Interactive Brokers, put it in terms of debt.
Steve Sosnick, Interactive Brokers Investors are questioning their assumptions about AI, specifically whether the borrowing behind data-centre and infrastructure buildouts will produce returns big enough to repay it.
Deutsche Bank’s Jim Reid noted that this repeats a recent pattern, in which tech losses mask resilience elsewhere. He had flagged the same split in the prior day’s October review.
The lesson is simple. A headline index tells you where the largest weights went, not how the typical stock fared, so treat “correction” as a statement about concentration first.
US index fund concentration now exceeds the 1930s peak, with five mega-caps holding roughly 23% of the broad market, so a single weak session in a few names can dominate a passive investor’s result.
When big ASX news breaks, our subscribers know first
How do cap-weighted and equal-weighted indexes tell different stories?
The split comes down to weighting. A cap-weighted index sizes each company by its market capitalisation, which is the total value of its shares. The biggest companies therefore dominate the result.
An equal-weighted index holds the same stocks but treats them alike. According to S&P Dow Jones Indices, each constituent in the equal-weight S&P 500 is set at about 0.2% at each quarterly rebalancing. Rebalancing means resetting the weights back to equal.
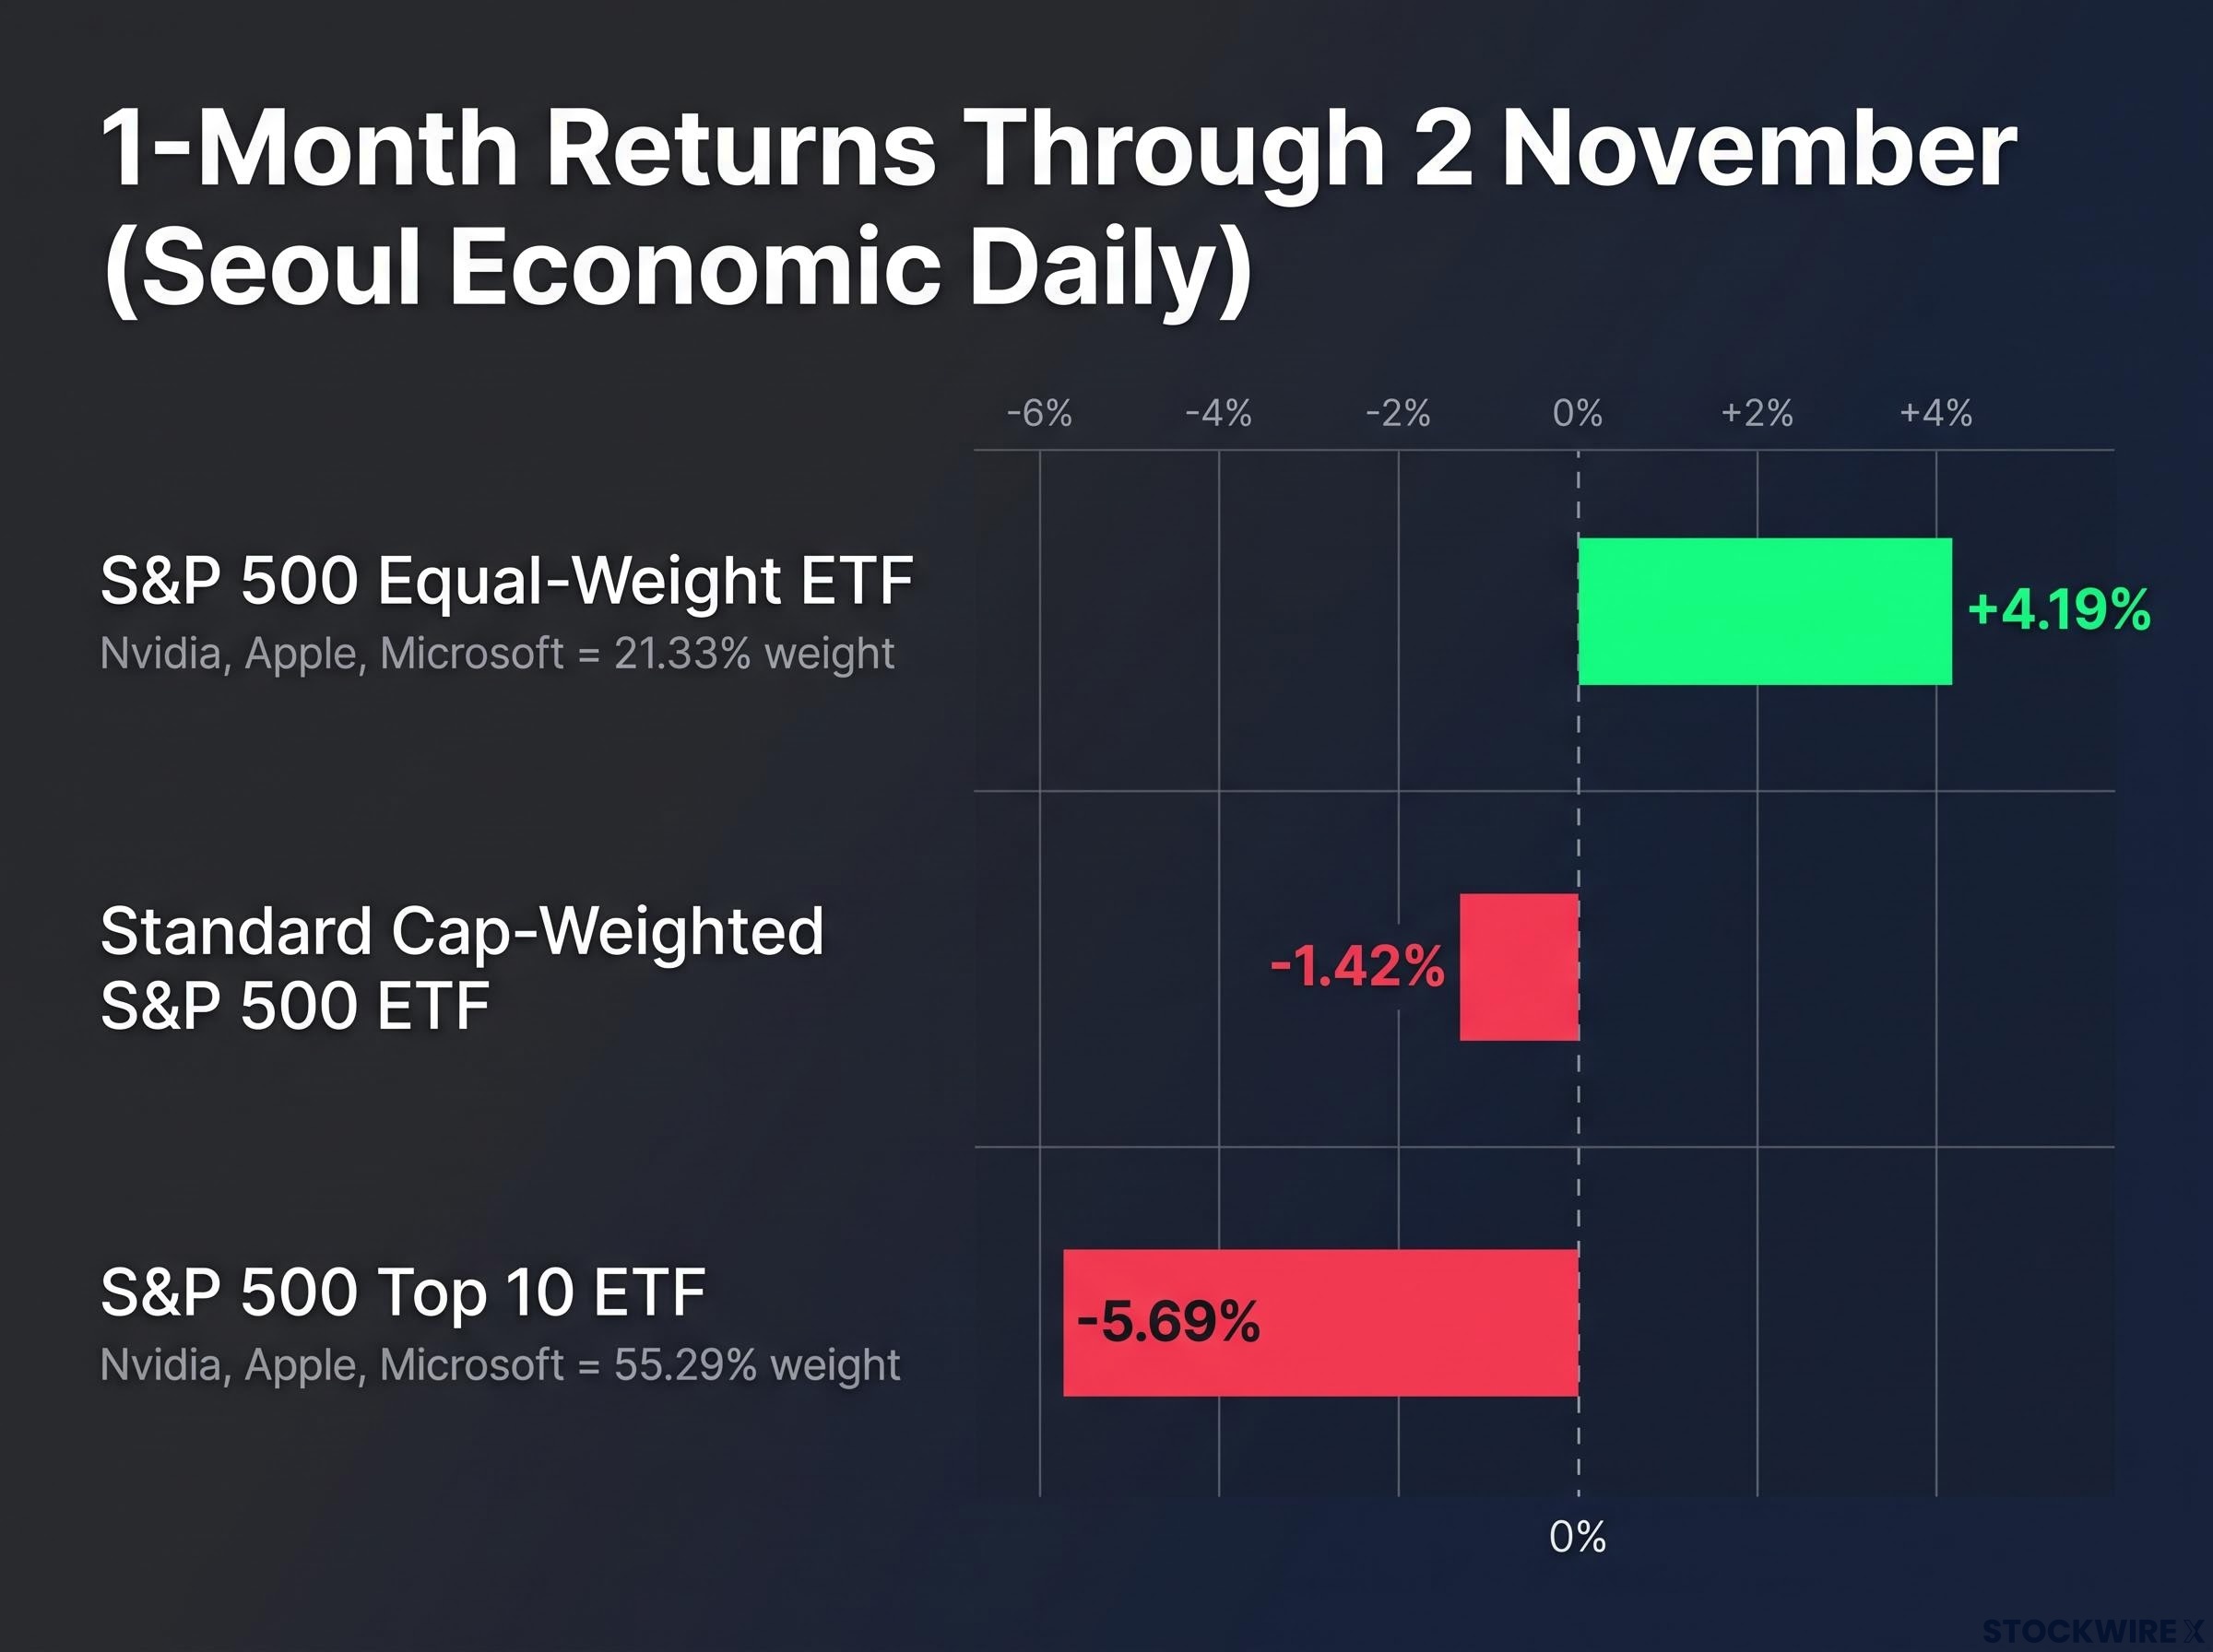
The one-month numbers show how large that difference can become. Here are figures for the month through 2 November, reported by the Seoul Economic Daily.
| Vehicle | One-month return | Top 3 weight |
|---|---|---|
| S&P 500 equal-weight ETF | +4.19% | 21.33% (Nvidia, Apple, Microsoft) |
| Standard cap-weighted S&P 500 ETF | -1.42% | Not cited |
| S&P 500 Top 10 ETF | -5.69% | 55.29% (Nvidia, Apple, Microsoft) |
Equal weight beat the standard fund by 5.61 points and the Top 10 product by 9.88 points. Three names, Nvidia, Apple and Microsoft, made up more than half of the Top 10 product. That alone explains much of the gap.
You should check which weighting your own fund uses. The same market day can show up as a loss or a gain depending on how much mega-cap tech you hold.
What equal-weighting does not tell you
Equal-weight returns are not a pure measure of breadth. The equal-weight index carries different sector and size exposures, and it needs regular rebalancing. It can also outperform simply because the largest stocks fall.
An authoritative 2026 year-to-date comparison was not available. For that reason, the monthly figures are the firmest evidence on hand.
Healthy rotation or fragile leadership: what does the breadth signal mean?
Breadth measures how many stocks take part in a move. Yesterday’s breadth was strong, but there are two credible readings of what it means.
The rotation reading
Morningstar’s weekly data point towards orderly movement rather than panic selling. Its US Core Cap Growth Index fell 1.9% for the week, while its US Core Cap Value Index rose 0.6%. Add the more-than-two-thirds advance on Monday, and the picture is one of money shifting into industrials, financials, healthcare and materials.
The fragile-leadership reading
The other view treats equal-weight strength as temporary cover while the heaviest stocks weaken. If the declines spread to credit markets, earnings expectations and smaller companies, the resilience would fade.
- Healthy rotation: Supported by Morningstar’s growth-versus-value split and broad advances. It would be confirmed if equal weight keeps leading while losses stay confined to semiconductors.
- Fragile leadership: Supported by the index weight of the falling names. It would be confirmed by weakness spreading to credit, earnings forecasts and small caps.
History does not settle the contest. In 2000, narrow tech leadership turned into a broad collapse. In 2021-22, equal-weight strength started as rotation but did not prevent a wider bear market. Through 2024, breadth kept improving under mega-cap leadership, and the debate never fully resolved.
The semiconductor slide itself has two framings. Goldman Sachs strategist George Privorotsky has described the AI trade as a “rubber band”, with the gap widening between the hyperscalers that spend the money and the hardware suppliers that receive it. Hyperscalers are the giant cloud operators. Deutsche Bank’s semiconductor research called the decline a reset after an AI-driven rally.
Analysts have pointed to an 18-24 month capex-to-revenue lag as the central risk in AI hardware, which helps explain why chip stocks run furthest ahead of proven returns and fall hardest when doubts surface.
Morgan Stanley’s Mike Wilson adds an important detail. About 60% of Russell 3000 stocks have already suffered a correction of at least 20% since June.
A 5.61-point monthly edge for equal weight is evidence of broadening, not proof the correction is over. Watch whether weakness spreads beyond chips.
What do Apple’s guidance and the midterm backdrop add to the picture?
Apple: the beat that did not matter
Apple’s fiscal fourth quarter, which ended 26 September 2026, beat on both sales and profit. The shares still fell about 2.8% after hours.
| Item | Reported | Expected |
|---|---|---|
| Revenue | $114.48bn | $113.39bn (LSEG) |
| Diluted EPS | $2.10 | $1.99 |
| September-quarter gross margin | 47.9% | Not cited |
| December-quarter margin guidance | 45%-46% | 46.3% (CNBC/LSEG) |
The guidance did the damage. Gross margin is the share of revenue left after the cost of making products. Apple attributed the expected squeeze mainly to higher memory costs and the expense of ramping its Siri AI capabilities. The September quarter also included about one point of non-recurring benefit from tariff refunds, and services guidance came in softer than analysts wanted.
Deutsche Bank used a benchmark of about 47% for the margin estimate, while CNBC cited 46.3%. Both show guidance below expectations. Read guidance, not the headline beat, as your signal of future earnings quality.
Asia and the election
Asian markets on 3 November absorbed Apple’s outlook and pre-election caution unevenly:
- KOSPI: -3.76%, the weakest in the region
- Hang Seng: +0.52%
- CSI 300: -0.08%
- Shanghai Composite: -0.71%
- Nikkei: Closed for Japan’s Culture Day holiday
China’s central bank, the People’s Bank of China (PBOC), restated its market support measures.
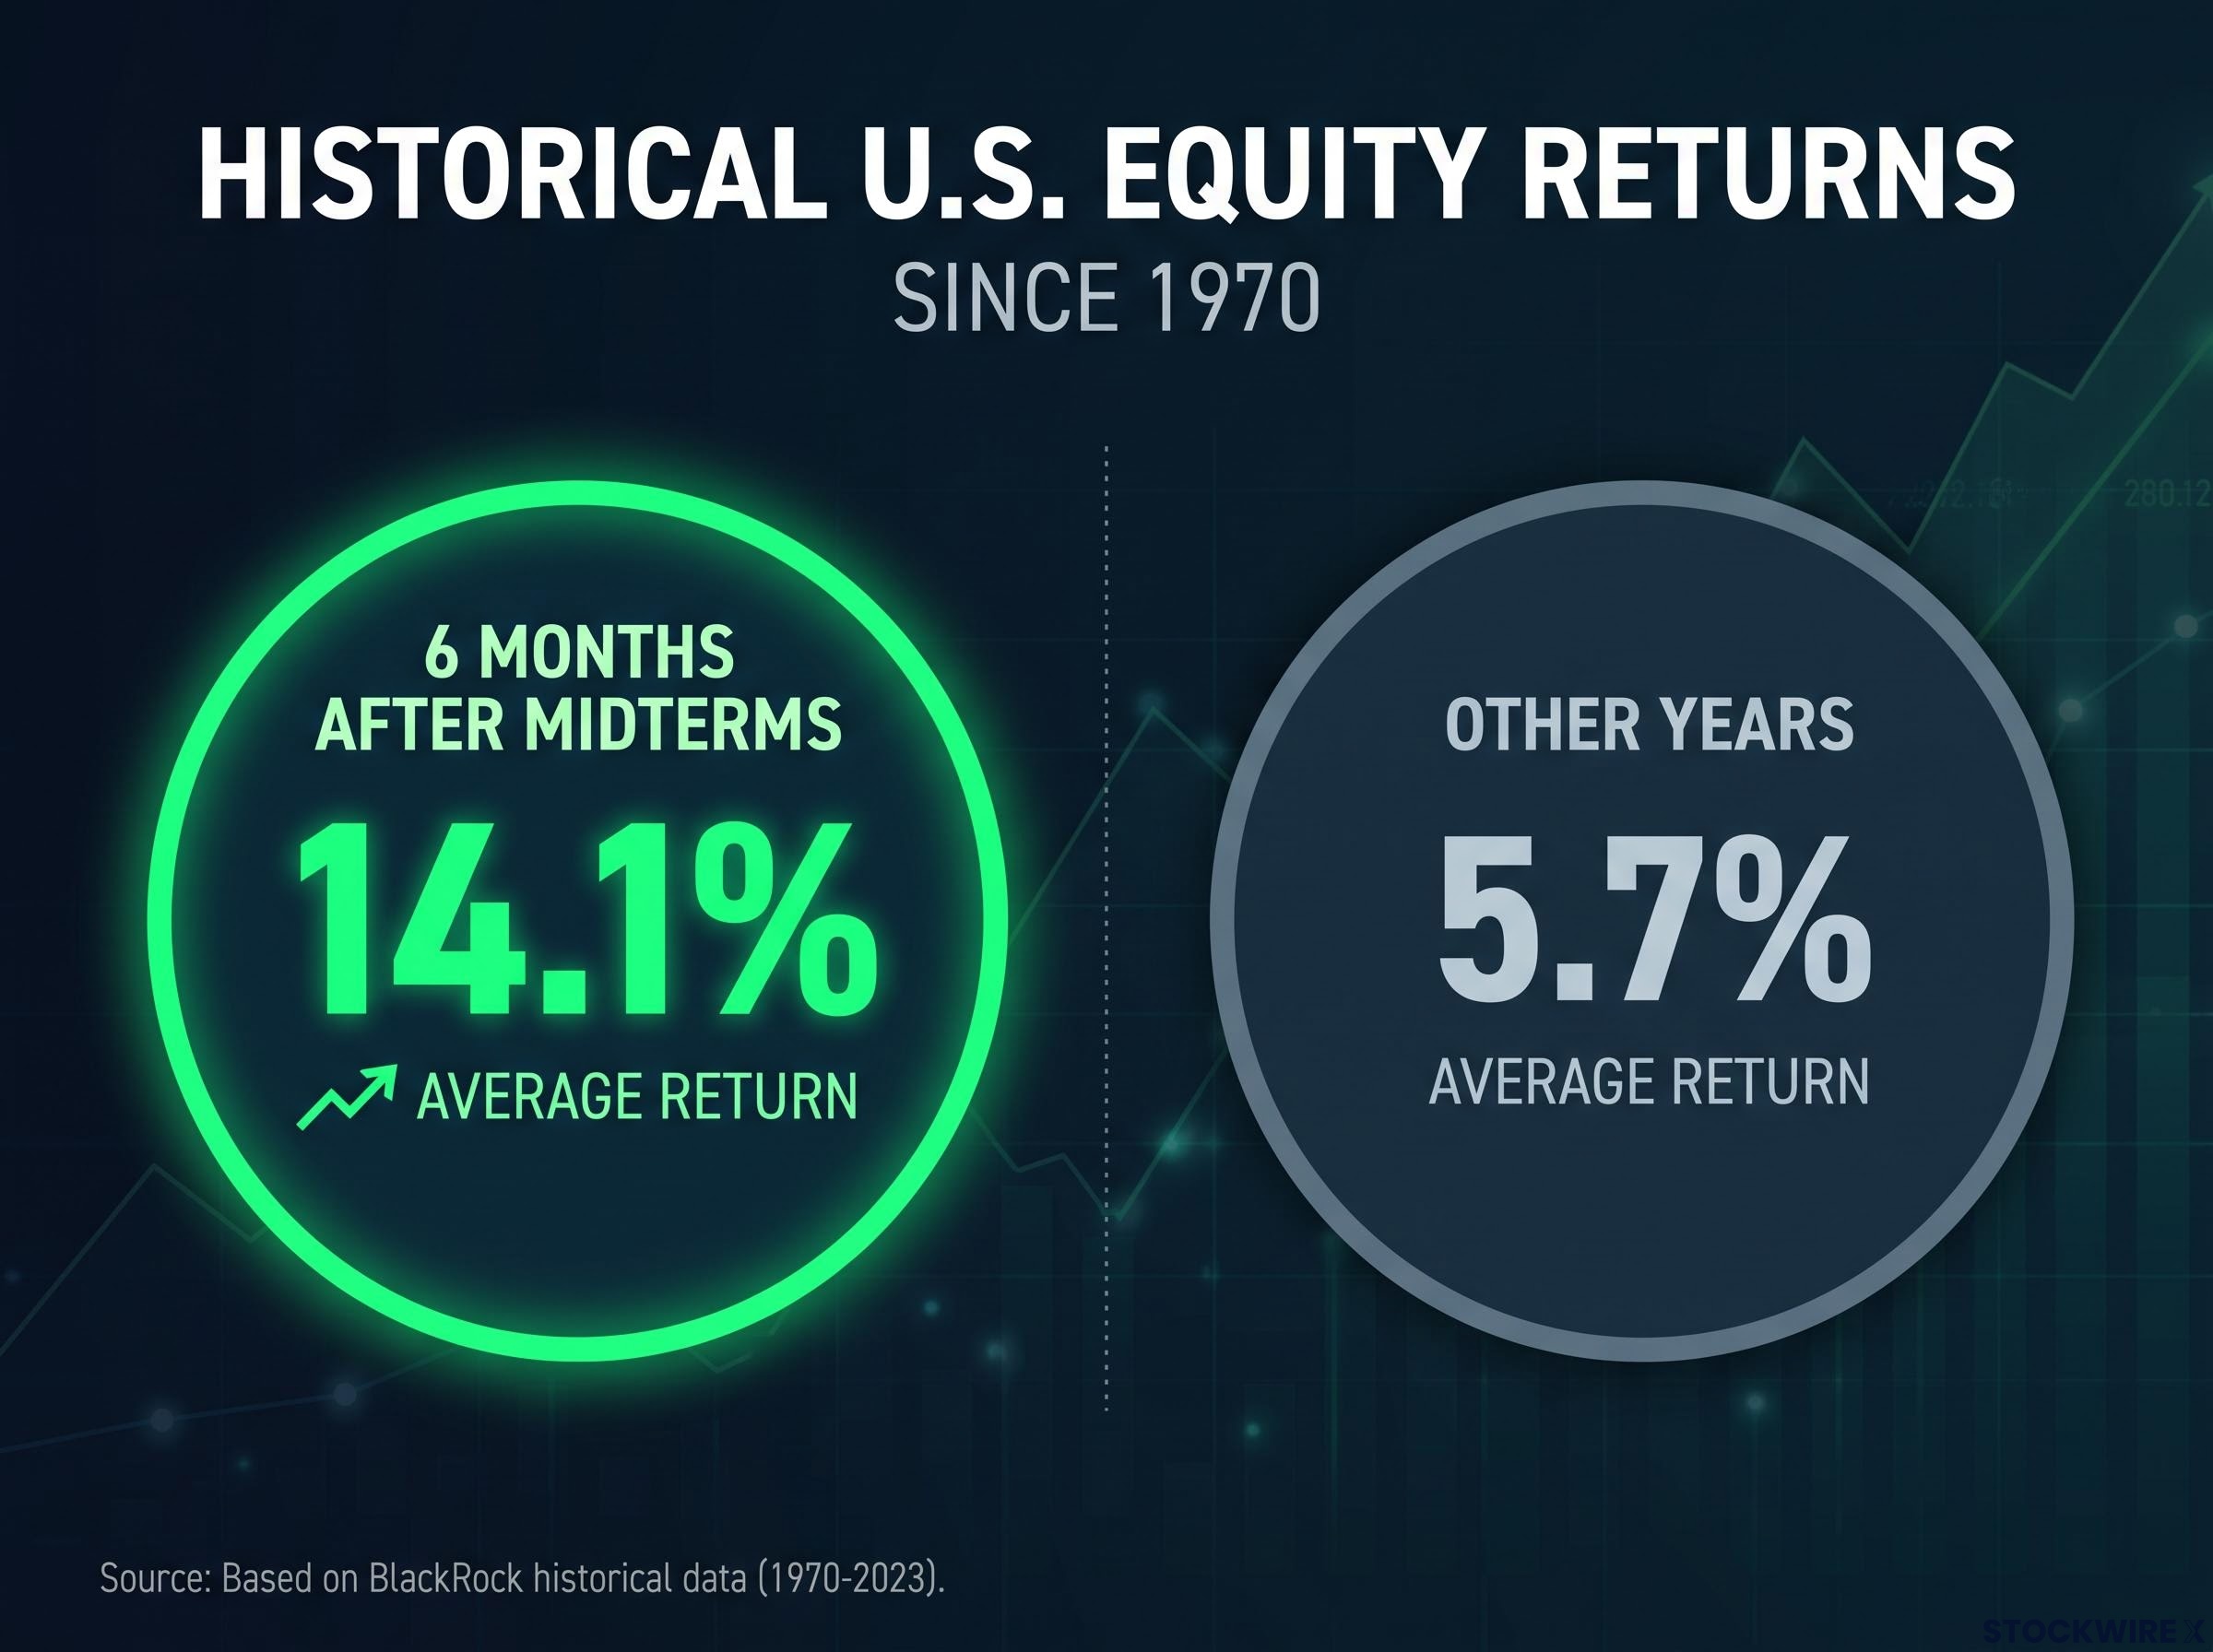
The midterms matter through three channels: broad policy, AI regulation and data-centre approvals, and investor positioning. History leans positive. BlackRock reports that since 1970, US equities have returned 14.1% on average in the six months after midterms, against 5.7% in other years.
Wilson calls this the “final innings” of the correction. The counterpoint is that an election removes political uncertainty, not the AI-spending question. Results were not yet known at the time of writing. Treat the vote as a possible end to one overhang, not the one driving chip stocks.
Three signals to watch as the correction plays out
The evidence points to a concentrated AI and semiconductor correction, not a broad collapse. Even so, continued weakness in Apple and other heavyweights could still turn rotation into something wider. Three markers will tell you which way it is breaking:
- Breadth: Whether equal weight and the advance-decline picture keep holding up.
- AI spending returns: Whether semiconductor and hyperscaler news keeps disappointing on returns and costs.
- The midterm reaction: How markets trade once the results are confirmed.
Your decision point is simple: measure your exposure by weight, not by headline, and let these signals rather than a single session shape your view.
Historical dip-buying odds differ sharply by cause: non-crisis Nasdaq pullbacks were positive after three months about 80% of the time, versus under 46% inside crises, which is why the crisis-or-correction label matters.
This article is for informational purposes only and should not be considered financial advice. Investors should conduct their own research and consult with financial professionals before making investment decisions.
Past performance does not guarantee future results. Financial projections are subject to market conditions and various risk factors.