
Put $10,000 into National Australia Bank today and two very different outcomes stare back at you, depending on which analyst consensus you trust. One set of broker data points to a position worth only around $9,700 after twelve months, representing a net shortfall of roughly $300. Another suggests you finish slightly ahead, around $10,430. The gap between those two numbers is not a rounding error; it is a genuine disagreement among professional investors about where one of Australia’s biggest banks is heading.
The question matters because NAB sits inside millions of Australian portfolios. It is a top-ten ASX holding by market capitalisation, its fully franked dividends make it a staple for income-focused investors, and the share price has pulled back from its mid-2020s highs into a range that invites fresh evaluation. Whether the current yield justifies entry depends entirely on what you expect from the capital side of the equation.
Here is the full picture: capital and income together, across the realistic range of outcomes, so you can make a properly informed assessment rather than reacting to a headline yield number in isolation.
What analysts actually think about NAB right now
The consensus on NAB is not a single number. It is a spread, and the shape of that spread tells you more than any average.
CMC Invest aggregated 10 analyst ratings across the prior twelve months, with the breakdown coming in at 2 buys, 4 holds, and 4 sells. The resulting average price target of $36.90 sits roughly 7% below where NAB was changing hands in mid-July 2026 at approximately $39.85.
Investing.com draws on a wider pool of 14 analysts and lands in a slightly different place: 3 buys, 6 holds, 5 sells, with an average target of $37.90. TradingView’s aggregation of 14 analysts produces an average near $37.72. Both are less bearish than CMC Invest, but neither is bullish.
| Data Source | Analysts | Buy / Hold / Sell | Avg. Target |
|---|---|---|---|
| CMC Invest | 10 | 2 / 4 / 4 | $36.90 |
| Investing.com | 14 | 3 / 6 / 5 | $37.90 |
| TradingView | 14 | Neutral consensus | $37.72 |
The individual broker positions show how wide the disagreement runs:
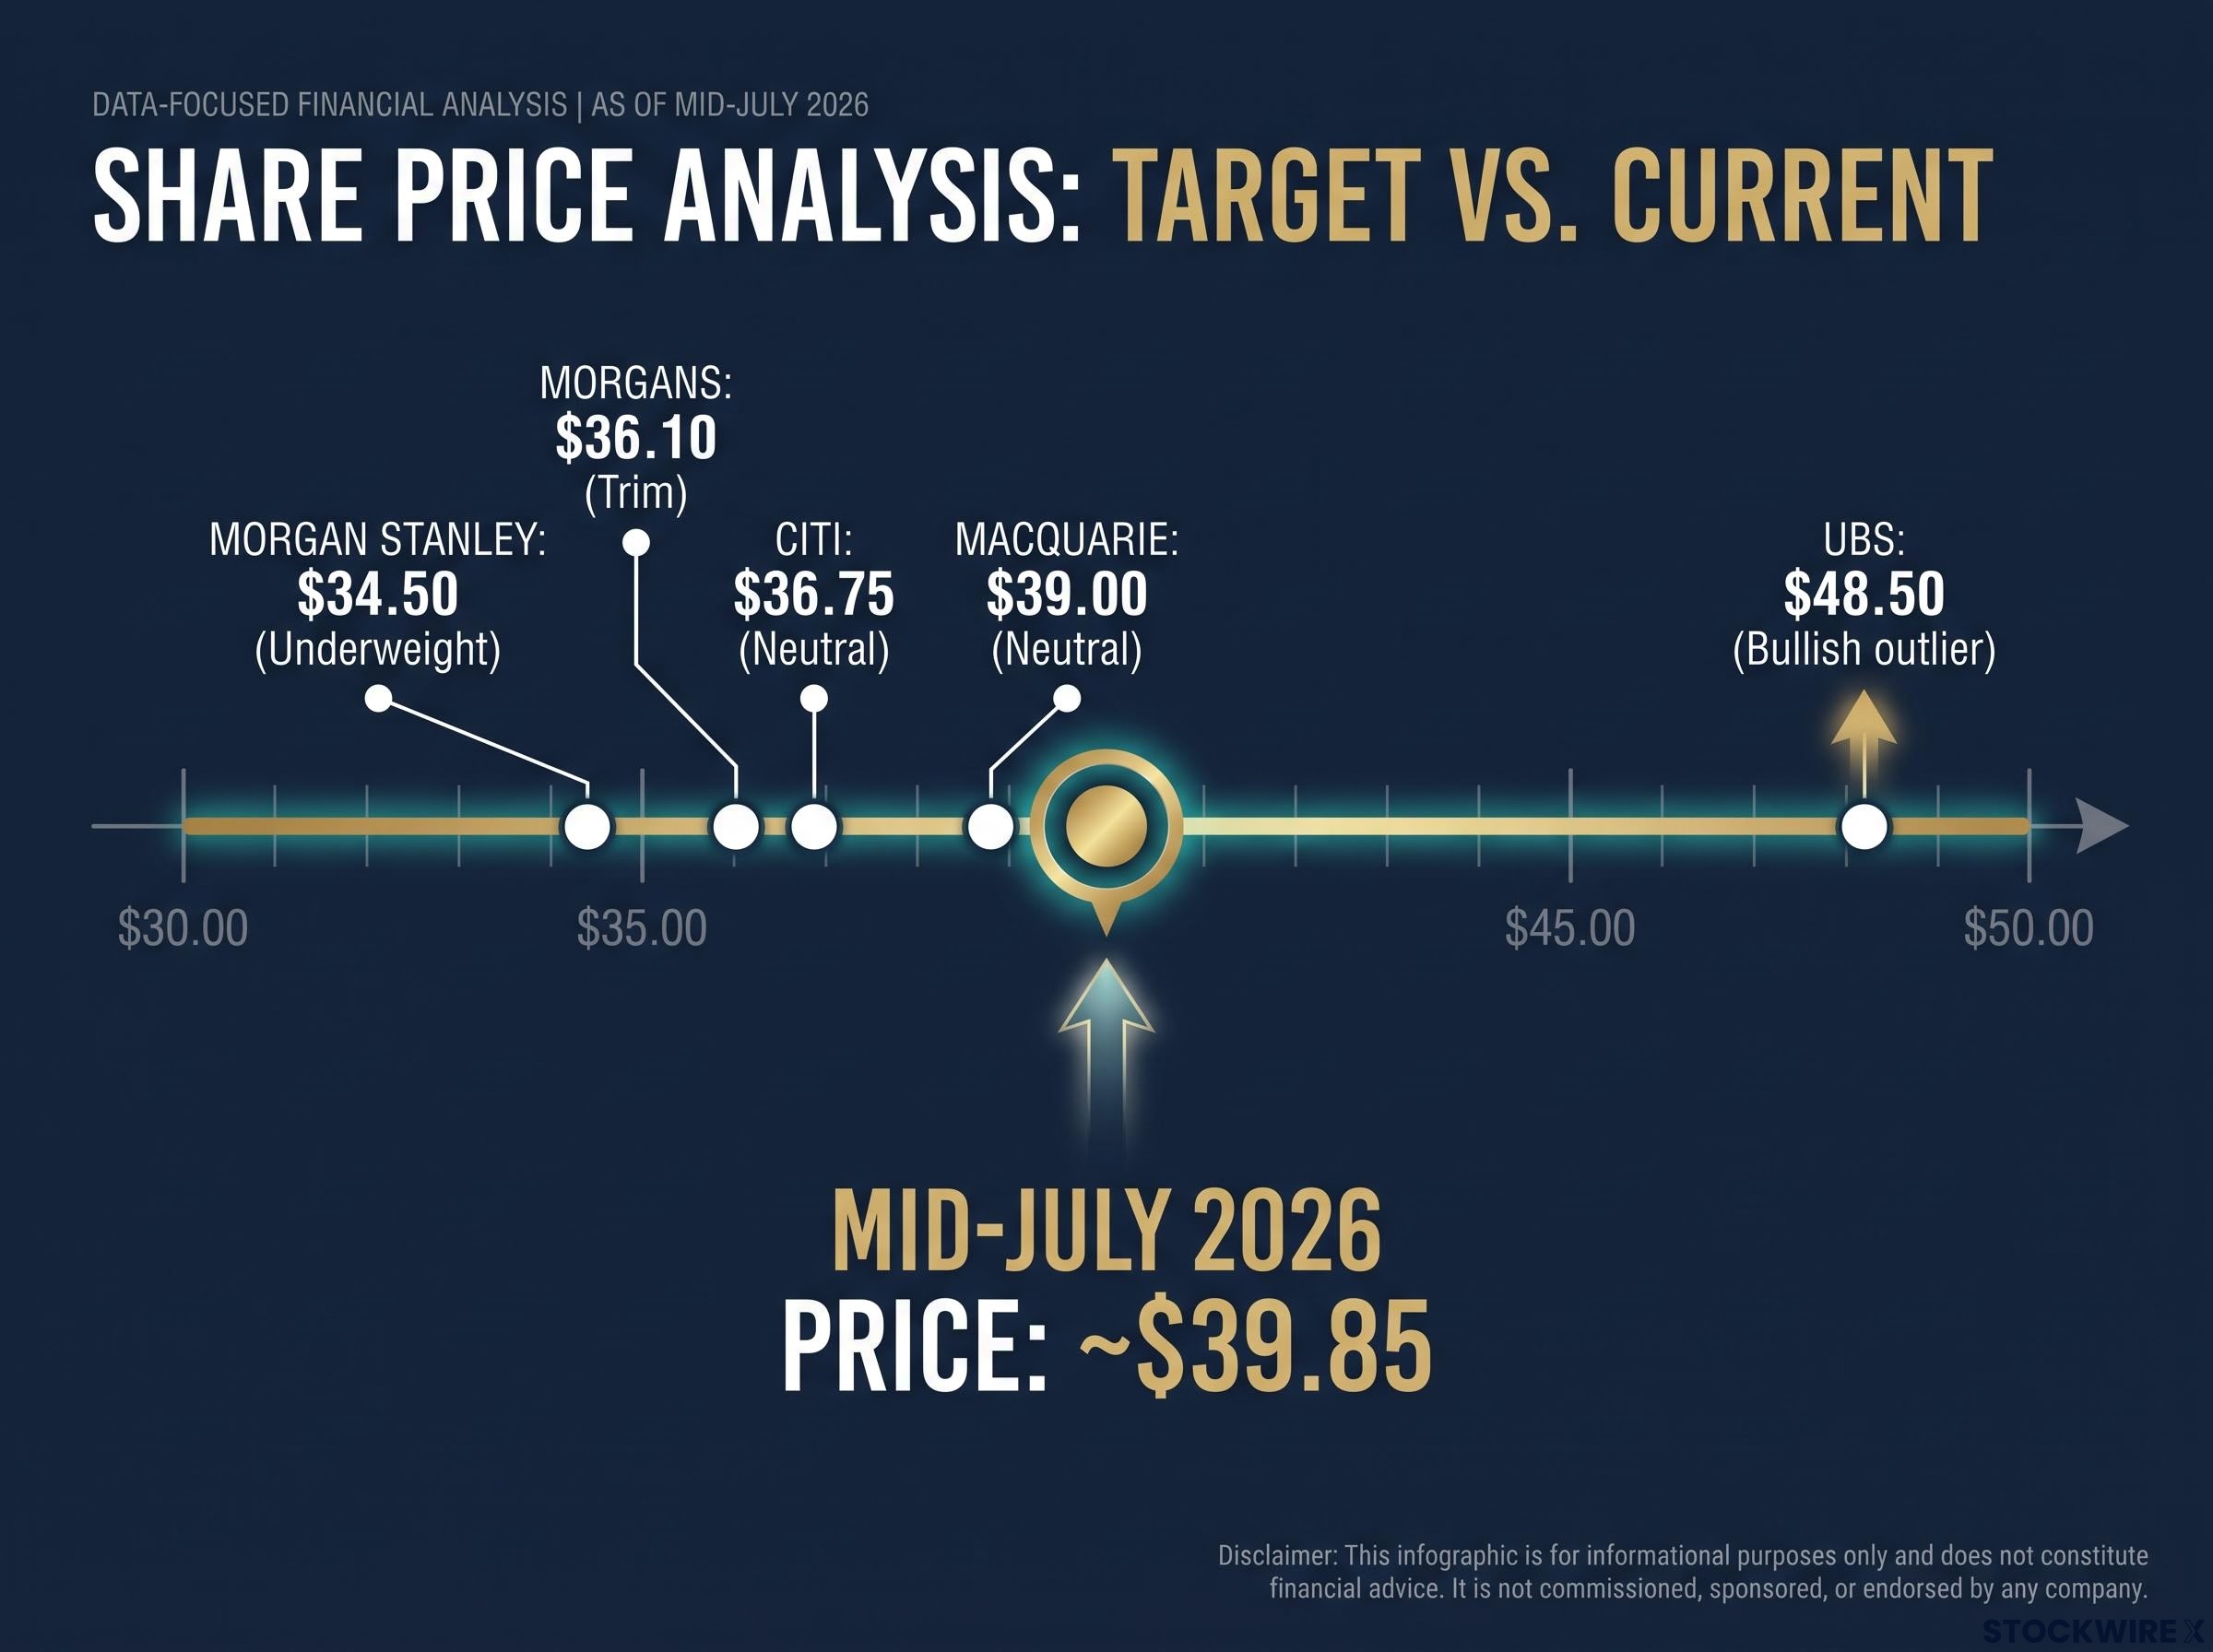
- Citi: Neutral, target $36.75
- Macquarie: Neutral, target $39.00
- Morgan Stanley: Underweight, target $34.50
- Morgans: Trim, target $36.10
- UBS: Bullish outlier, target $48.50
Morgan Stanley’s Underweight rating with a $34.50 target represents the starkest bearish anchor among major brokers, implying more than 13% downside from current levels.
The spread from $29.00 (Investing.com’s low) to $48.50 (UBS’s high) tells you that professional investors are genuinely divided on NAB’s near-term trajectory. Any single consensus number is a central tendency with wide uncertainty bands around it, not a forecast you should anchor to.
More telling than the average target is the ratings breakdown itself. Across both major aggregators, sells and holds outnumber buys. That is a structurally cautious picture that the average target alone can obscure.
The cautious NAB consensus is not an isolated broker view; a sector-wide valuation gap has emerged across all four major banks, with analyst price targets sitting materially below prevailing market prices at each of CBA, Westpac, ANZ, and NAB heading into mid-2026.
When big ASX news breaks, our subscribers know first
The dividend case: what $1.70 per share actually means for a $10,000 position
The income side of NAB is the number most investors find appealing first, and it is worth understanding the mechanics underneath it before folding it into the total return picture.
CommSec data puts NAB’s projected FY26 annual dividend at $1.70 per share, rising to $1.72 per share in FY27. Both are fully franked. Here is how the yield calculation works on a $10,000 position:
- At a share price of approximately $39.85, your $10,000 buys roughly 251 shares
- Applying the $1.70 annual dividend across those shares generates approximately $430 in cash distributions, which translates to a forward cash yield of roughly 4.3%
- The forward cash dividend yield works out to approximately 4.3%
- If the share price falls, the yield percentage rises, but the dollar amount you receive stays the same
The grossed-up yield picture shifts materially once franking credits are factored in, and a recent price pullback has lifted NAB’s grossed-up yield to approximately 6.5% at lower entry prices, a figure that reframes the income case compared to the raw cash yield of 4.3% visible at current levels.
All return scenarios in this article exclude the value of franking credits. For many Australian investors, particularly those on lower marginal tax rates, fully franked dividends materially improve the effective return. The size of that benefit depends on your individual tax position.
That $430 in annual cash is the most predictable component of the NAB return story. But it functions as a cushion against capital loss rather than a standalone reason to buy, and its real value to you depends heavily on your marginal tax rate and ability to use franking credits.
Running the numbers: six scenarios for your $10,000 in 12 months
The scenario table below is the analytical centrepiece. Because analyst targets differ materially across sources, a single projection is less useful than seeing the full range of outcomes with capital and income combined.
All scenarios use a starting price of approximately $39.85, a forward dividend of $1.70 per share (approximately $430 on a $10,000 position), and are illustrative only.
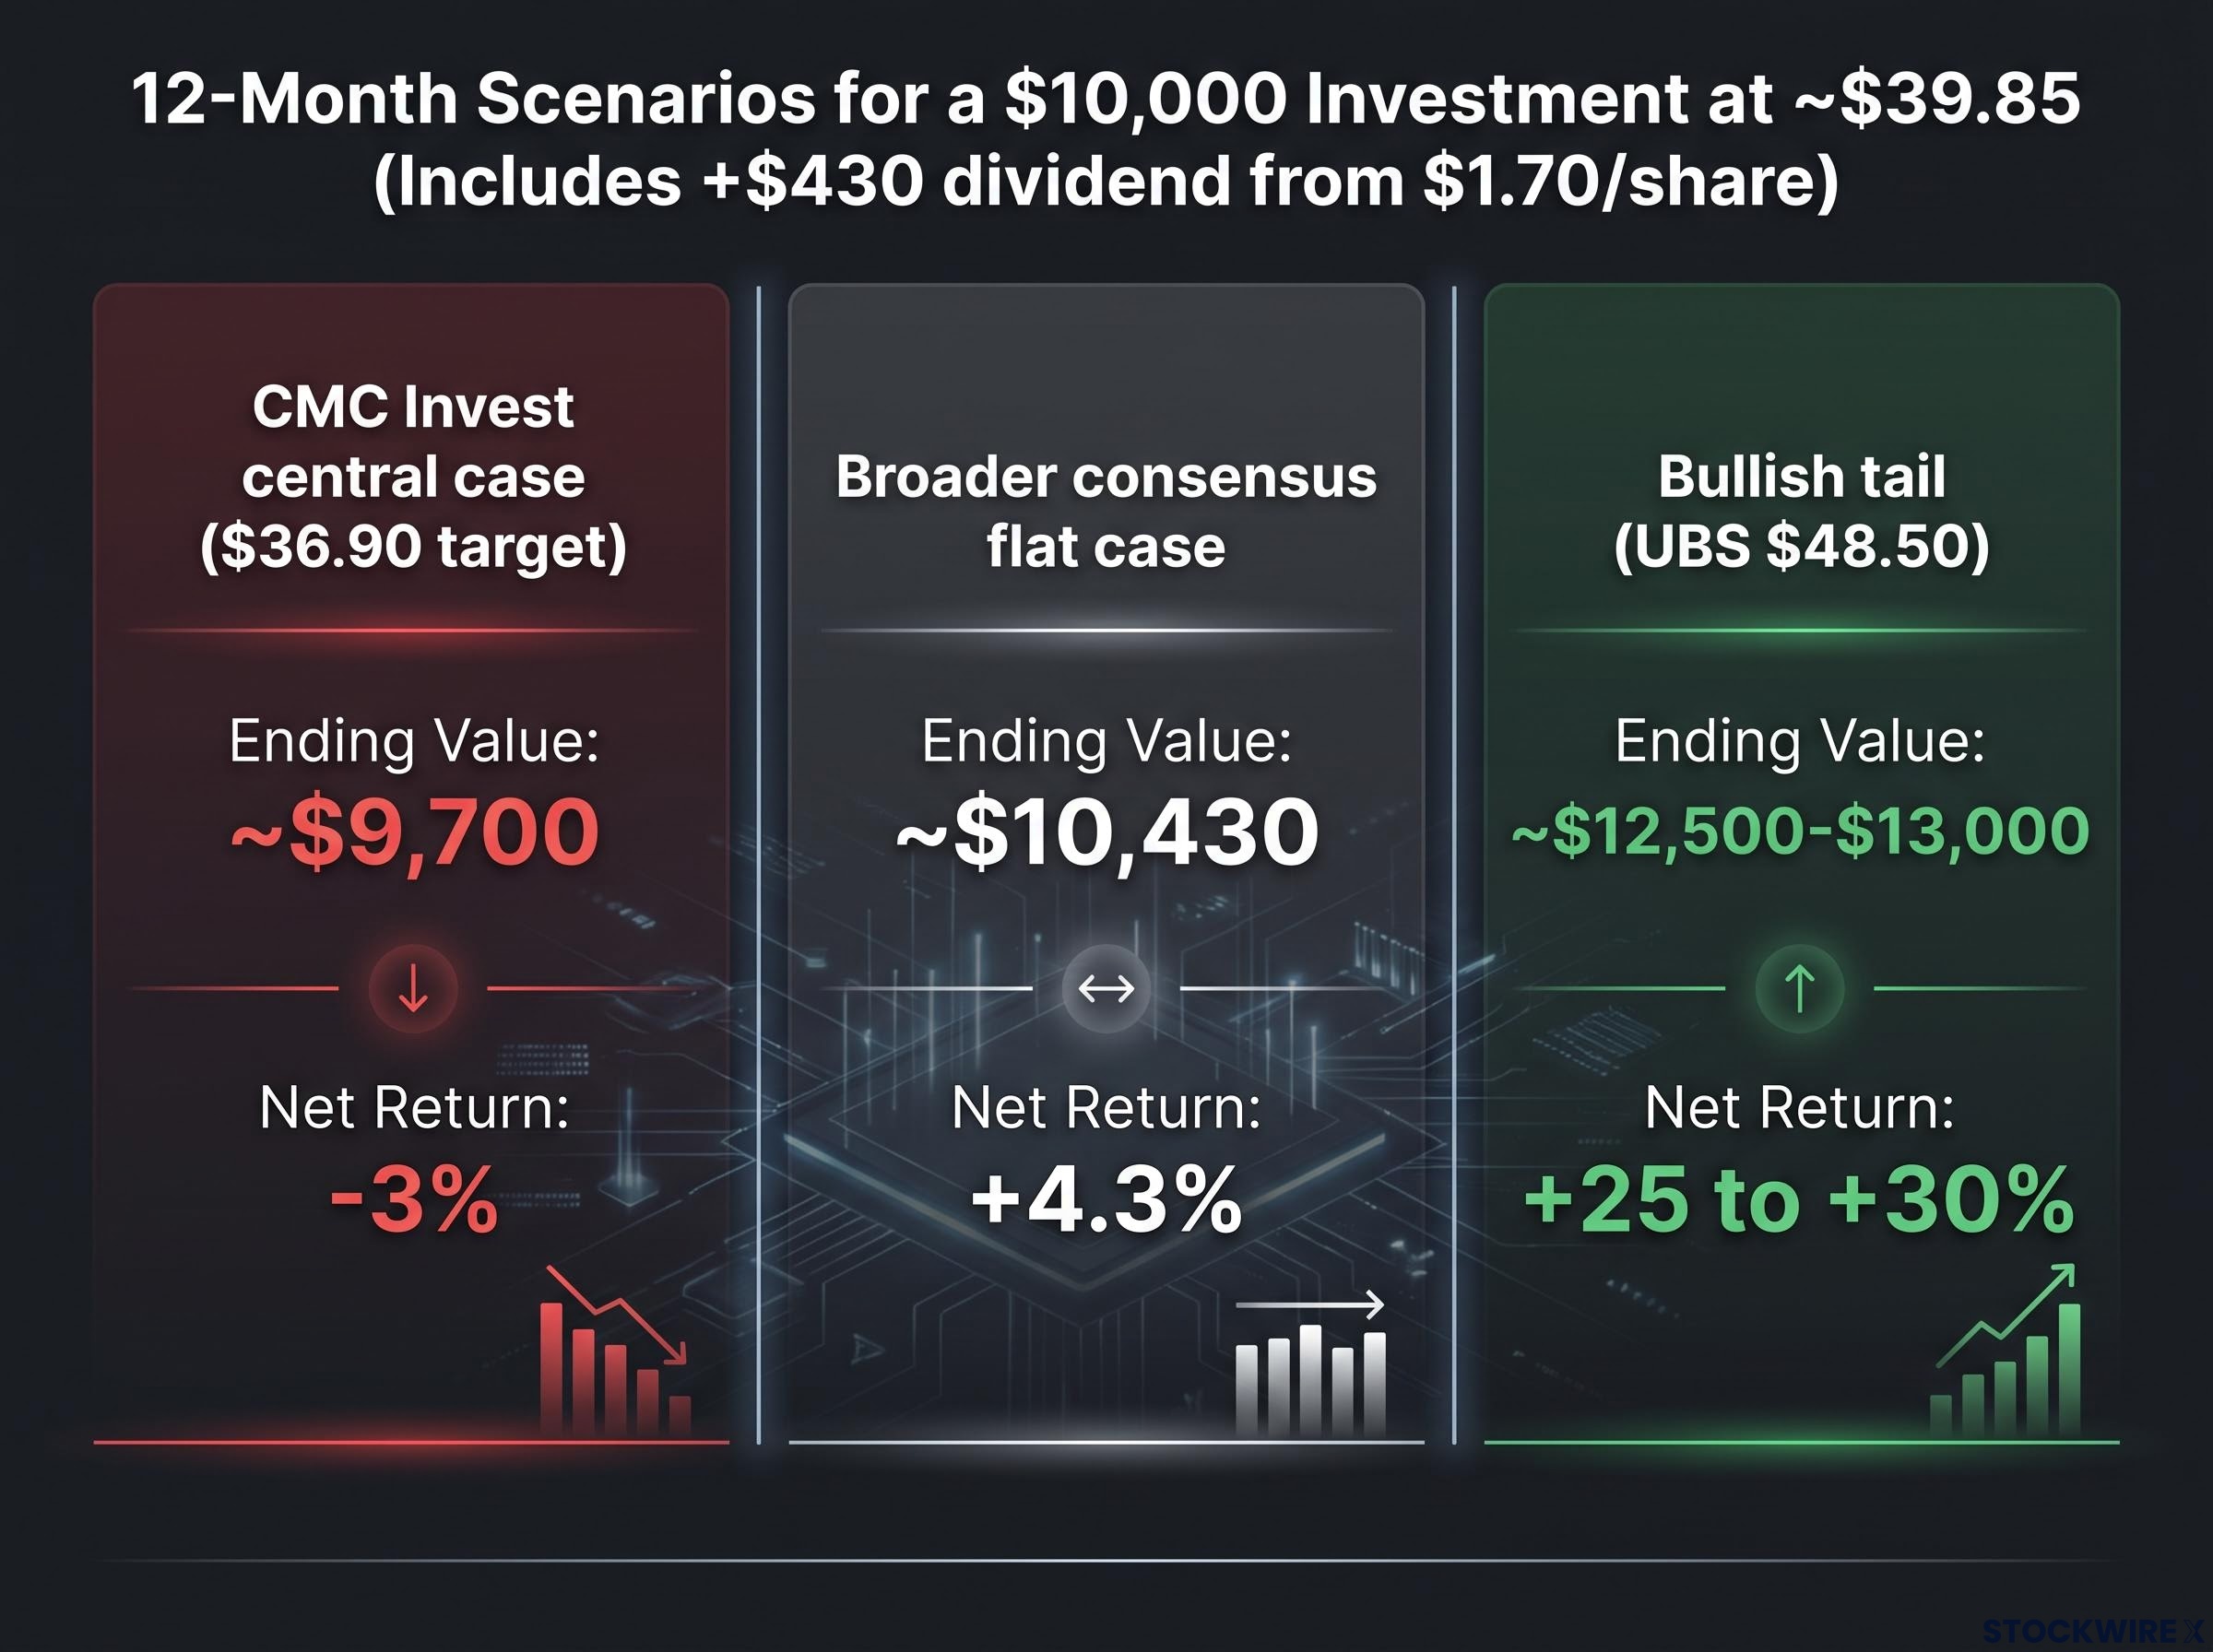
| Scenario | Capital Return | Dividend Income | Approx. Ending Value | Net Return |
|---|---|---|---|---|
| CMC Invest central case ($36.90 target) | –7% | +$430 | ~$9,700 | –3% |
| Broader consensus flat case | ~0% | +$430 | ~$10,430 | +4.3% |
| Mild upside (+1-2%) | +$100-$200 | +$430 | ~$10,530-$10,630 | +5-6% |
| Mild downside (–3 to –4%) | –$300 to –$400 | +$430 | ~$10,030-$10,130 | ~Breakeven |
| Bearish tail (~$29 target) | –20 to –25% | +$430 | ~$8,000-$8,500 | –15 to –20% |
| Bullish tail (UBS $48.50) | +20 to +25% | +$430 | ~$12,500-$13,000 | +25 to +30% |
All figures are illustrative estimates based on analyst consensus as of mid-July 2026 and exclude the value of franking credits.
The honest central expectation sits in the cluster between the CMC Invest case and the broader consensus flat case. That range, from roughly –3% to +4.3%, is not a compelling 12-month return in either direction. The dividend income is real and reasonably predictable, but it cannot fully offset a bearish capital outcome.
The tails are where the drama lives. A move to $29 would leave your $10,000 worth approximately $8,000-$8,500 even after dividends. A move to UBS’s $48.50 target would push it past $12,500. Both are possible. Neither is the central expectation.
Why brokers are not excited: the structural pressures on NAB’s valuation
The cautious consensus is not arbitrary. Three specific pressures underpin the hold and sell ratings:
- Valuation stretch: NAB traded in the mid-$40s at its recent highs. The resulting multiple was judged demanding relative to medium-term earnings growth, and the pullback to approximately $39.85 has not fully corrected that assessment. In broker commentary, the phrase “not obviously cheap” recurs.
- Net interest margin compression: The competitive mortgage market continues to squeeze margins, limiting the earnings growth that would justify a re-rating higher.
- Credit quality risk: Household balance sheet stress and potential economic softening represent the downside risk to earnings. This concern underpins the more bearish broker targets.
The RBA Financial Stability Review published in March 2026 identifies household indebtedness and lending standard deterioration as the primary transmission channels through which an economic softening would flow into bank balance sheets, providing the regulatory basis for the credit quality concerns embedded in the more bearish broker targets.
Net interest margins and the mortgage market
Net interest margin, the spread between what a bank earns on loans and pays on deposits, is the core profit driver for Australian banks. In NAB’s case, competitive mortgage pricing forces the bank to accept lower spreads to maintain market share.
This is not a temporary dynamic. It is a structural feature of the Australian mortgage market, and it constrains earnings growth even in a stable interest rate environment. Some brokers note that while the dividend remains attractive, valuation support becomes “less convincing if earnings momentum continues softening.”
Net interest margin compression across the sector accelerated sharply in May 2026 as the RBA hiked three times in four months to 4.35%, a pace that squeezed margins before the revenue benefit of higher rates could flow through, adding context to the broker caution visible in current NAB price targets.
For you as a retail investor, the implication is direct: the dividend yield alone is not a sufficient reason to hold if the earnings base supporting that dividend is under pressure. Buying for yield in a deteriorating earnings environment can be a costly mistake.
Who this trade actually suits: matching NAB to your investment profile
The question is not whether NAB is a good stock. It is whether NAB at current prices fits your specific situation.
The 12-month case is honest but unexciting. Under the more conservative CMC Invest consensus, total return is slightly negative. Under the broader consensus, it is low-single-digit positive. Neither outcome is compelling if you have alternatives elsewhere on the ASX with better risk-adjusted return profiles. The original source analysis expressed a view that other ASX opportunities appeared more attractive at current prices, without specifying which ones.
The multi-year income case is stronger. For an investor with a longer horizon who can effectively use franking credits and values dividend stability, NAB’s FY26 and FY27 payout forecasts ($1.70 and $1.72 per share, both fully franked) provide a reasonably dependable income stream even if capital appreciation stays muted. Twelve months is the standard analyst target timeframe, but as the original source acknowledged, it is an insufficient horizon for fully evaluating a business.
The investor profiles break down like this:
- Short-term (12-month) investor: Suited only if you are comfortable with a flat to slightly negative total return and are primarily positioning for income while waiting for a re-rating catalyst. Requires tolerance for potential capital loss exceeding the dividend cushion.
- Long-term income investor: Better suited if you have a multi-year horizon, can deploy franking credits effectively (particularly at lower marginal tax rates), and prioritise dividend stability over capital growth. The compounding of fully franked dividends over multiple years materially changes the return profile compared to a single 12-month snapshot.
The investor who benefits most from NAB at current prices is not hunting capital growth. They are building a franked income stream over years, and they should recognise that the consensus picture offers limited excitement over the next twelve months.
What would have to change to make NAB a more compelling buy
The consensus is cautious, not permanently bearish. Three specific conditions would shift broker ratings from hold and trim toward buy:
- Earnings surprise to the upside: The single most powerful catalyst would be evidence that the softening earnings momentum has stabilised or reversed. A quarterly result showing margin resilience or revenue growth ahead of expectations would force a reassessment of the valuation argument.
- Net interest margin stabilisation: If mortgage market competition eases or funding costs fall faster than lending rates, margin compression could slow. This is the structural variable that matters most for NAB’s medium-term earnings trajectory.
- Macro improvement reducing credit risk: The household balance sheet concern is tied to broader economic conditions. A sustained improvement in employment data, consumer confidence, or housing market stability would reduce the probability of the credit quality deterioration that underpins the bearish tail.
The broker target range of $29.00 to $48.50 tells you NAB is highly sensitive to surprises in either direction. That spread is not noise; it reflects genuine analytical uncertainty about the earnings and macro trajectory.
None of these catalysts is the central expectation right now. The consensus is explicitly not calling for them. But for a retail investor sitting on the sidelines, these are the identifiable, observable triggers that would justify re-evaluating the position, so the decision does not default to permanent inaction.
Making a clear-eyed call on NAB at current prices
The consensus picture on NAB is cautious. The income return of approximately 4.3% (fully franked) is real but modest. The 12-month total return, when capital and income are combined, probability-weights toward flat to low-single-digit positive under broader consensus, or slightly negative under the more conservative CMC Invest target.
NAB suits a patient income investor with a multi-year horizon and the ability to use franking credits more than it suits someone seeking meaningful capital appreciation over 12 months. The structural pressures on margins and earnings momentum explain why professional analysts are clustered around hold rather than buy, and those pressures are not temporary.
For investors wanting to model how NAB’s fully franked dividends fit into a broader income portfolio, our full explainer on ASX franking credit income strategies covers the after-tax advantage over term deposits and how to combine direct shares, LICs, and income ETFs in a single resilient portfolio.
This analysis uses consensus data as of mid-July 2026. Analyst targets frequently diverge from actual outcomes, and the wide range of individual broker views underscores the genuine uncertainty involved.
This article is for informational purposes only and should not be considered financial advice. Investors should conduct their own research and consult with financial professionals before making investment decisions. Past performance does not guarantee future results. Financial projections are subject to market conditions and various risk factors.
—