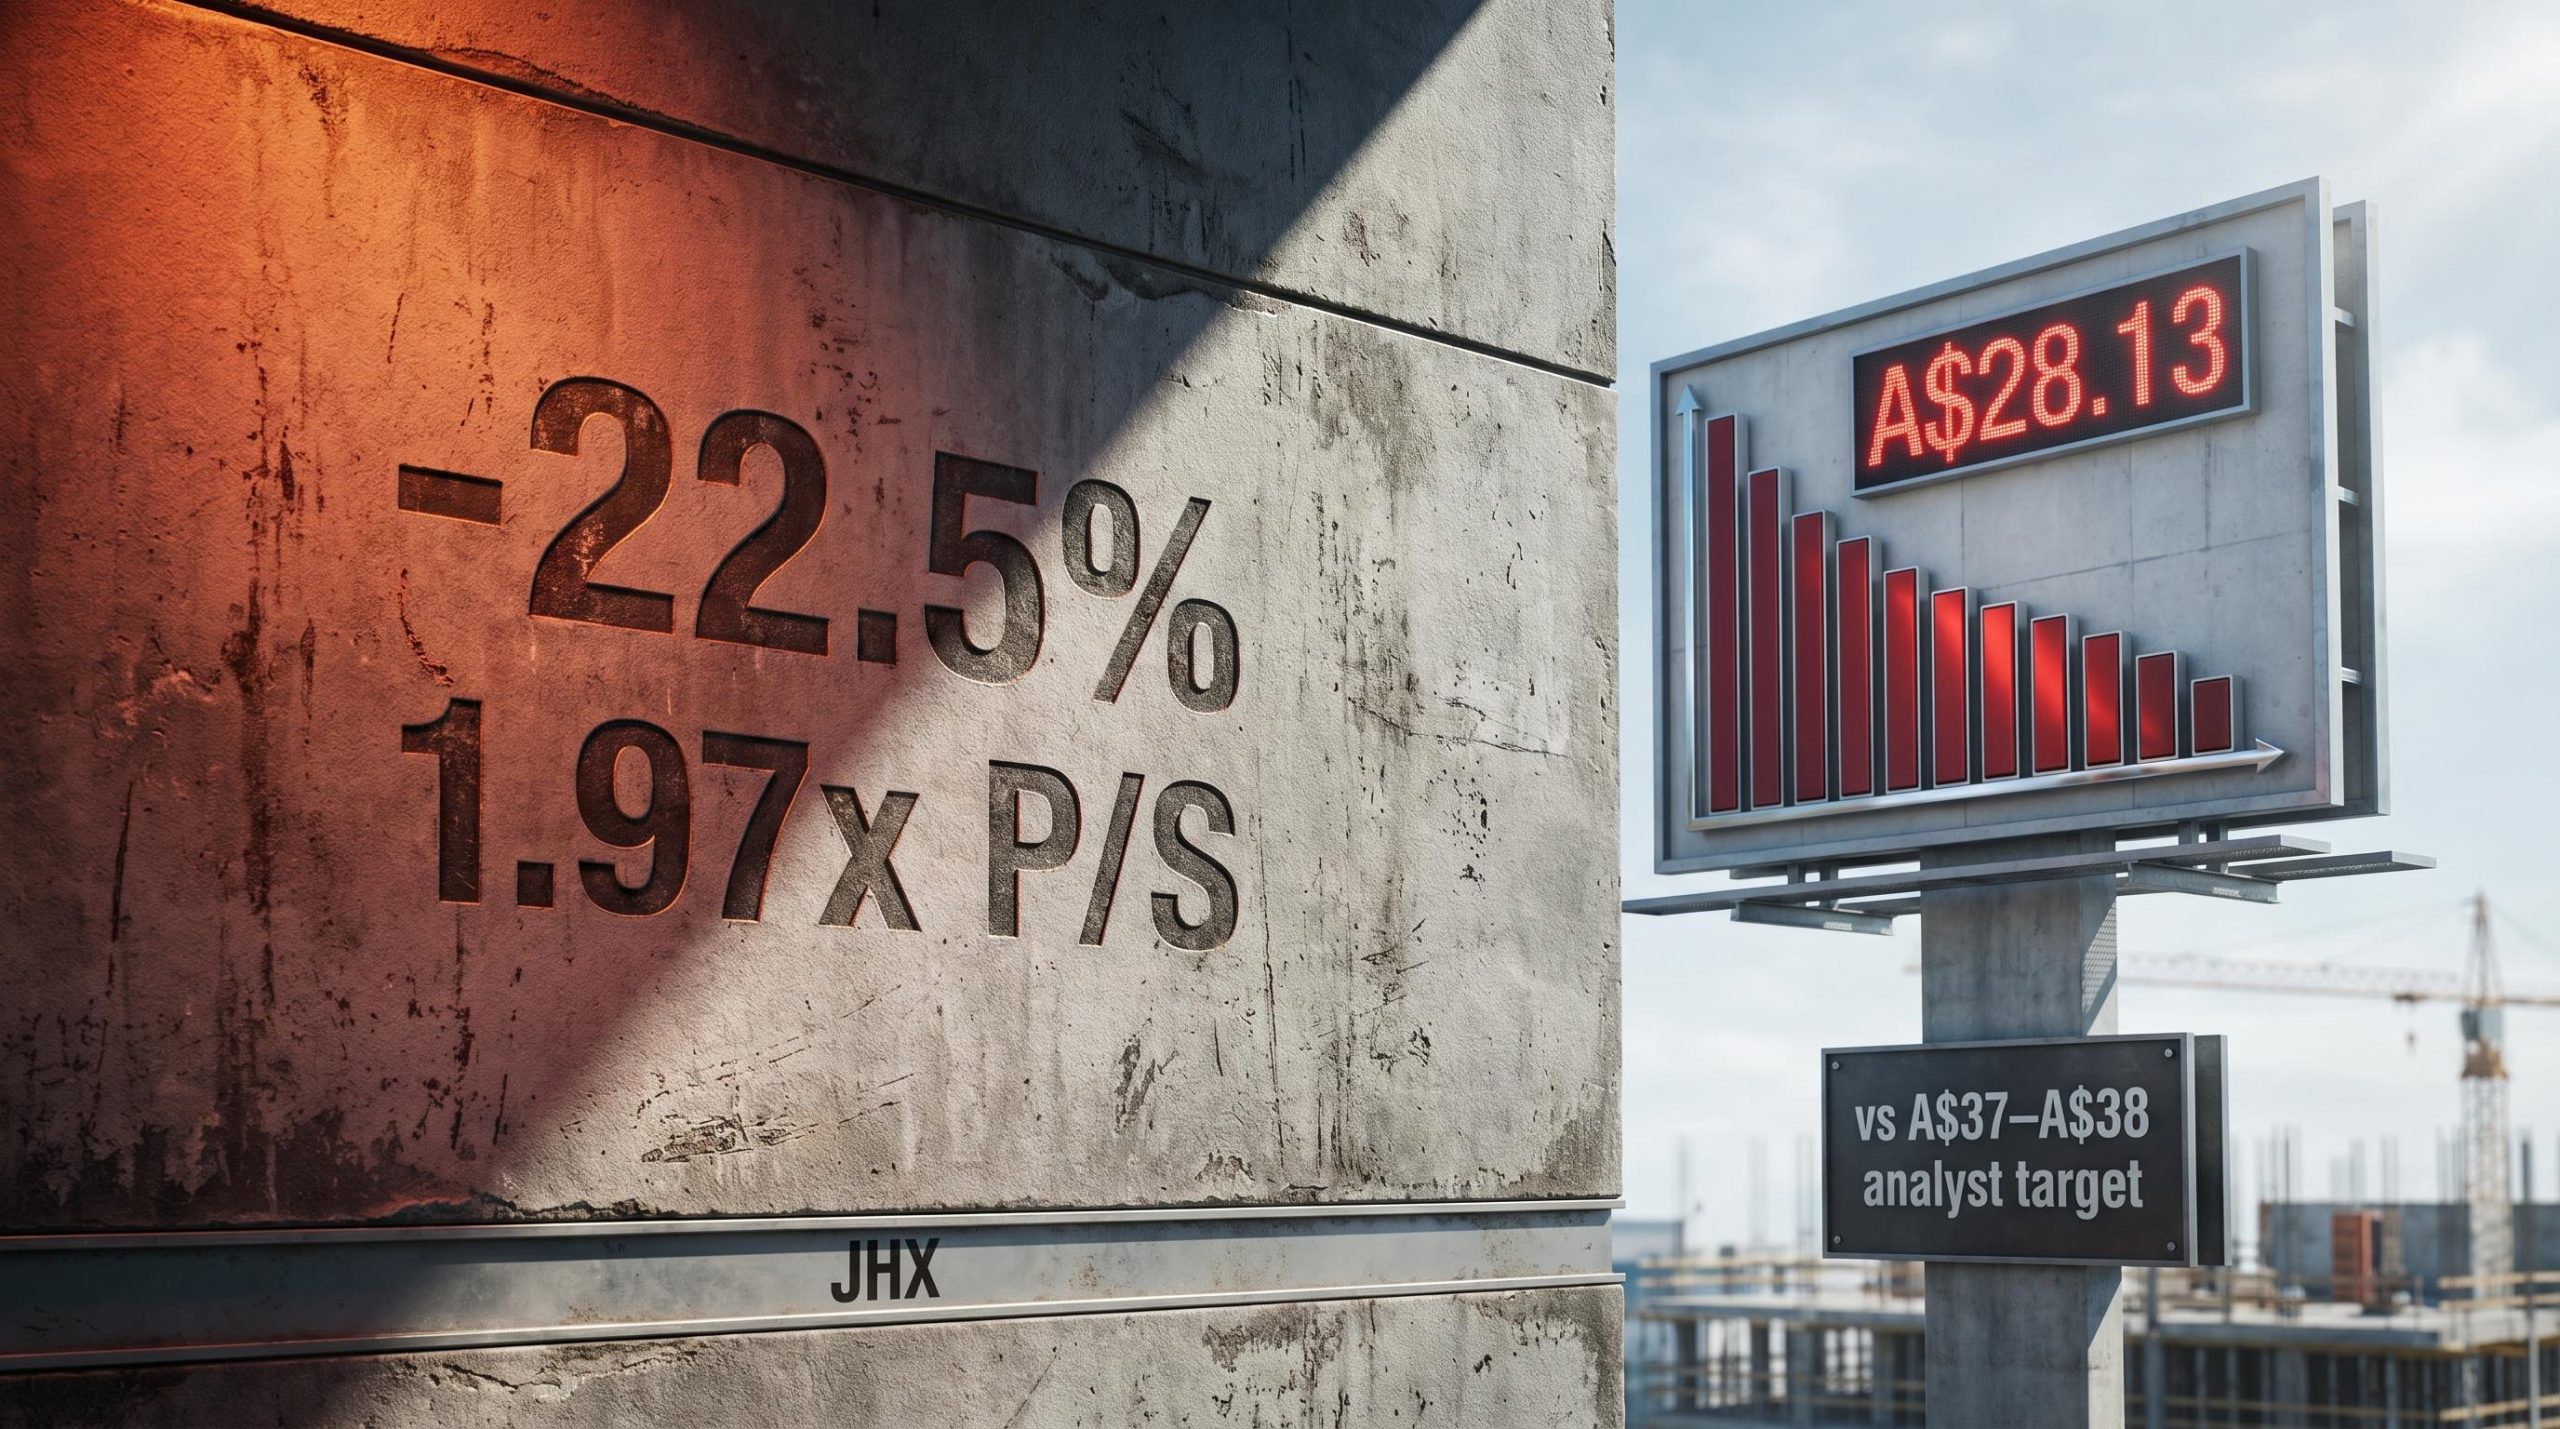
James Hardie Industries shares have shed roughly 22.5% over the past year, underperforming the ASX 200 by approximately 31 percentage points. That sell-off has compressed the stock’s price-to-sales multiple to 1.97x, less than half its five-year historical average of 4.14x. For Australian investors watching building materials stocks, that kind of valuation compression raises an obvious question: is the market mispricing a global category leader, or accurately reflecting structural headwinds in the world’s most important housing market? This analysis examines the JHX investment case from multiple angles, covering company fundamentals, valuation mechanics, macro context, and the Azek acquisition, to help readers assess whether the current discount reflects a genuine opportunity or a warranted re-rating.
From fibre cement to global building giant: what James Hardie actually does
James Hardie Industries is the world’s leading manufacturer of fibre cement and gypsum building products, with operations spanning North America, Europe, Australia, and New Zealand. The company’s workforce exceeds 5,200 employees globally, and its dual listing on both the ASX (AUD-denominated) and NYSE (USD-denominated) reflects the scale of its international footprint.
Fibre cement commands premium positioning for structural reasons. The material offers fire resistance, durability, low maintenance, and protection against water and termite damage, making it a superior alternative to wood and vinyl cladding in residential and commercial construction. That product advantage underpins four operational pillars:
- Fibre cement siding: The core product line and dominant revenue contributor, particularly in North American residential construction
- Gypsum products: Interior lining and ceiling systems across multiple geographies
- North American dominance: The majority of revenue is generated in the United States, the world’s largest single-country housing market
- International operations: Meaningful but smaller earnings contributions from Australia, New Zealand, and Europe
A track record of profitable growth before the current downturn
In FY24, James Hardie reported revenue of $3.936 billion, up 4% year-on-year, alongside adjusted net income of $708 million, representing 17% growth on the prior year. Revenue growth had been consistent over the preceding three-year period, giving the current valuation compression a clearer before-and-after shape. The business was delivering profitable growth at scale before the FY26 de-rating arrived.
When big ASX news breaks, our subscribers know first
What the price-to-sales compression actually tells us (and what it does not)
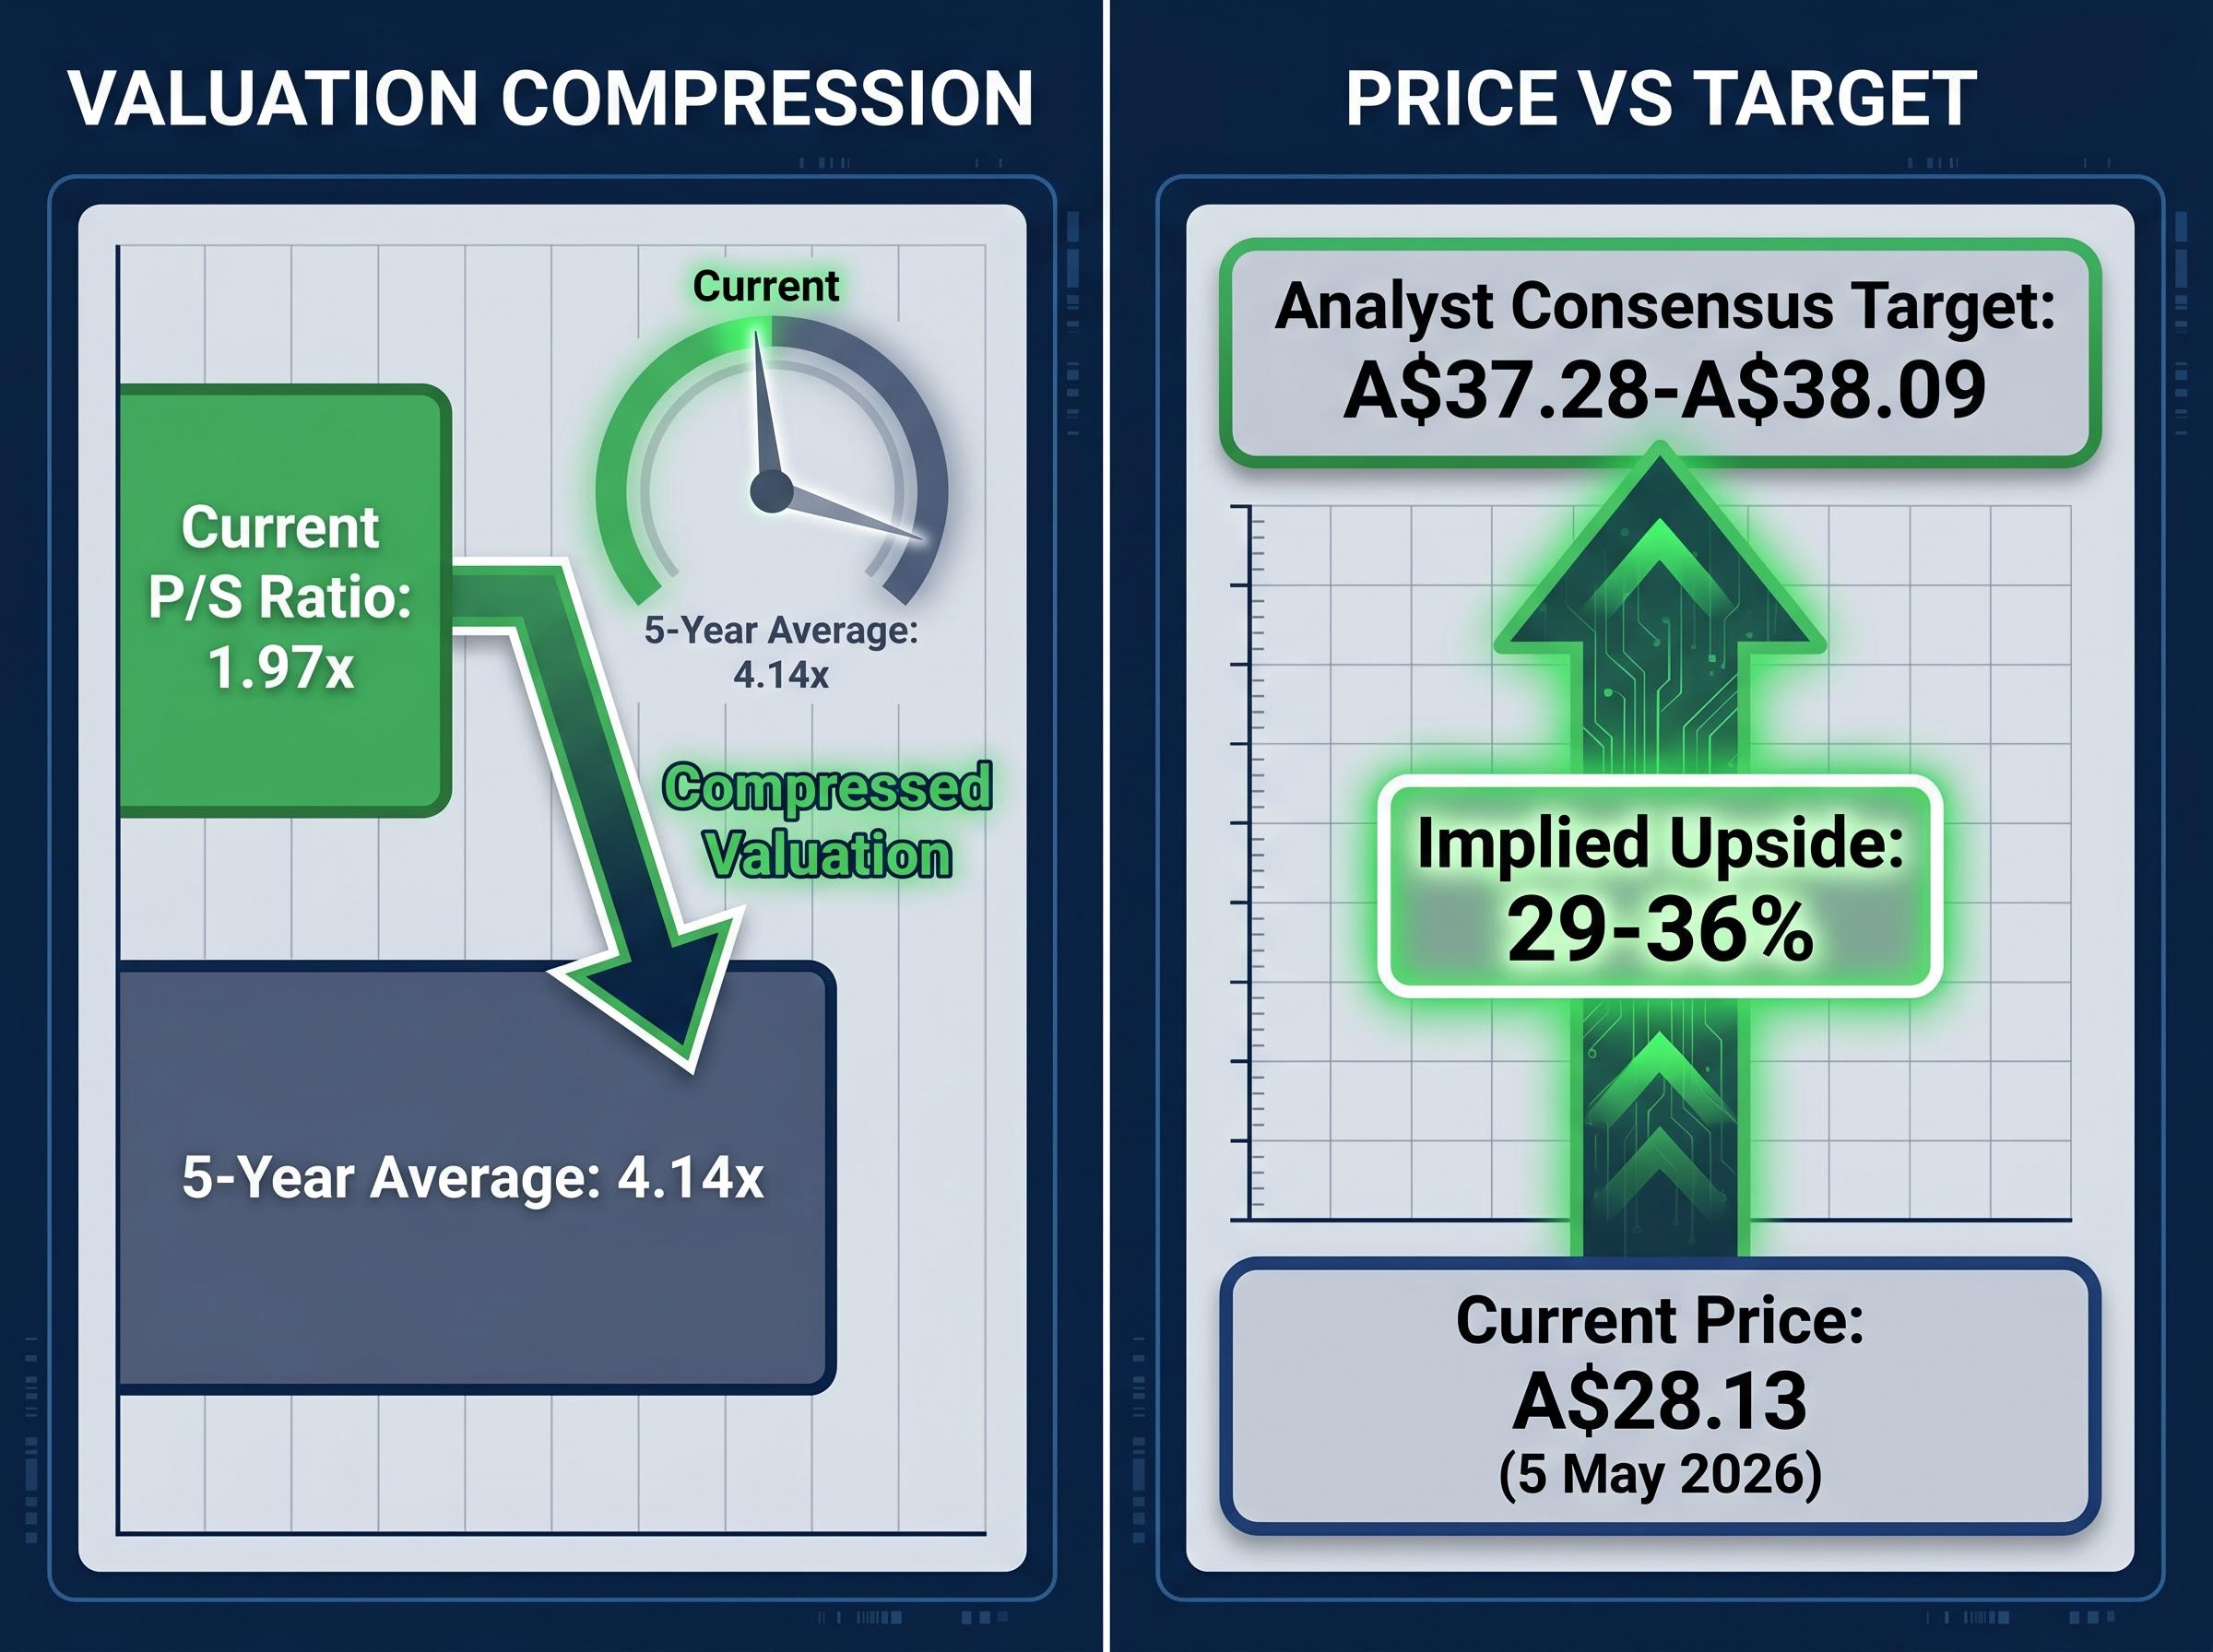
The valuation signal that draws most investors to JHX right now is stark. The current price-to-sales ratio sits at 1.97x, compared with a five-year historical average of 4.14x. That represents a compression of more than 50%.
The P/S ratio has fallen from a five-year average of 4.14x to 1.97x, a compression of more than half.
Price-to-sales measures how much the market pays per dollar of revenue. It is a useful screening tool, but a compression this large can result from three distinct causes: share price decline, revenue growth outpacing market capitalisation, or a combination of both. JHX has experienced all three simultaneously.
The share price fell approximately 6.6% from the start of 2025 to early May 2026, according to Rask data, while the broader one-year return figure of -22.5% captures the sharper drawdown through the full period. Simply Wall St’s assessment places the stock approximately 28.4% below fair value, with a forward earnings growth forecast of roughly +32.2% per annum.
| Metric | Current Value | Five-Year Average |
|---|---|---|
| Price-to-Sales Ratio | 1.97x | 4.14x |
| One-Year Share Price Return | -22.5% | N/A |
| Analyst Consensus Target (ASX) | ~A$37-A$38 | N/A |
| Current ASX Price | ~A$28.13 | N/A |
The caution here is straightforward: price-to-sales is one of multiple valuation frameworks, and relying on a single metric can mislead investors, particularly when business conditions have structurally changed. A P/S ratio that looks historically cheap may simply reflect a market that has repriced the stock’s future revenue trajectory downward.
Why the share price fell: unpacking the FY26 de-rating
The de-rating did not arrive gradually. It was anchored to a single event.
- 19 August 2025: JHX reported Q1 FY26 results. North American siding volumes came in weaker than expected, and management lowered full-year guidance, citing soft homebuilder demand, elevated mortgage rates, home affordability constraints, and tariff volatility on input costs.
- Post-earnings share price drop: The stock fell approximately 36.5% in the wake of the report, one of the sharpest single-event declines in the company’s recent history.
- Analyst target reductions: Consensus price targets were cut materially. Pre-August 2025, the ASX consensus sat at approximately A$43.66. Post-cut, the range settled around A$36-A$38, with individual broker reductions of roughly A$5 from firms including Barclays and Truist.
- April 2026 partial recovery: Shares jumped approximately 17% in April 2026, sparking speculation about whether a broader recovery was underway ahead of the upcoming Q4 FY26 results.
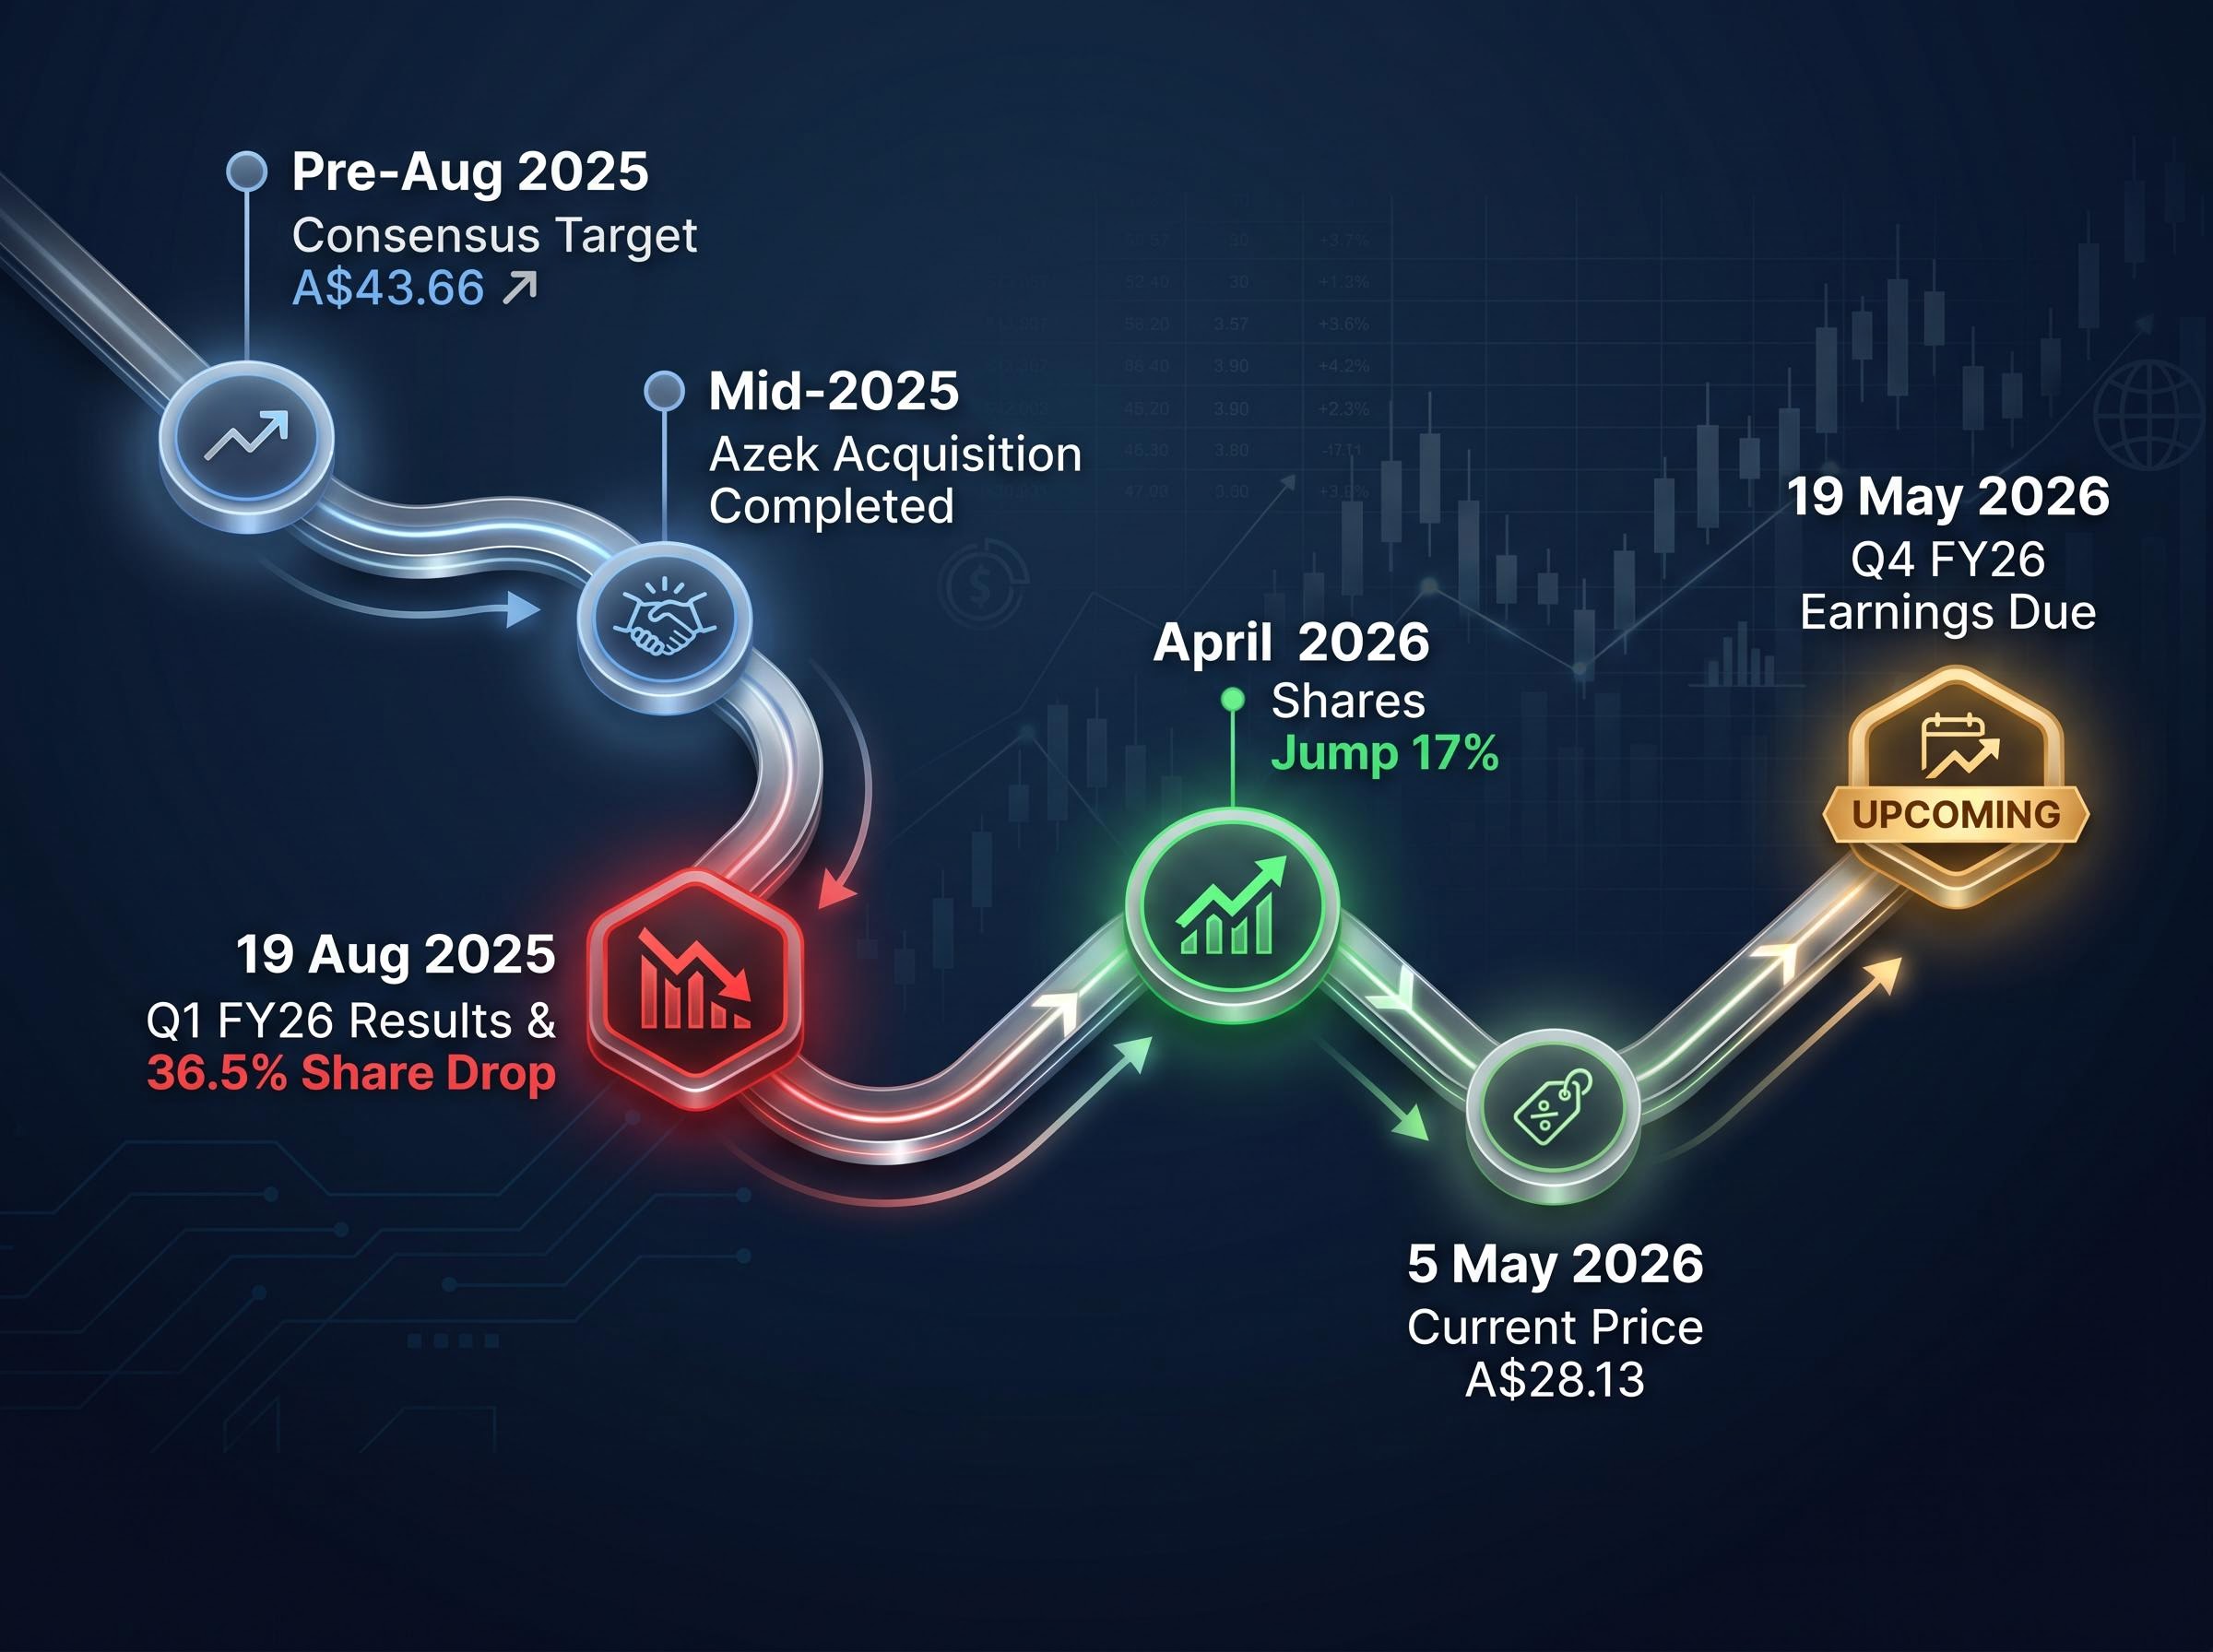
The sequence matters because it separates the cause of the de-rating (a specific earnings miss and guidance cut tied to cyclical housing weakness) from the question of whether the de-rating has been excessive.
ASX market breadth deterioration provides useful context for JHX’s underperformance: in the week ending 1 May 2026, 22 ASX 200 constituents hit fresh 52-week lows against just 11 new highs, with Consumer Discretionary and Health Care producing the most annual lows as rate-sensitive and demand-facing sectors bore the brunt of elevated borrowing costs.
Analyst targets vs. current price: how big is the implied gap?
The consensus analyst target for ASX:JHX sits at approximately A$37.28-A$38.09, based on coverage from 18-20 analysts, with the majority maintaining an Outperform rating according to Marketscreener data. Against a current price of approximately A$28.13 (as of 5 May 2026), that implies upside of roughly 29-36%.
The upcoming Q4 FY26 earnings release on 19 May 2026 is the immediate test of that implied gap. A result that confirms stabilising volumes could begin closing the discount. Another miss could widen it further.
The housing market headwinds keeping pressure on JHX
North America generates the majority of JHX’s revenue, which means US housing conditions are the dominant driver of the company’s near-term earnings trajectory. The current data does not suggest a recovery is imminent.
The NAHB homebuilder sentiment index read 45 in May 2026, below the 50 neutral threshold, indicating conditions remain cautious rather than recovering.
The NAHB (National Association of Home Builders) homebuilder sentiment index measures builder confidence on a 0-100 scale, where readings below 50 signal that more builders view conditions as poor than good. A reading of 45 places the industry firmly in cautious territory.
The broader question of US housing market decoupling from the wider economy is one that equity markets appear to have partially answered, with homebuilder ETFs remaining positive year-to-date even as new single-family home sales fell 17.6% in January 2026, the steepest monthly decline since 2013.
| Indicator | Reading |
|---|---|
| NAHB Homebuilder Sentiment Index (May 2026) | 45 (below 50 neutral threshold) |
| US House Price Growth (YoY, FHFA Feb 2026) | +1.8% |
| US Renovation Spending Growth (YoY) | ~+1.8% (slowing) |
| Australian Dwelling Value Growth (Q1 2026) | +2.1% |
US house prices rose +1.8% year-on-year according to FHFA data released in February 2026, while renovation spending growth of approximately +1.8% year-on-year has been slowing under the weight of elevated interest rates. Australian dwelling values performed somewhat better, rising 2.1% in Q1 2026, with a full-year 2026 forecast of approximately +2.8%. That provides partial comfort, but JHX’s Australian earnings exposure is considerably smaller than its North American footprint. For Australian holders, the domestic backdrop offers limited insulation from the US demand picture.
The FHFA House Price Index data for February 2026 confirmed annual house price growth of approximately 1.7-1.8 percent, a figure that, while positive in nominal terms, reflects a materially slower appreciation environment than the rate-driven years preceding the current tightening cycle.
The Azek acquisition: strategic optionality or a complication?
James Hardie completed the acquisition of AZEK Company in mid-2025, expanding its product range into outdoor living categories including composite decking. The deal broadens the company’s addressable market beyond fibre cement siding into a growth category with its own demand dynamics.
Integration is ongoing as of early 2026, with synergies expected to materialise in margins and revenue over the medium term rather than immediately. Multiple covering analysts cite Azek synergies as a key component of the long-term upside thesis, and the forward earnings growth forecast of approximately +32.2% per annum from Simply Wall St incorporates Azek contribution assumptions.
The timing tension is real, however. The acquisition adds strategic optionality in a growing product category, but the short-term share price pressure from housing weakness has overshadowed the deal’s strategic merit in the market’s current assessment. Three pillars underpin the long-term bull case:
- US housing cycle recovery: A normalisation in mortgage rates and homebuilder activity would directly lift JHX’s core siding volumes
- Azek synergy realisation: Margin improvement and cross-selling opportunities across the combined product portfolio
- Structural market share gains: Fibre cement’s performance advantages over wood and vinyl cladding continue to drive long-term substitution trends
What investors need to see before synergies become real
The key milestones to watch are the Q4 FY26 results (due 19 May 2026) and subsequent FY27 reporting for evidence of Azek revenue contribution and margin improvement. Australian holders of ASX:JHX should also consider the currency dimension: Azek’s revenues are USD-denominated, and AUD/USD movements will affect the translation of earnings into Australian dollar terms.
A discounted stock is not automatically a bargain: building a balanced view
The P/S compression to 1.97x is statistically striking. But the five-year average of 4.14x was set during a period of different interest rates, different housing conditions, and a different company scale. Reversion to that average is not guaranteed, and treating it as an anchor without interrogating whether the benchmark still applies is a common analytical error.
Valuation discounts in cyclical businesses require investors to assess whether the historical average remains the right benchmark, or whether the market is repricing to a new normal.
Valuation gaps in cyclical stocks have attracted significant institutional attention in 2026, with fund flows into discounted segments surging as broad-market breadth remains narrow: fewer than 60% of S&P 500 constituents are trading above their 200-day moving average despite index-level gains, a condition that historically precedes rotation toward undervalued names in beaten-down sectors.
The NYSE 52-week range of $16.46-$29.83 illustrates the volatility band investors have navigated. Simply Wall St’s forward EPS growth estimate of approximately +31.3% per annum suggests the earnings trajectory could support a re-rating, but that estimate itself carries execution risk around Azek integration and housing demand recovery.
The bull case rests on:
- Analyst consensus of A$37-A$38 from 18-20 analysts with Outperform ratings, implying 29-36% upside
- Forward earnings growth forecasts above 30% per annum
- Azek synergies broadening the revenue base and margin profile
- Fibre cement’s structural advantages driving long-term market share gains
The bear case centres on:
- A Q4 FY26 miss on 19 May 2026 extending the de-rating further
- Prolonged US housing weakness suppressing volumes beyond current forecasts
- Azek integration friction delaying synergy realisation
- AUD/USD headwinds compressing translated earnings for Australian holders
Single-metric valuation analysis, whether P/S, P/E, or any other ratio, has material limitations when business conditions are in flux. The discount is a starting point for investigation, not a conclusion.
The investment case in context: what the valuation gap demands from investors
JHX trades at a historically anomalous valuation discount, with credible analyst upside of 29-36% to consensus targets. The underlying business retains category leadership in fibre cement, has added strategic optionality through Azek, and is forecast to deliver forward earnings growth above 30% per annum.
The near-term picture is less certain. The Q4 FY26 earnings release on 19 May 2026 is the immediate test. US housing conditions remain soft, and the macro headwinds that triggered the de-rating have not yet reversed. Australian investors should also weigh the dual-listing structure and USD earnings exposure as a distinct factor in their decision-making, separate from the underlying stock thesis.
The analytical lesson here is worth stating directly: valuation discounts are starting points for investigation, not conclusions. The quality of that investigation, and the patience to wait for confirmation from the data, is what separates considered investment decisions from reactive ones.
This article is for informational purposes only and should not be considered financial advice. Investors should conduct their own research and consult with financial professionals before making investment decisions. Past performance does not guarantee future results. Financial projections are subject to market conditions and various risk factors.