
Gold was supposed to rise during a war. Instead, it fell about 4% last week, according to Reuters, while the US-Iran conflict kept running. On Monday it climbed back above $4,000 an ounce, and the trigger was not escalation. It was cheaper oil.
That puzzle sits at the centre of any near-term gold price forecast. The Federal Reserve meets on 27-28 October under Chair Kevin Warsh. The Personal Consumption Expenditures (PCE) inflation index, the Fed’s preferred inflation gauge, arrives on 29 October, and US midterm elections follow on 3 November.
If you read Monday’s bounce as a decisive break higher, you risk buying into a relief move just as three rate-sensitive events hit in a single week. Here is a framework for reading the next two weeks: what drove the rebound, which price levels matter, and which dates could undo it.
Why did gold bounce back above $4,000 when oil and tensions were still elevated?
Gold touched $3,975 on 23 October, its lowest level since 20 July. By Monday morning it had recovered to $4,014.49 at 09:24 GMT on Reuters figures, while FXStreet put it near $4,020 later in the session. The gap reflects different timestamps rather than a dispute.
The conflict had not ended. Qatari mediators travelled to Tehran on 25 October in coordination with Washington, Houthi attacks on Saudi Arabia continued, and members of the Mecca Pact agreed only to keep talking. Speculation about a coordinated US-Israel strike on Tehran persisted.
What changed was oil. West Texas Intermediate (WTI) crude traded between roughly $101 and $103 a barrel, with Reuters recording a 2.16% fall early in the day.
The rate channel
Oil feeds gold through two competing routes:
- Inflation and rates: higher oil lifts expected inflation, which raises the odds of Fed tightening. Yields and the dollar climb, and gold weakens even during a conflict.
- Safe haven: conflict lifts demand for gold as a politically neutral store of value, especially when investors fear sanctions or trade disruption.
On Monday the first channel ran in reverse. Softer oil eased inflation fears, trimmed tightening pressure and let Treasury yields slip.
The oil link works because oil-driven inflation expectations feed into real yields, so a drop in crude can ease tightening fears and lift gold even when the conflict that lifted oil is still running.
The safe-haven channel
De-escalation hopes should have cost gold some of its war premium. They did, but the relief on rates temporarily outweighed that loss.
The relief view Kyle Rodda of Capital.com described the rebound as mainly relief from lower oil rather than a decisive bullish break, adding that gold will trade primarily on rate expectations and geopolitical risk.
Giovanni Staunovo of UBS pointed out that the $4,000 area has drawn both technical and physical buying before. That helps explain why the level held, but it does not change what moved the price. You should read this rebound as a rates story rather than a conflict story, which means gold’s next move depends more on yields and the Fed than on headlines from Tehran.
When big ASX news breaks, our subscribers know first
How do rates, real yields and the dollar set the direction for gold?
If rates are now steering gold, the mechanism is worth understanding from the ground up. Gold pays no interest or dividend. A real yield is the return on a bond after inflation is subtracted, and when real yields rise, holding a metal that earns nothing becomes more expensive in lost income.
The dollar adds a second lever. Gold is priced in US dollars, so a stronger dollar makes it costlier for buyers in Europe, India or China, which restrains demand. Fed expectations can push yields and the dollar higher well before any hike takes place.
Current readings show why the pressure is real. The fed funds rate sits at 3.75%-4.00%, and CME FedWatch data cited by Reuters prices only about 9% odds of a hike this week. December is a different story, with hike odds of roughly 77%-83% depending on source and time of day (Reuters, Kitco and FXStreet). TD Securities expects hikes in December and March.
| Driver | Direction of move | Effect on gold | Current reading |
|---|---|---|---|
| Real yields (10-year Treasury) | Easing from highs | Higher yields weigh on gold | About 4.98%-4.99%, down from 5.31% |
| US dollar | Firm | Stronger dollar restrains demand | US Dollar Index about 101.83 |
| Fed hike odds | Low now, high for December | Rising odds pressure gold | 9% October; 77%-83% December |
| Central-bank buying | Slower than recent years | Buying supports gold | 170 tonnes year to date through August 2026 |
Why the old playbook has loosened since 2022
From 2000 until Russia’s invasion of Ukraine, rates and the dollar explained much of gold’s behaviour. Since then, central banks diversifying reserves and investors hedging geopolitical risk have added what Nicky Shiels of MKS PAMP calls a structural premium, even though the real-yield framework still anchors valuation.
The scale of official buying shows why. Central banks bought a record 1,136 tonnes in 2022 and 863 tonnes in 2025, according to the World Gold Council (WGC). This year has been patchier, with only 57 tonnes in Q1 before 289 tonnes in Q2. Metals Focus expects 2026 demand to fall 15% to 720 tonnes, though that estimate is less firmly confirmed.
The motive behind sovereign gold buying is jurisdictional safety rather than price appreciation, since vaulted metal cannot be frozen or sanctioned, which is why official demand tends to cushion pullbacks without cancelling the drag from high yields.
The read for you is that a roughly 5% 10-year yield remains a persistent headwind. Central-bank demand cushions it but does not cancel it, so slowing official buying matters more than it first appears.
Where are the support and resistance levels for gold after the bullish engulfing candle?
With the macro drivers mapped, the chart shows where those forces are likely to collide. Monday’s session formed a bullish engulfing candle, a pattern where one day’s price range fully covers the previous day’s after a decline, often read as buyers regaining control.
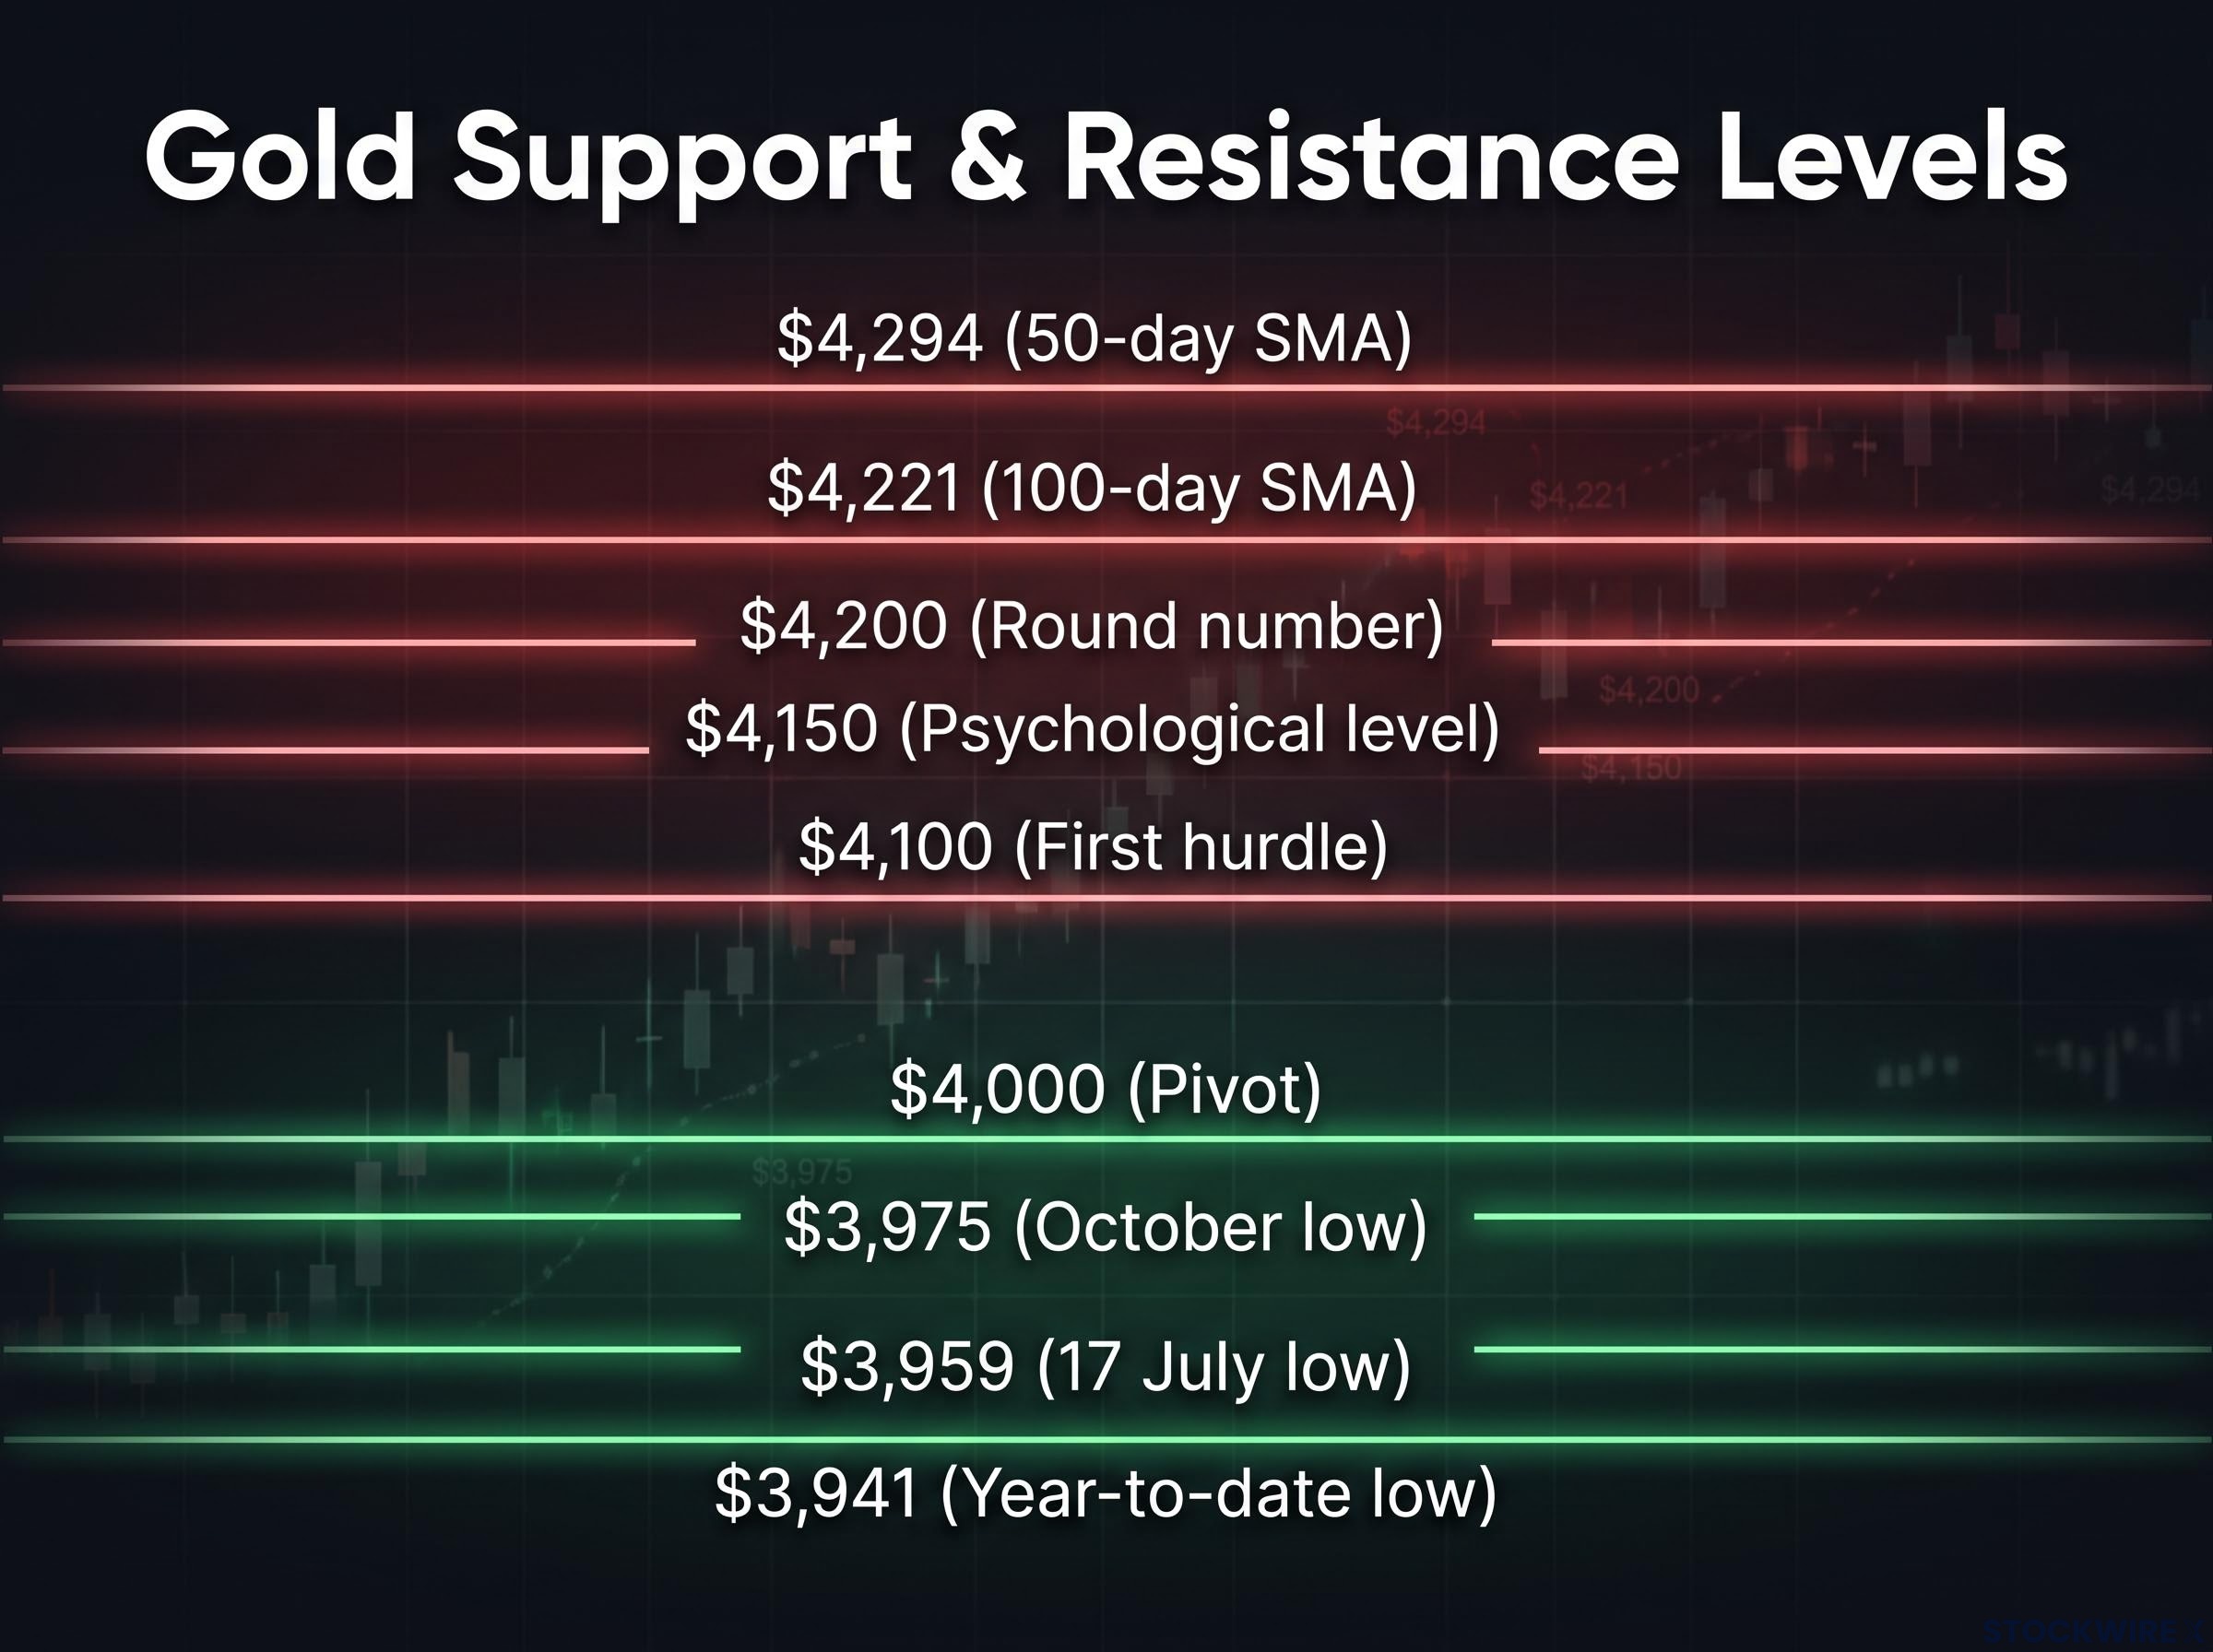
The 14-day Relative Strength Index (RSI), a momentum gauge running from 0 to 100, tells a more cautious story. It remains in bearish territory, though it is turning higher.
| Level | Price | Type | Why it matters |
|---|---|---|---|
| 50-day SMA | $4,294 | Resistance | Medium-term trend marker |
| 100-day SMA | $4,221 | Resistance | Longer trend average overhead |
| Round number | $4,200 | Resistance | Next ceiling after $4,150 |
| Psychological level | $4,150 | Resistance | Widely watched round figure |
| First hurdle | $4,100 | Resistance | Initial test of the rebound |
| Pivot | $4,000 | Support | Has drawn technical and physical buying |
| October low | $3,975 | Support | Immediate downside reference |
| 17 July low | $3,959 | Support | Prior summer floor |
| Year-to-date low | $3,941 | Support | Last line before new 2026 lows |
A simple moving average (SMA) is the average closing price over a set number of days. Both the 100-day and 50-day averages sit above the current price, so gold still trades below its recent trend despite the bounce.
That leaves the candle and the RSI pulling in opposite directions, with $4,000 as the deciding line. You should watch for a daily close below that level rather than an intraday dip, because only a sustained break turns a pullback into a failed rebound.
Longer-range views offer context rather than certainty. A July Reuters poll put the median 2026 forecast at $4,509, and Morgan Stanley has suggested gold could exceed $5,000 in 2027 if the Fed stays on hold, though neither figure has been independently confirmed. Past performance does not guarantee future results, and projections are subject to market conditions and other risks.
What could break the rebound? The Fed, PCE and midterm calendar
The levels tell you where the fight happens. The calendar tells you when.
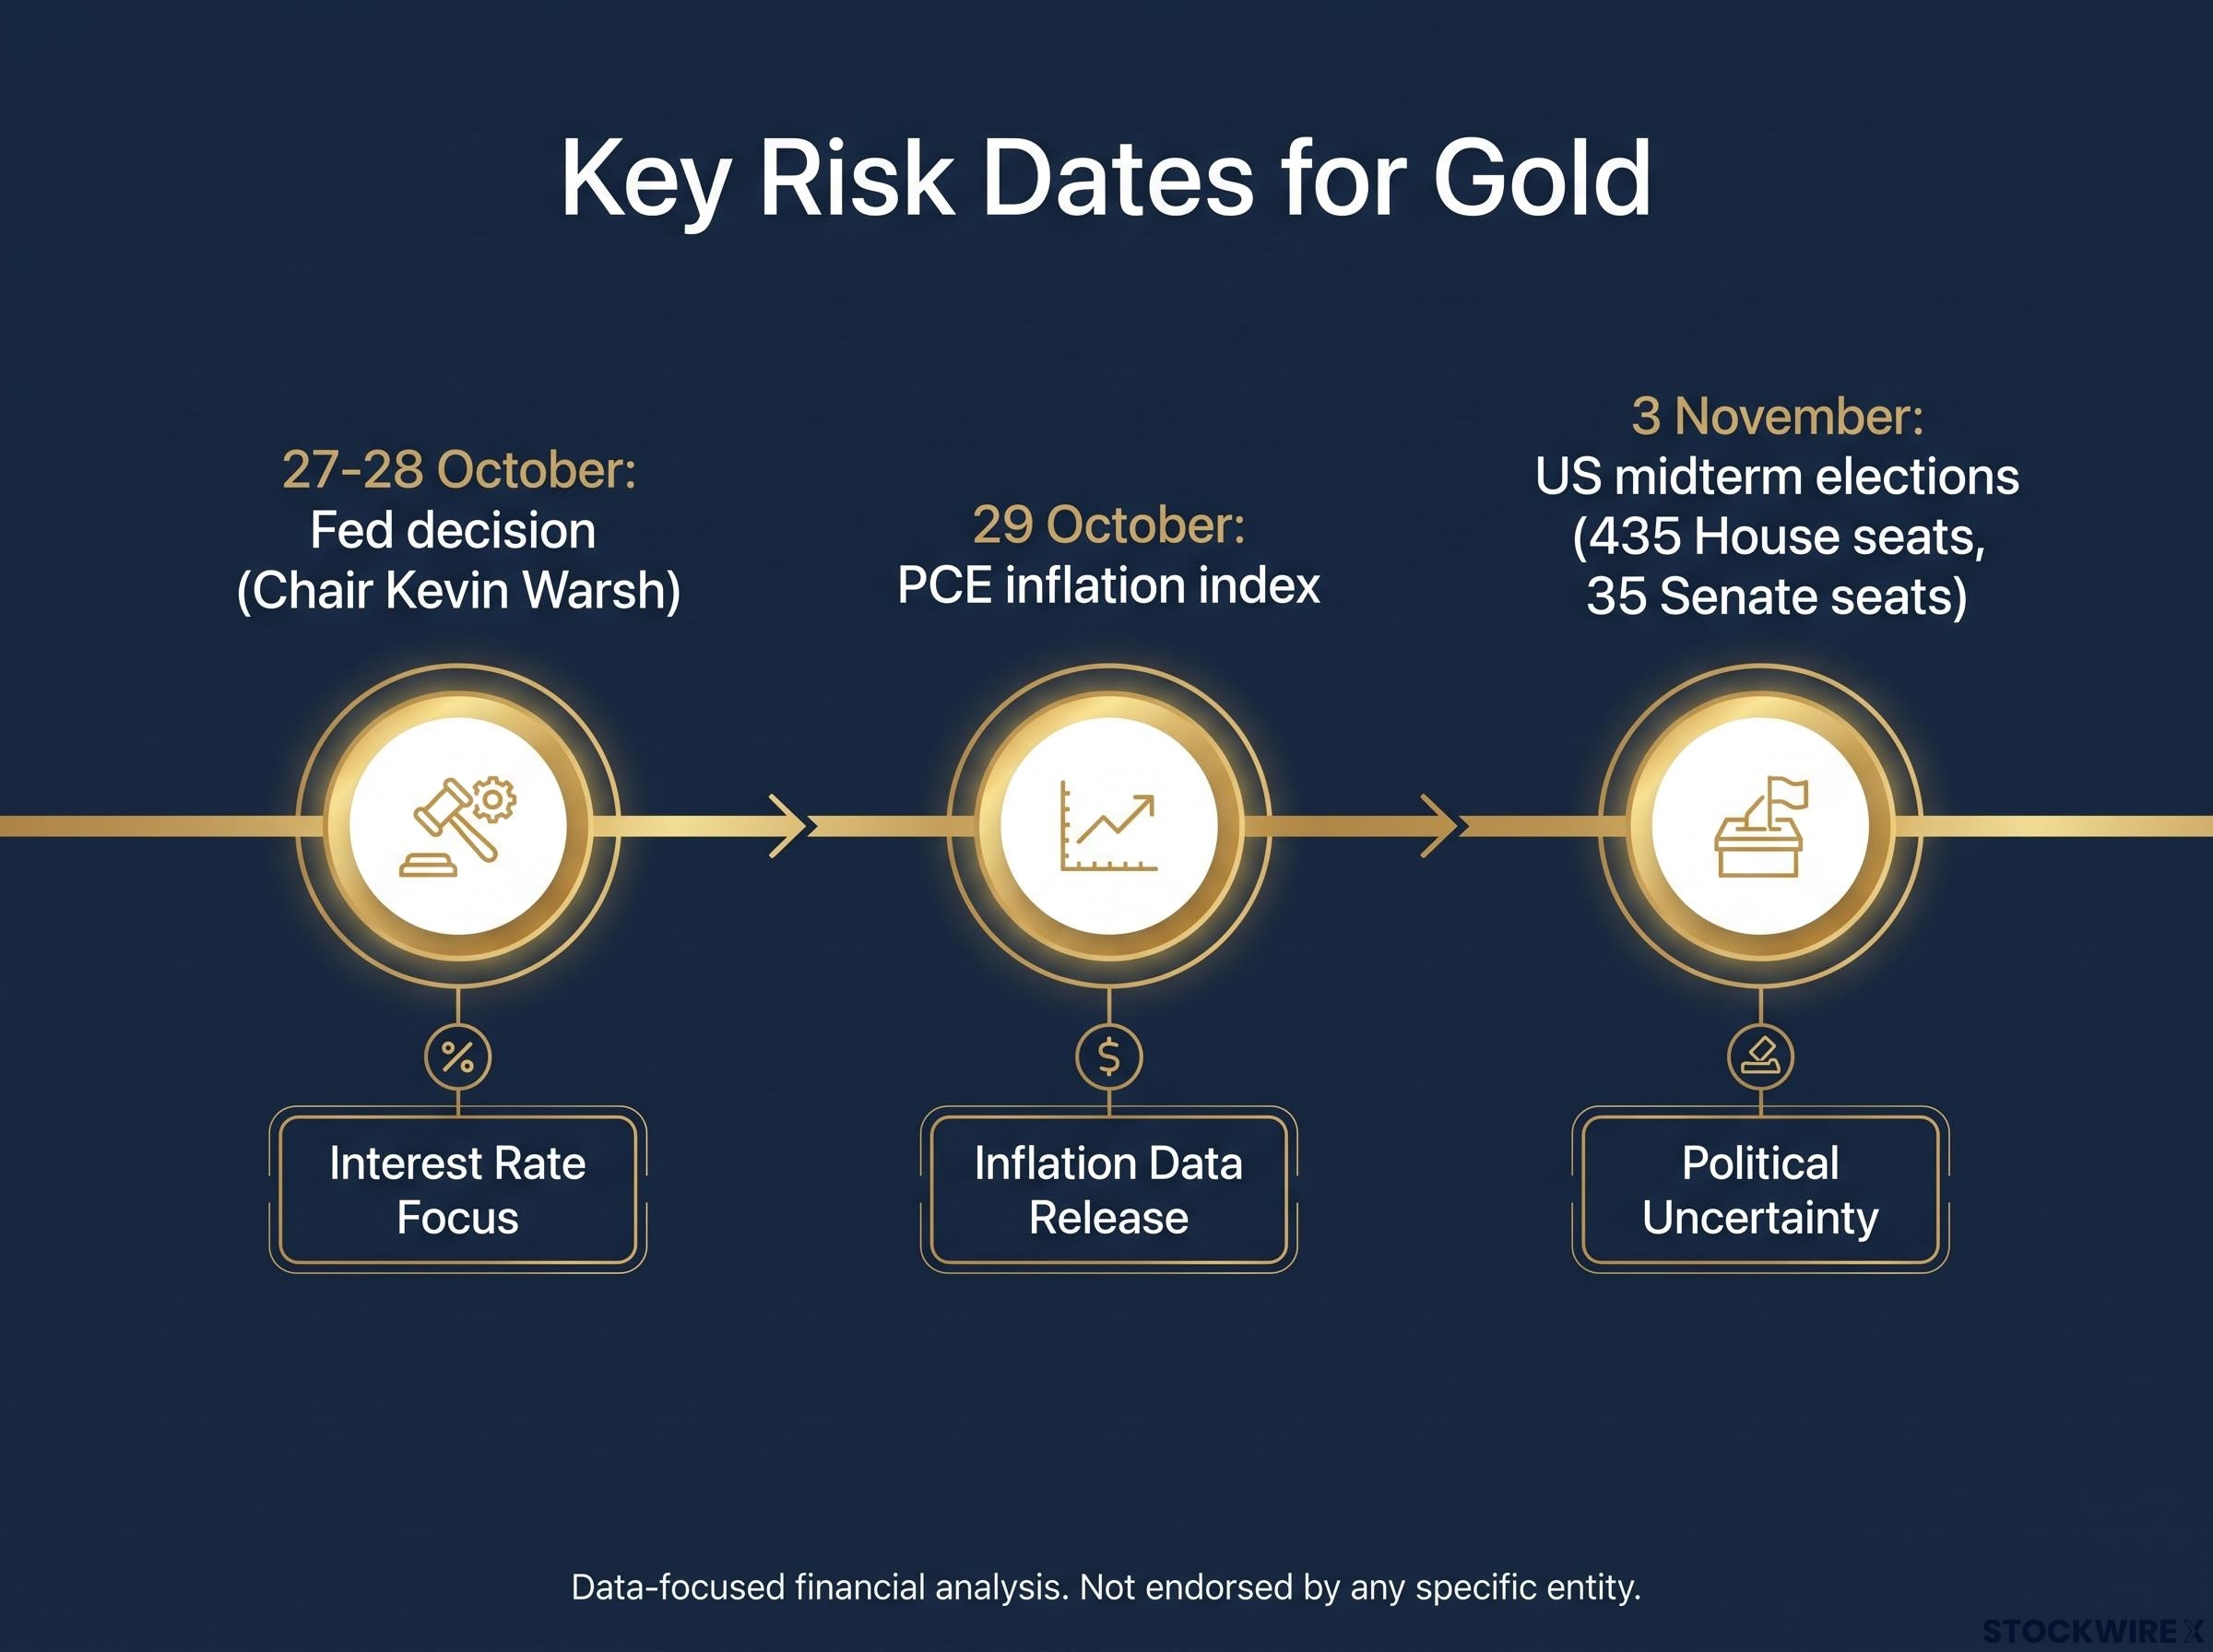
- 27-28 October, Fed decision: a hold is widely expected, but a hold paired with hawkish language could lift yields and pressure gold.
- 29 October, PCE inflation: a hot reading strengthens the December hike case; meaningful cooling would support gold.
- 3 November, US midterms: all 435 House seats and 35 Senate seats are contested, and the result may move the dollar and yields depending on how markets interpret it.
A hold is not automatically good news. TD Securities argues a pause this month could make a December hike more likely if inflation surprises higher, and Warsh may decline to offer guidance at all.
The downside case FXStreet’s analysis argued that gold tends to struggle when interest rates are high, and that a hawkish Warsh could push the metal back below $4,000.
Precedent offers little comfort. State Street Global Advisors has cited Ben Bernanke’s 2006 succession of Alan Greenspan as an example of chair transitions coinciding with conditions that supported gold, but that history is unconfirmed, and a new chair does not automatically lift the metal. UBS’s Staunovo adds that expected December and possibly 2027 hikes cap the upside.
Gold’s record across past Fed hiking cycles is mixed, with averages that look favourable after a first hike but a 2022 episode showing that rapid follow-on tightening can overwhelm structural support, so real yield direction matters more than the headline rate.
Beyond the calendar, several structural risks hang over the rebound:
- Positioning: last week’s sharp fall shows profit-taking can overwhelm fundamentals.
- Slowing official demand: central-bank buying is less dependable than in recent years.
- A durable US-Iran settlement: this could strip out more of the war premium.
- Renewed escalation: strike speculation keeps oil, and the rate channel, volatile.
- Yields near 5%: a heavy, ongoing drag on a metal that pays no income.
You should treat the Warsh press conference as the first test and PCE as the confirmation. A hawkish tone followed by hot inflation would make a retest of $3,975 hard to avoid.
Reading the next two weeks: what would confirm or cancel the rebound
The rebound strengthens if yields keep easing, the Fed holds without signalling a December move, PCE comes in cooler and gold closes daily above $4,000. Under those conditions, $4,100 and $4,150 become realistic tests.
It weakens if Warsh sounds hawkish, PCE runs hot and gold settles below $4,000, opening a path to $3,975 and then $3,959.
With December hike odds sitting at roughly 77%-83%, the bar for sustained upside is high. The levels to monitor are $4,000 and $3,975; the dates are 28 October, 29 October and 3 November.
This article is for informational purposes only and should not be considered financial advice. Investors should conduct their own research and consult with financial professionals before making investment decisions. Forward-looking statements are speculative and subject to change based on market developments.