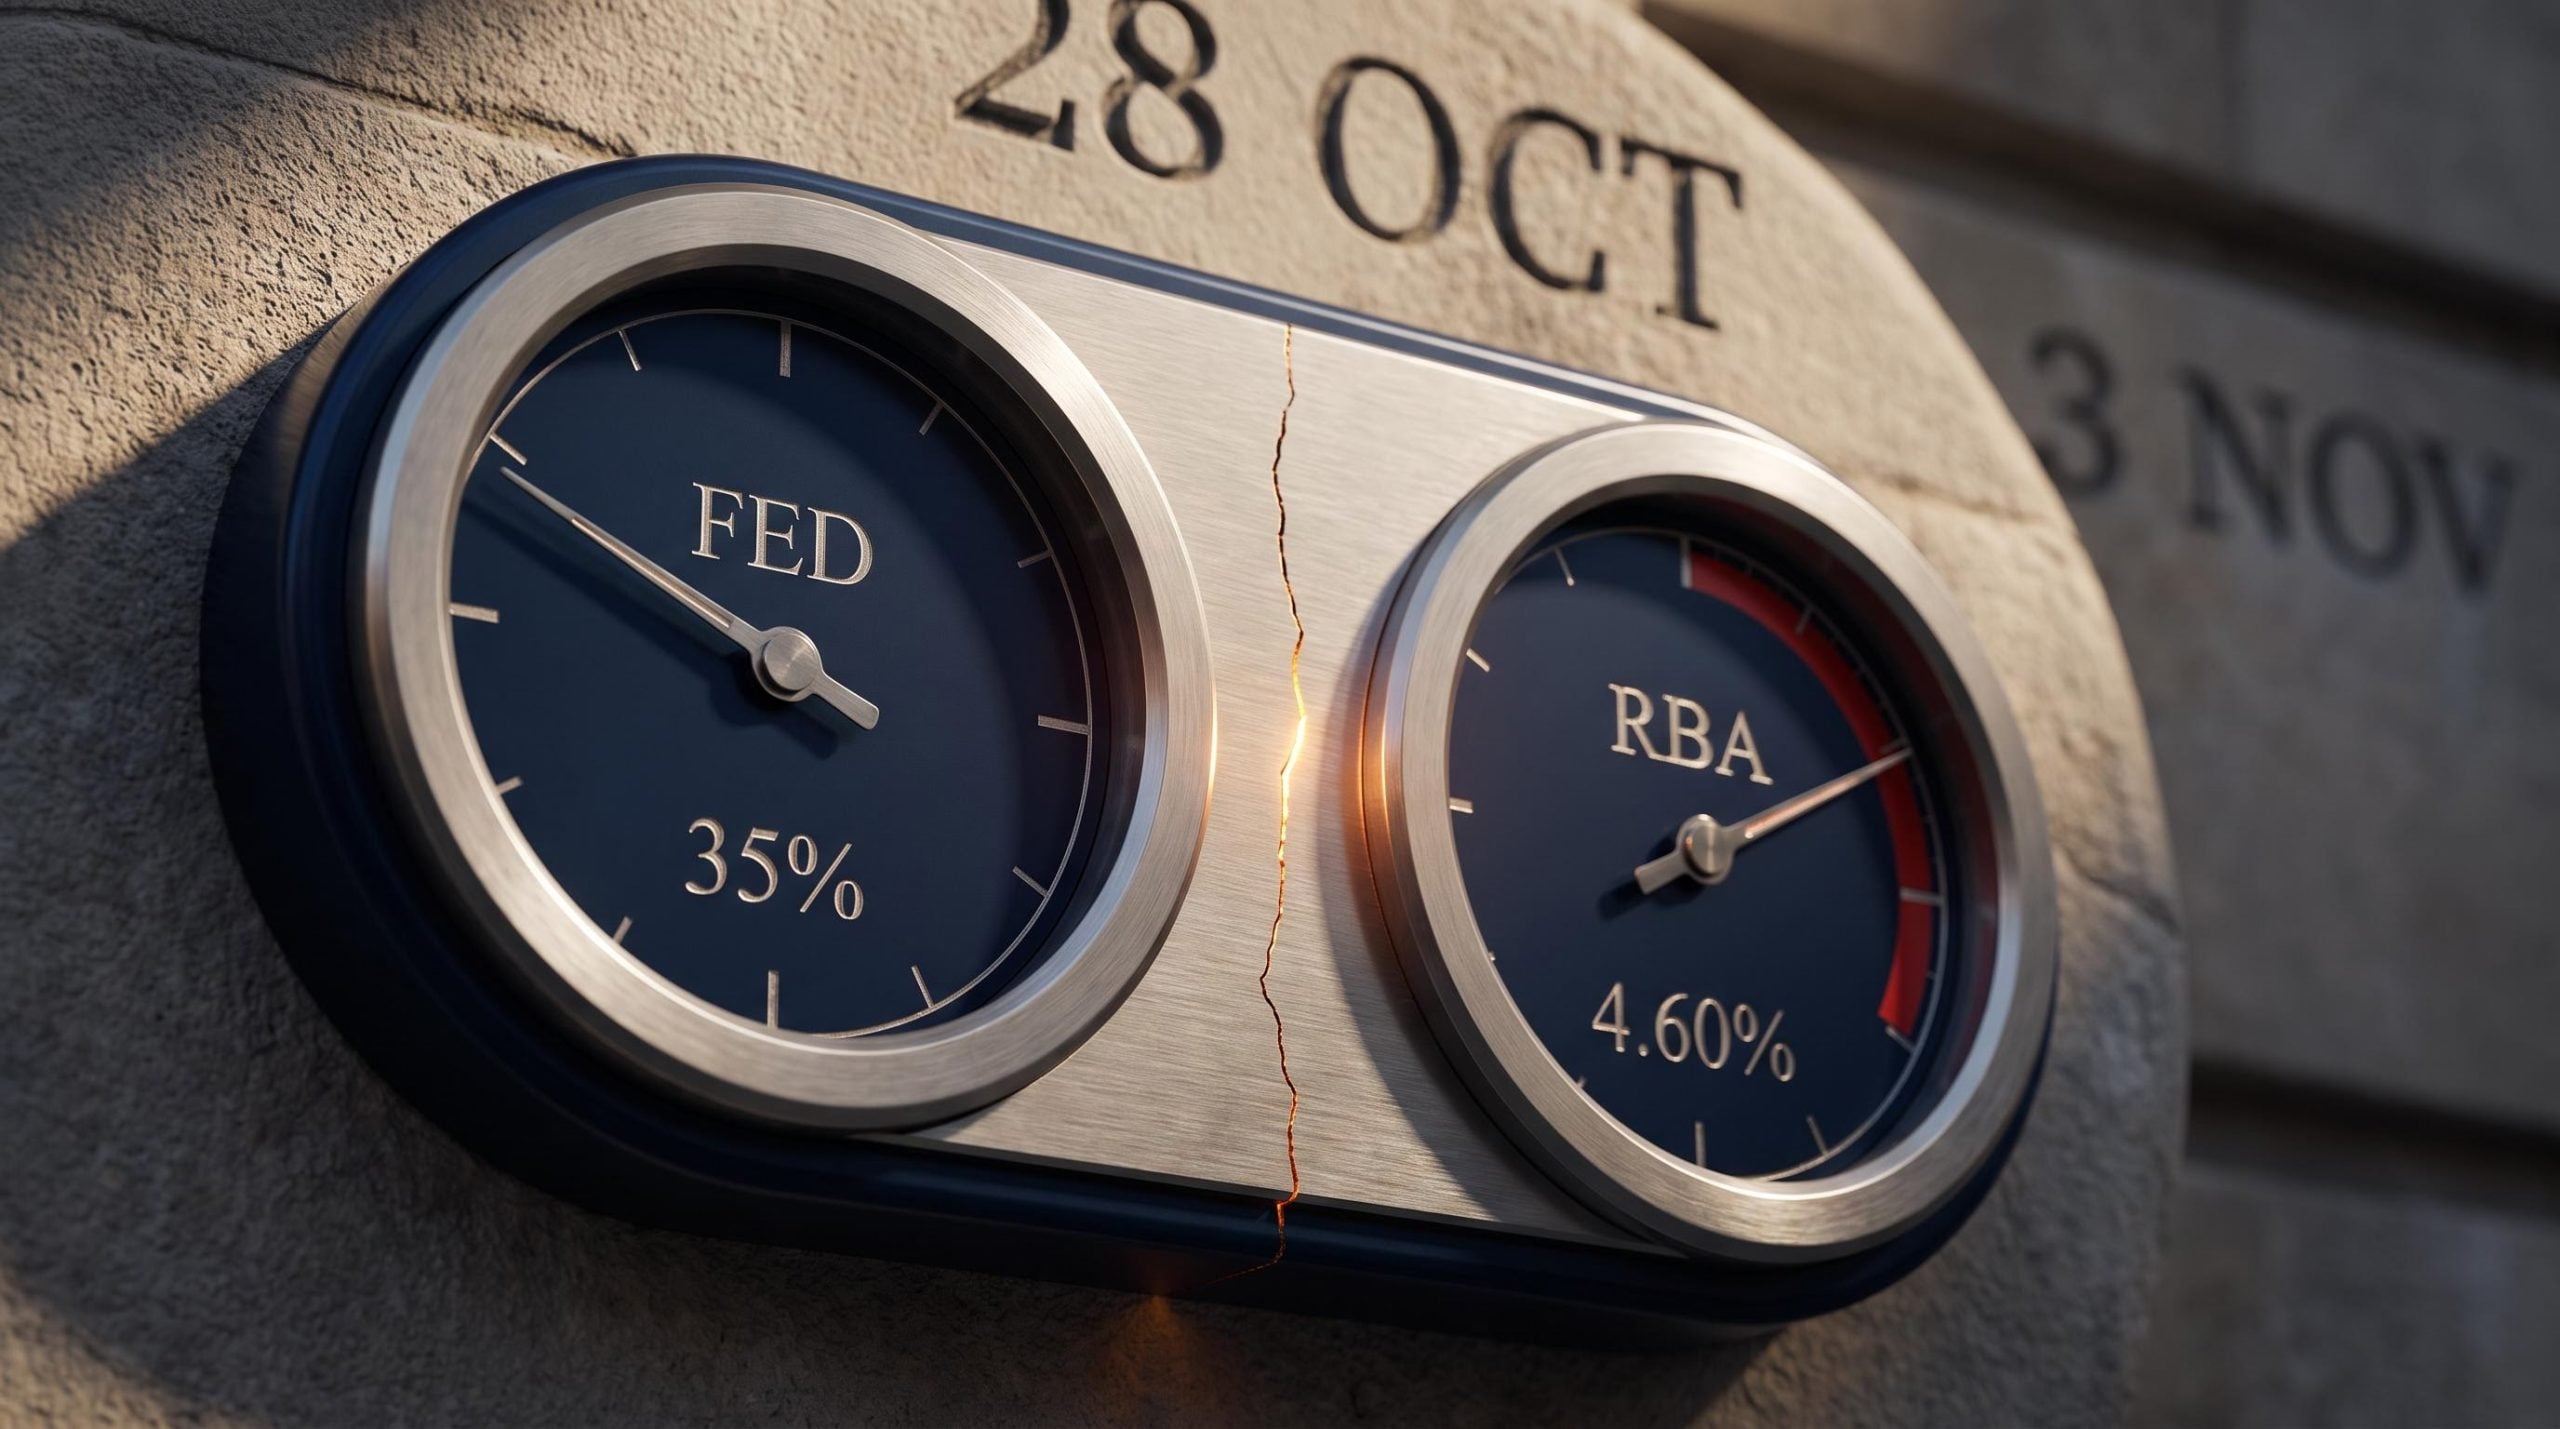
On 4 March 2026, trading halts hit both the KOSPI and KOSDAQ simultaneously. A dual-market circuit breaker activation of this kind is rare enough that it immediately signalled something beyond an idiosyncratic sell-off. The stress was systemic.
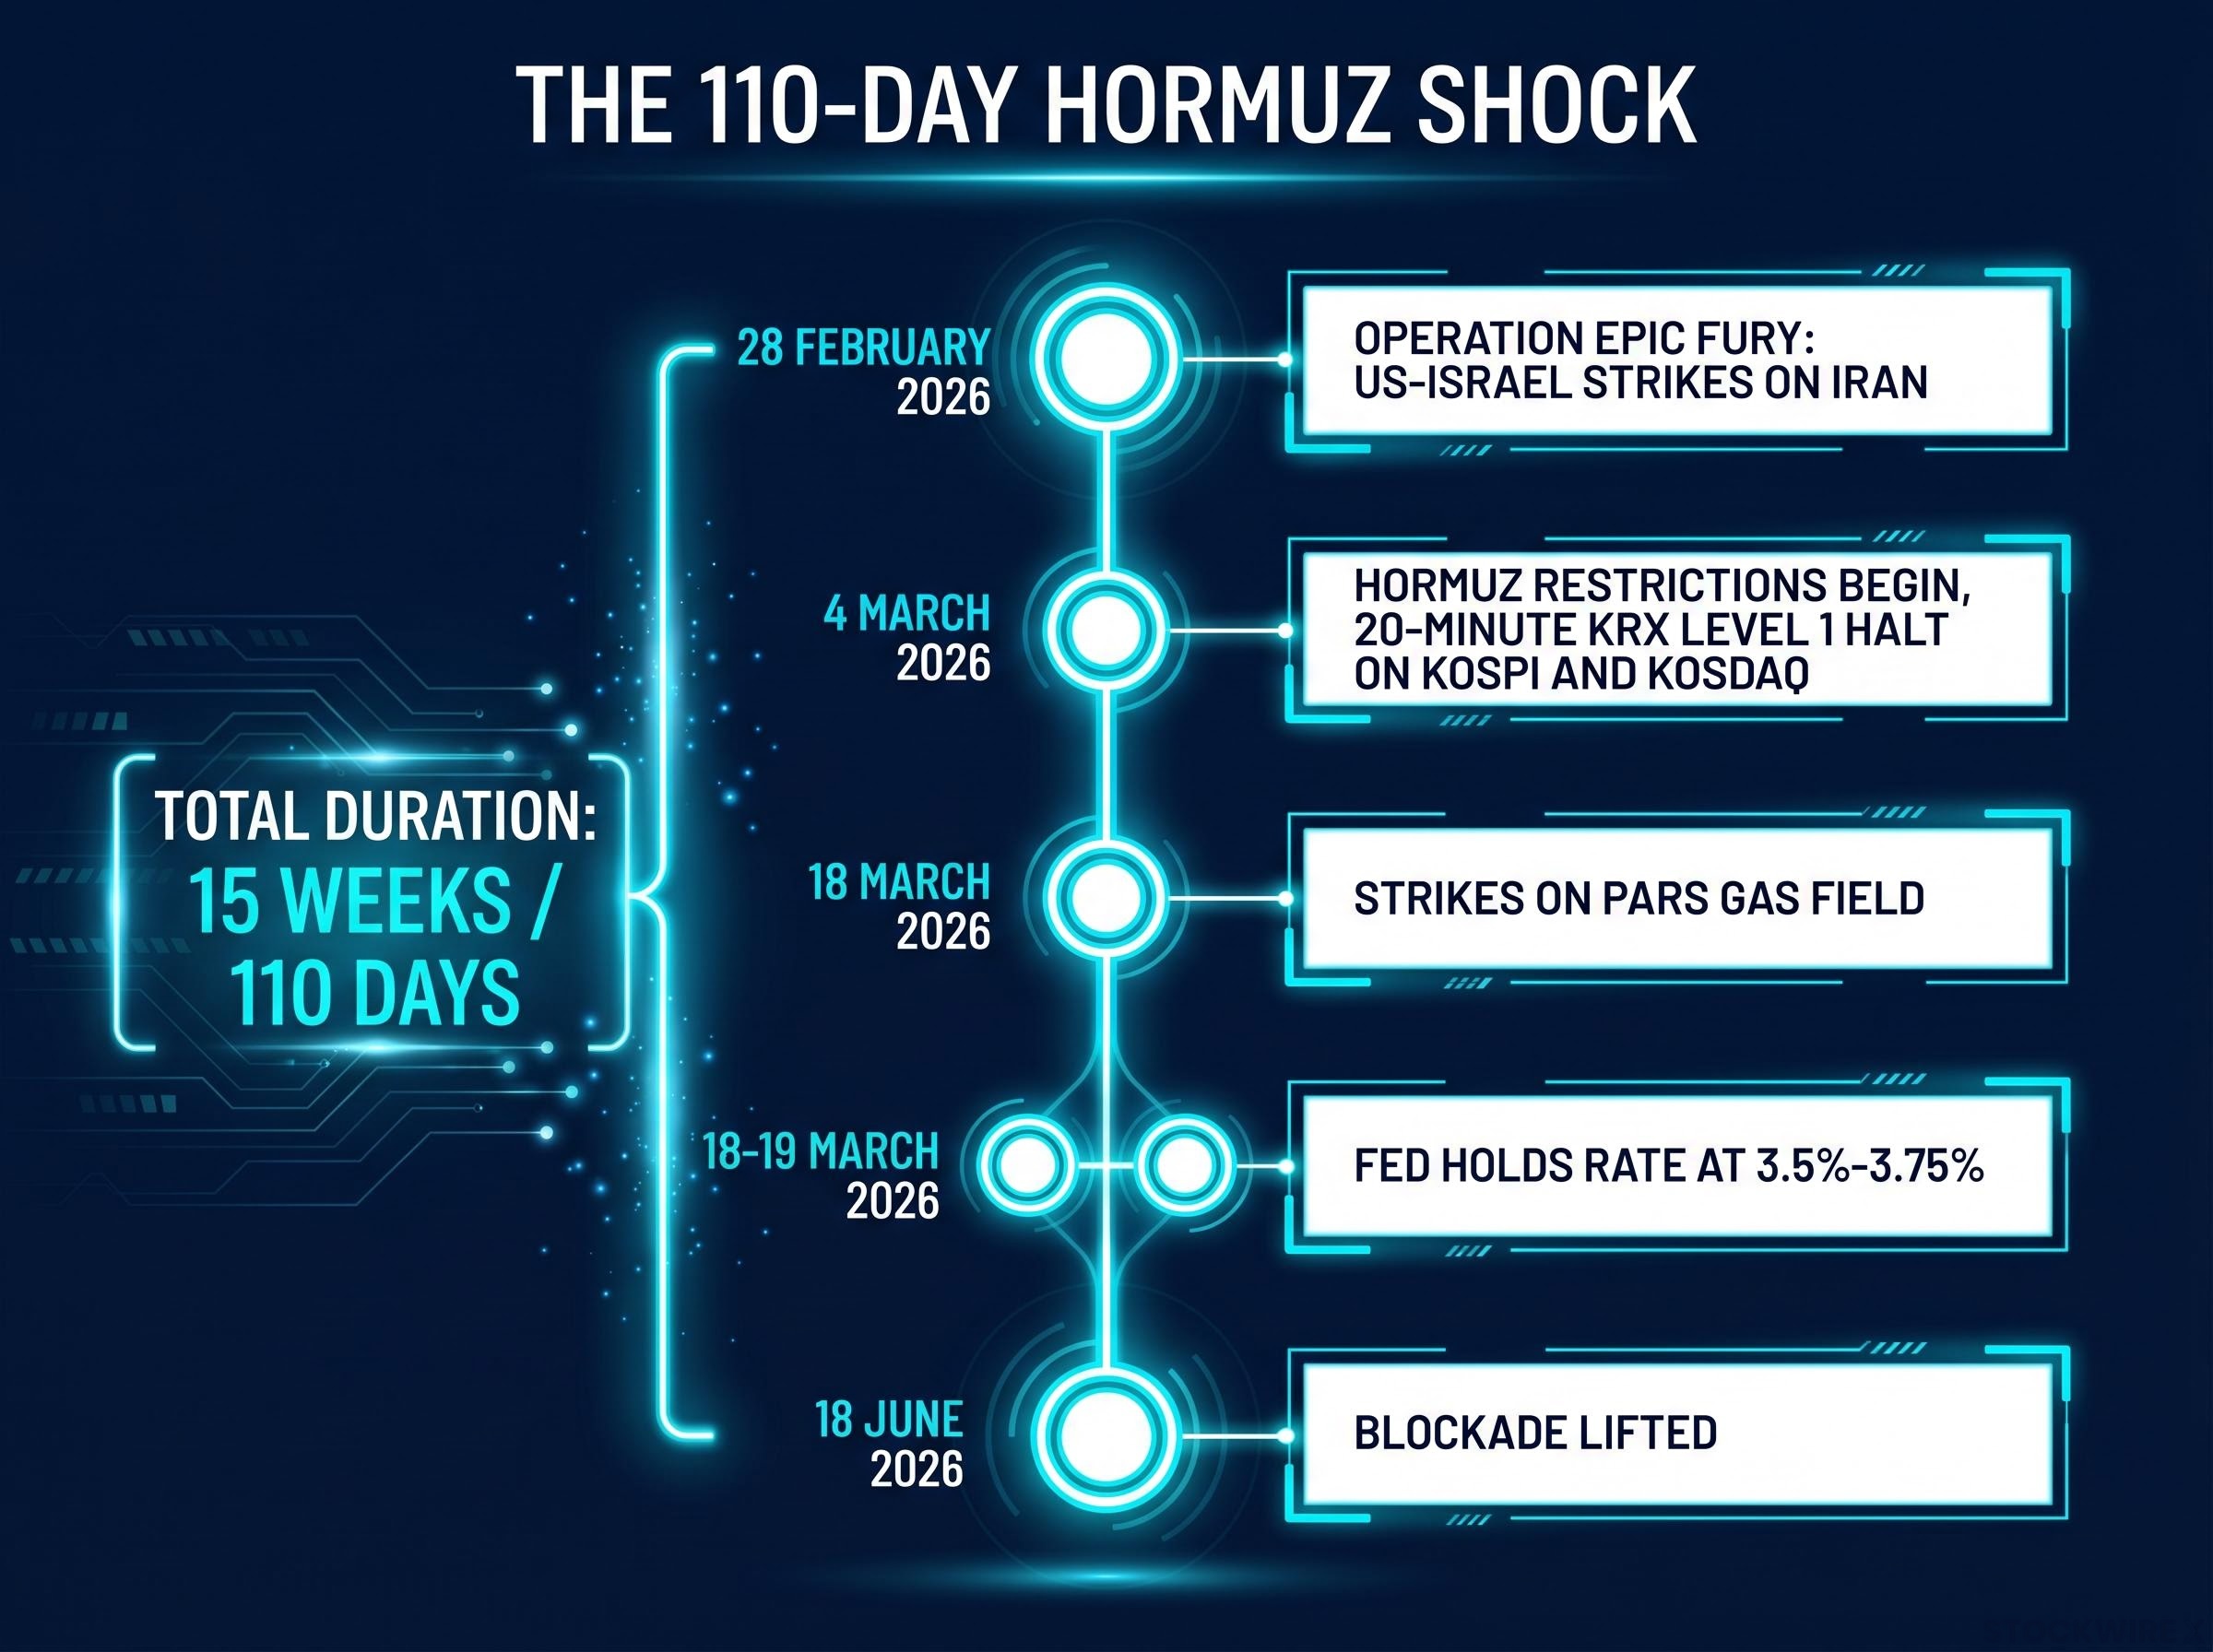
The US-Israel strikes on Iran, initiated on 28 February 2026 under Operation Epic Fury, and the subsequent restrictions on Strait of Hormuz shipping exposed a structural vulnerability that most equity portfolios price as a tail risk rather than a central one. For Asia-Pacific investors, the 110 days between the first strike and the 18 June de-escalation became a live case study in how geopolitical risk transmits through energy-dependent economies and into equity prices.
This analysis traces the mechanism by which a military trigger 5,000 kilometres from Seoul and Tokyo produced double-digit index losses, circuit breaker activations, and concentrated sector collapses. It draws out the repeatable structural lessons for investors carrying Asia-Pacific exposure.
The Hormuz chokepoint turned a military strike into a supply chain crisis
Before the economics, the geography. The Strait of Hormuz is 21 miles wide at its narrowest point. Every tanker transiting between the Persian Gulf and open ocean passes through it. There is no alternative route.
The numbers that define the exposure are difficult to overstate:
EIA Hormuz transit data covering the first half of 2025 recorded average flows of 20.9 million barrels per day through the strait, equivalent to roughly 20% of global petroleum liquids consumption, with 89% of that crude and condensate volume destined for Asian markets, a distribution that maps directly onto the concentrated equity losses observed in Seoul and Tokyo during the 2026 disruption.
- The Strait of Hormuz handles roughly 20% of global seaborne oil and a significant share of global liquefied natural gas (LNG) trade
- Japan routes over 90% of its crude oil imports through the strait in normal periods
- South Korea faces a similarly elevated structural dependency on the same passage
Japan’s 90%-plus crude import dependency on Hormuz routing makes the chokepoint a near-total single point of failure for the country’s energy supply.
When Iran declared restrictions on Hormuz traffic effective approximately 4 March 2026, the disruption was not a rumour or a threat. Vessels were rerouted via longer, costlier alternatives. Shipping was physically constrained.
What separated this episode from shorter Middle East flare-ups, where markets tend to recover within days, was duration. The restrictions persisted for approximately 15 weeks, from early March through 18 June 2026. That window was long enough to exhaust inventory buffers, force real supply chain rerouting, and trigger structural repricing rather than temporary volatility.
When big ASX news breaks, our subscribers know first
Why Asian equity markets broke while Western indices bent
The 18 March 2026 escalation day, when further strikes targeted Iranian assets including the Pars gas field area, provides the cleanest comparative snapshot. On that single session, the divergence between Asian and Western markets was not marginal. It was structural.
| Index | Move | Period |
|---|---|---|
| KOSPI | -12% | Crisis period, March 2026 |
| Nikkei 225 | -6.3% | Post-outbreak decline, February-March 2026 |
| DAX 40 | ~-8% | February-March 2026 window |
| S&P 500 | -1.36% | 18 March 2026 |
| Dow Jones | -1.63% | 18 March 2026 |
| Nasdaq | -1.46% | 18 March 2026 |
| STOXX 600 | -0.7% | 18 March 2026 |
The gap between a -12% KOSPI drawdown and a -1.36% S&P 500 decline on the same geopolitical event is not noise. It is a function of energy import geography.
Europe sits in between, and the DAX 40’s approximately -8% drawdown across the crisis window reflects a more mixed picture. Post-2022 diversification away from Russian gas, toward LNG imports and accelerated renewables buildout, partially insulated European markets. Some travel and chemical sector names even posted gains during the broader turmoil. The sector damage in Europe was heterogeneous; in Korea and Japan, it was concentrated and severe.
How an oil shock travels through a semiconductor economy
Semiconductor equities are not purely technology risk assets. They carry embedded energy and macro sensitivity that standard sector classification understates. The Hormuz disruption exposed this through four distinct channels:
- Higher energy costs compressed fab margins. Semiconductor manufacturing facilities are energy-intensive operations, and rising power costs cut directly into profitability.
- Supply chain rerouting elevated logistics costs and extended lead times for components as vessels took longer, more expensive alternative routes.
- Reduced global demand expectations emerged as the oil shock raised recession risk, dampening the outlook for consumer electronics and industrial semiconductor demand.
- Risk-off sentiment hit high-beta technology names disproportionately, as indiscriminate selling pressure concentrated in the most volatile corners of the market.
The Korea Exchange (KRX) activated Level 1 circuit breakers on both the KOSPI and KOSDAQ on 4 March 2026, halting trading for 20 minutes. Simultaneous dual-market activation is rare and signals systemic rather than idiosyncratic stress.
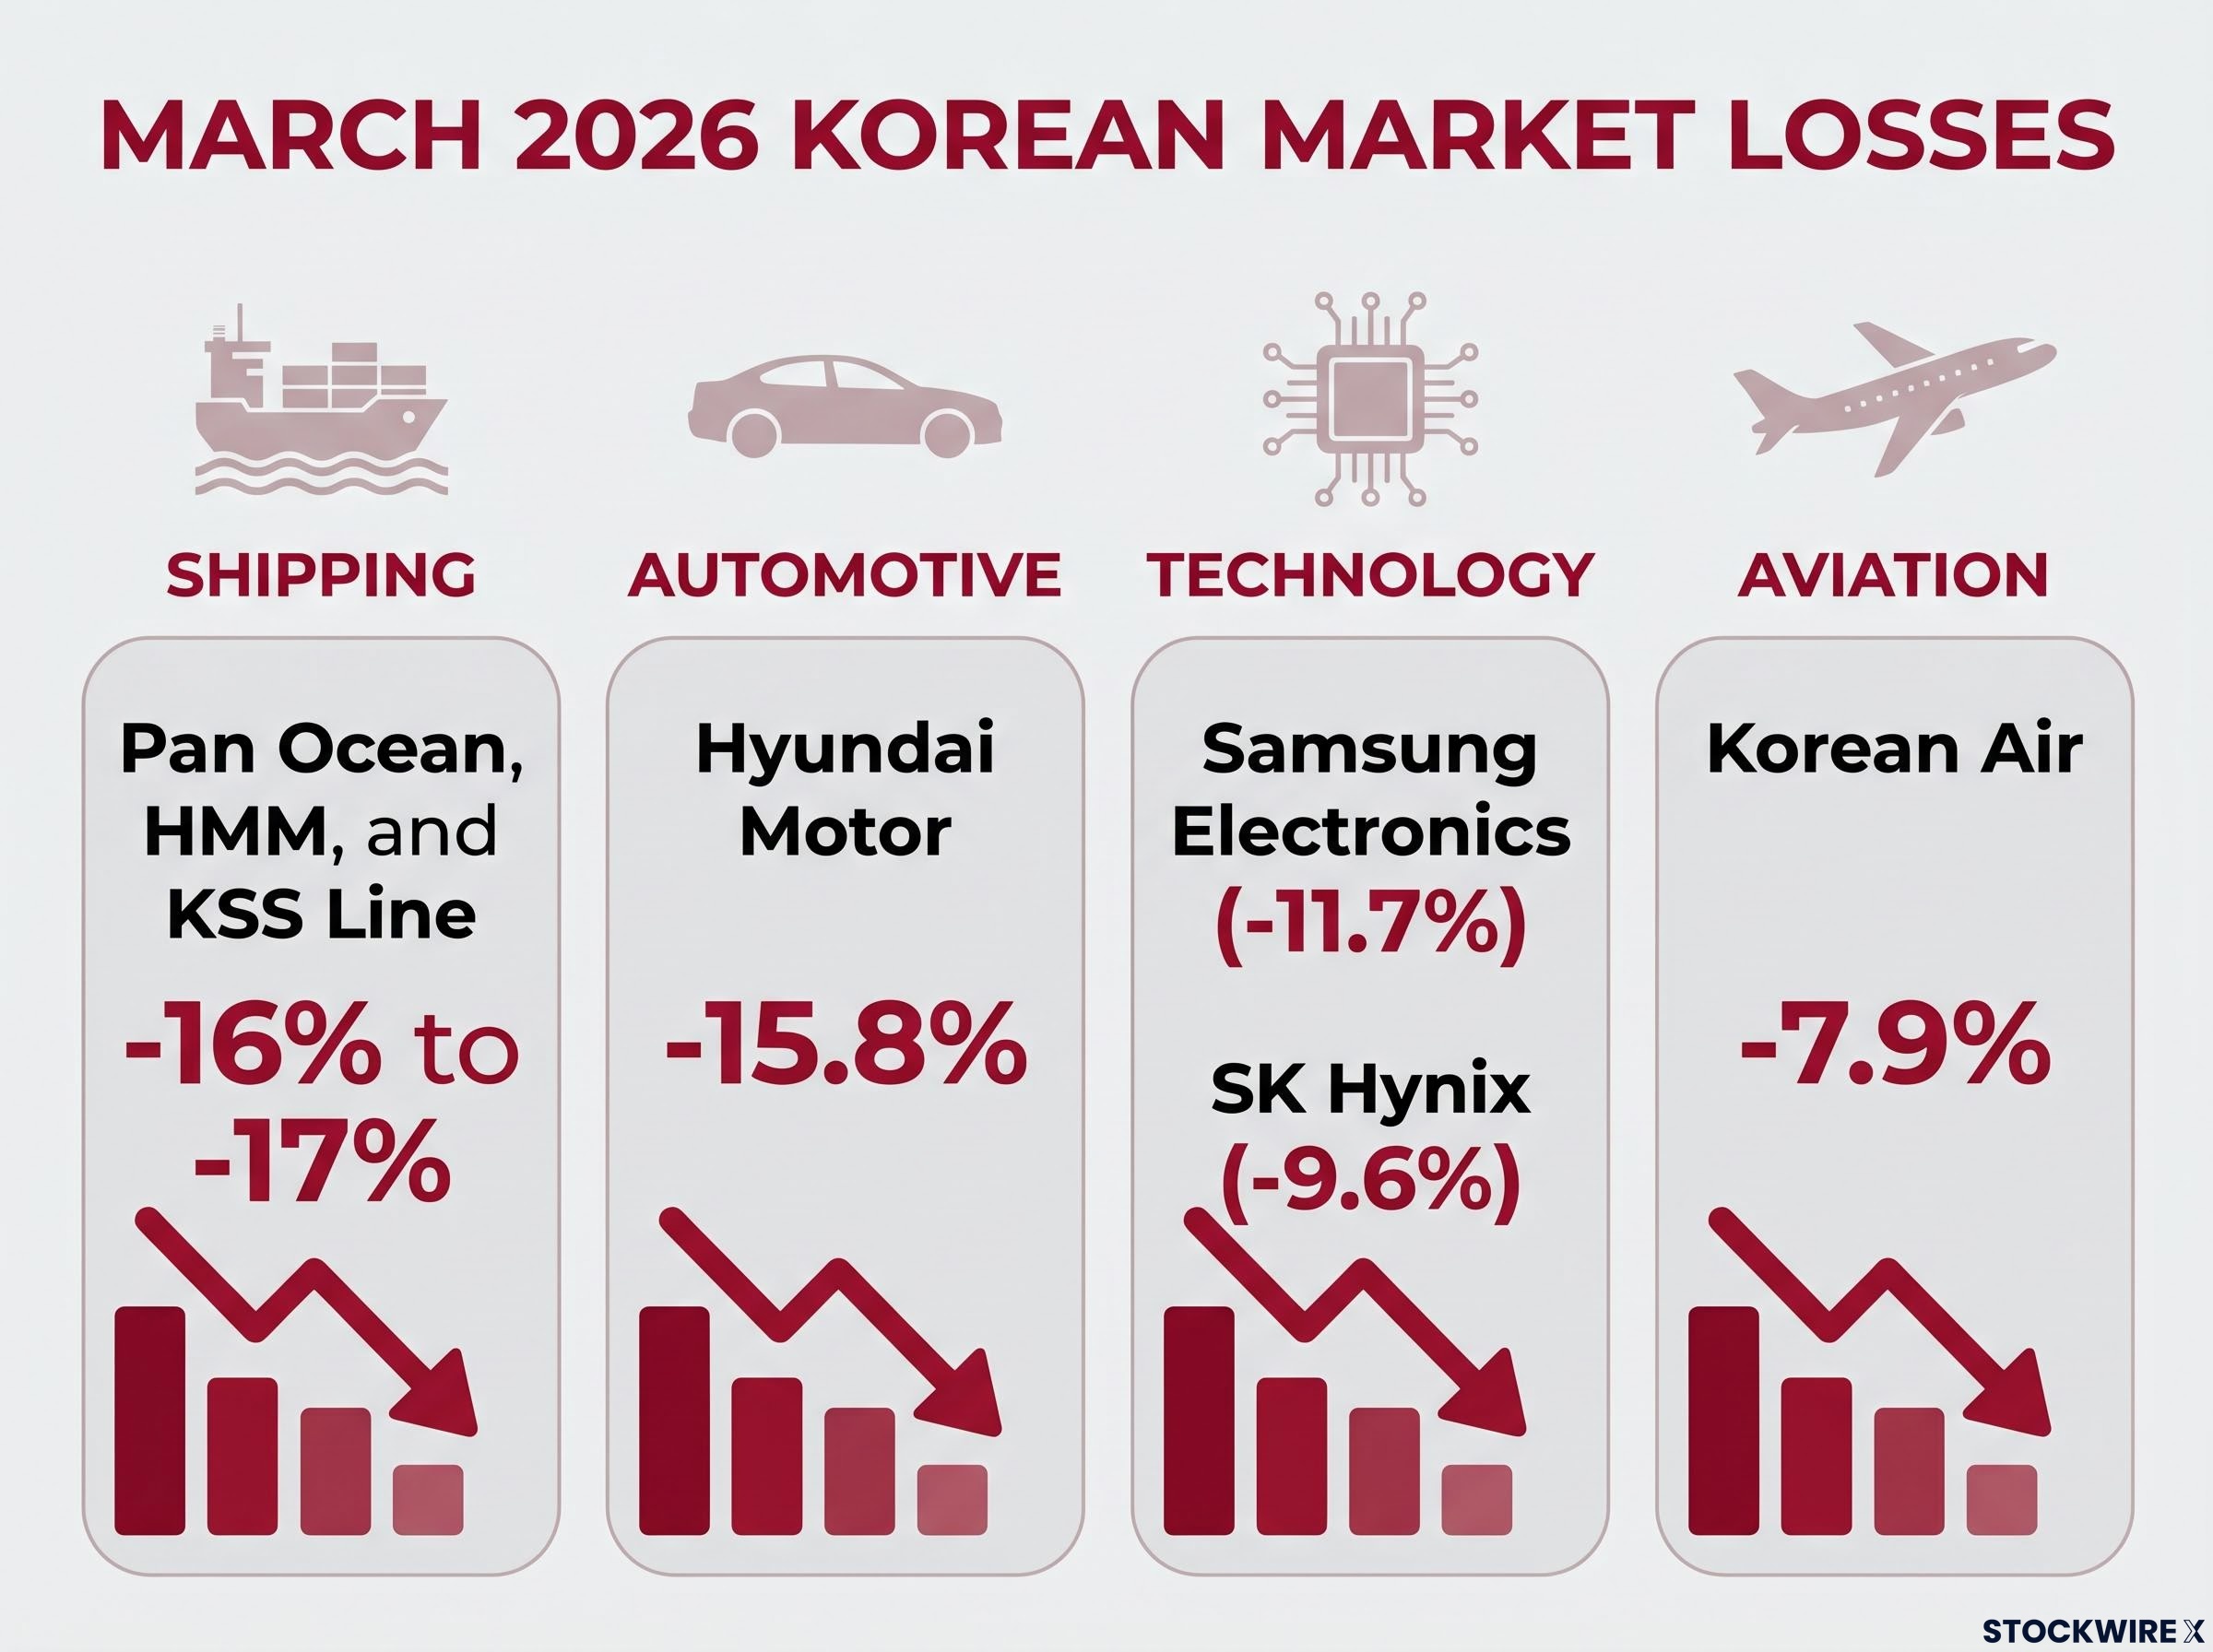
Sector losses across the Korean market, March 2026
The price data confirms that the transmission channels operated across sectors, not just within semiconductors. Samsung Electronics fell -11.7%. SK Hynix declined -9.6%. Hyundai Motor dropped -15.8%, and Korean Air lost -7.9%.
The shipping sector absorbed the most direct operational hit. Pan Ocean, HMM, and KSS Line each fell between -16% and -17%, reflecting the immediate cost of Hormuz rerouting on companies whose margins are directly tied to freight economics.
Investors who model Samsung or SK Hynix purely as demand-cycle plays will systematically underprice their vulnerability to Middle East supply disruptions. These are technology positions with meaningful energy risk embedded in their cost structures.
The same energy-transmission logic produced semiconductor sell-offs across multiple markets simultaneously, with Samsung Electronics falling roughly 8.6% and ASML declining approximately 4.5% on the same session in May 2026, confirming that the sector’s vulnerability to Hormuz disruptions is not confined to Korean fabs but extends to the global chip supply chain.
The Hormuz shock as a primer on geopolitical risk transmission
Understanding how a military strike in the Persian Gulf becomes a -12% equity drawdown in Seoul requires tracing a sequential chain. Each link is distinct, and the chain only produces severe market outcomes when all links activate:
- Geopolitical trigger: Military action creates instability in a region that controls a critical resource flow
- Chokepoint activation: The instability restricts or closes a physical transit route with no viable short-term alternative
- Supply constraint: Restricted transit forces rerouting, raises transport costs, and reduces available supply volume
- Cost and demand impact: Higher input costs compress corporate margins while simultaneously raising recession risk, reducing forward demand expectations
- Equity repricing: Compressed margins, lower demand, and risk-off flows converge to reprice equity multiples, particularly in high-beta and energy-sensitive names
Duration is the variable that determines whether this chain produces a temporary dip or a structural re-rating. Short disruptions allow inventory drawdowns and forward hedges to absorb the shock. When disruptions last 15 weeks, as this one did, inventories deplete, hedges expire, and the cost absorption becomes permanent enough to force earnings revisions.
The Federal Reserve held its benchmark rate at 3.5%-3.75% at its 18-19 March 2026 meeting, as energy-driven inflation complicated the path to monetary easing.
This rate hold illustrates the compounding second-order effect. Rising energy costs feed inflation, which constrains the central bank’s ability to cut rates, which tightens financial conditions, which applies additional downward pressure on equity valuations. For energy-import-dependent economies carrying dollar-denominated energy costs, the stagflation channel (simultaneous stagnant growth and persistent inflation) amplifies the direct energy cost hit.
Energy-driven inflation and rate policy interact in ways that compound the direct equity impact: when oil costs raise headline CPI, central banks operating under a look-through posture face pressure to signal tightening rather than easing, which tightens financial conditions and applies a second layer of downward pressure on equity multiples in the same markets already absorbing higher energy costs.
What the East-West divergence reveals about portfolio construction
The structural asymmetry between KOSPI -12% and S&P 500 -1.36% on the same geopolitical event is the quantitative case for treating Strait of Hormuz disruption risk as a central rather than peripheral factor in any portfolio with meaningful Korean or Japanese equity exposure.
Japan and South Korea’s 90%-plus Hormuz dependency makes this a non-diversifiable systemic risk within Asian equity allocations. Diversifying across Korean sectors does not hedge it. Diversifying across Korean and Japanese markets does not hedge it. The risk is geographic and structural.
The Brent-Dubai benchmark divergence that emerged during the crisis, with Dubai crude reaching approximately $260 per barrel against a Brent price near $108, represents a structural analytical failure point for any cost model built on the global headline benchmark, as Asian refiners, current account projections for Japan and South Korea, and energy-sector earnings estimates were each priced using a figure that understated actual import costs by 140-170%.
Hedging instruments for Hormuz exposure
Three categories of hedging instruments address distinct channels of the transmission mechanism:
- Index options: Downside options on KOSPI and Nikkei 225 futures provide direct protection on the most exposed markets. The cost of maintaining these positions during periods of calm is the price of structural preparedness.
- Crude oil longs: Long energy positions act as a natural correlation hedge, appreciating when the same supply disruption that damages energy-import-dependent equities drives oil prices higher.
- FX hedges: Yen and won depreciation under sustained energy inflation is a predictable secondary effect. Currency hedges protect against the compounding FX drag on portfolio returns.
The Europe-versus-Asia comparison also offers a structural relative value framework. European markets, with greater energy diversification following the post-2022 pivot away from Russian gas, demonstrated materially lower sensitivity to the same Hormuz shock. This asymmetry is a positioning input, not merely a post-hoc observation.
Fifteen weeks that repriced geopolitical risk for Asian equities permanently
The blockade lifted approximately 18 June 2026, following a memorandum of understanding. The immediate crisis resolved. The underlying structural exposure did not.
For investors wanting to trace how the de-escalation actually transmitted into equity prices, our full explainer on the US-Iran truce and Asian equity recovery covers the KOSPI’s 4.6-5.6% single-session rally, the lagged recovery in VLCC hire rates, and the unresolved nuclear track that places a structural ceiling on how far the geopolitical risk premium can decompress.
Five lessons from this episode form an integrated framework for evaluating future geopolitical shocks involving energy supply routes:
- Hormuz as systemic risk: For Japan and South Korea, Strait of Hormuz disruption is a non-diversifiable, systemic vulnerability, not a tail event to be priced at zero in calm periods
- Circuit breakers as stress signals: Simultaneous activation across dual markets (KOSPI and KOSDAQ) is a rare, high-signal indicator of systemic rather than idiosyncratic stress
- Semiconductors carry energy risk: Chip-sector equities transmit oil shocks through at least four distinct channels, making them energy-sensitive positions regardless of their sector classification
- Duration drives repricing depth: The difference between a two-day flare-up and a 15-week disruption is the difference between a dip and a structural re-rating
- East-West asymmetry is repeatable: The gap between Asian and Western market responses is a function of energy import geography, not investor sentiment, and will reproduce in future Hormuz scenarios
The lesson is not to avoid Asian equities when Middle East tensions rise. The lesson is that a specific, identifiable structural dependency produces a quantifiable response function. Investors who model it, hedge it, and incorporate it into position sizing before the next disruption will carry a structural advantage over those who continue to treat it as an unforeseeable shock.
This article is for informational purposes only and should not be considered financial advice. Investors should conduct their own research and consult with financial professionals before making investment decisions. Past performance does not guarantee future results, and the analytical framework presented here is subject to revision as geopolitical and market conditions evolve.