Here is a number that should stop you before you place a single trade this morning: depending on which tool you check, futures markets put the odds of a Federal Reserve rate hike tomorrow at somewhere between 77.5% and 93%. That near-certainty is not the reassurance it looks like. When a hike is this widely expected, the hike itself may barely move the US dollar at all.
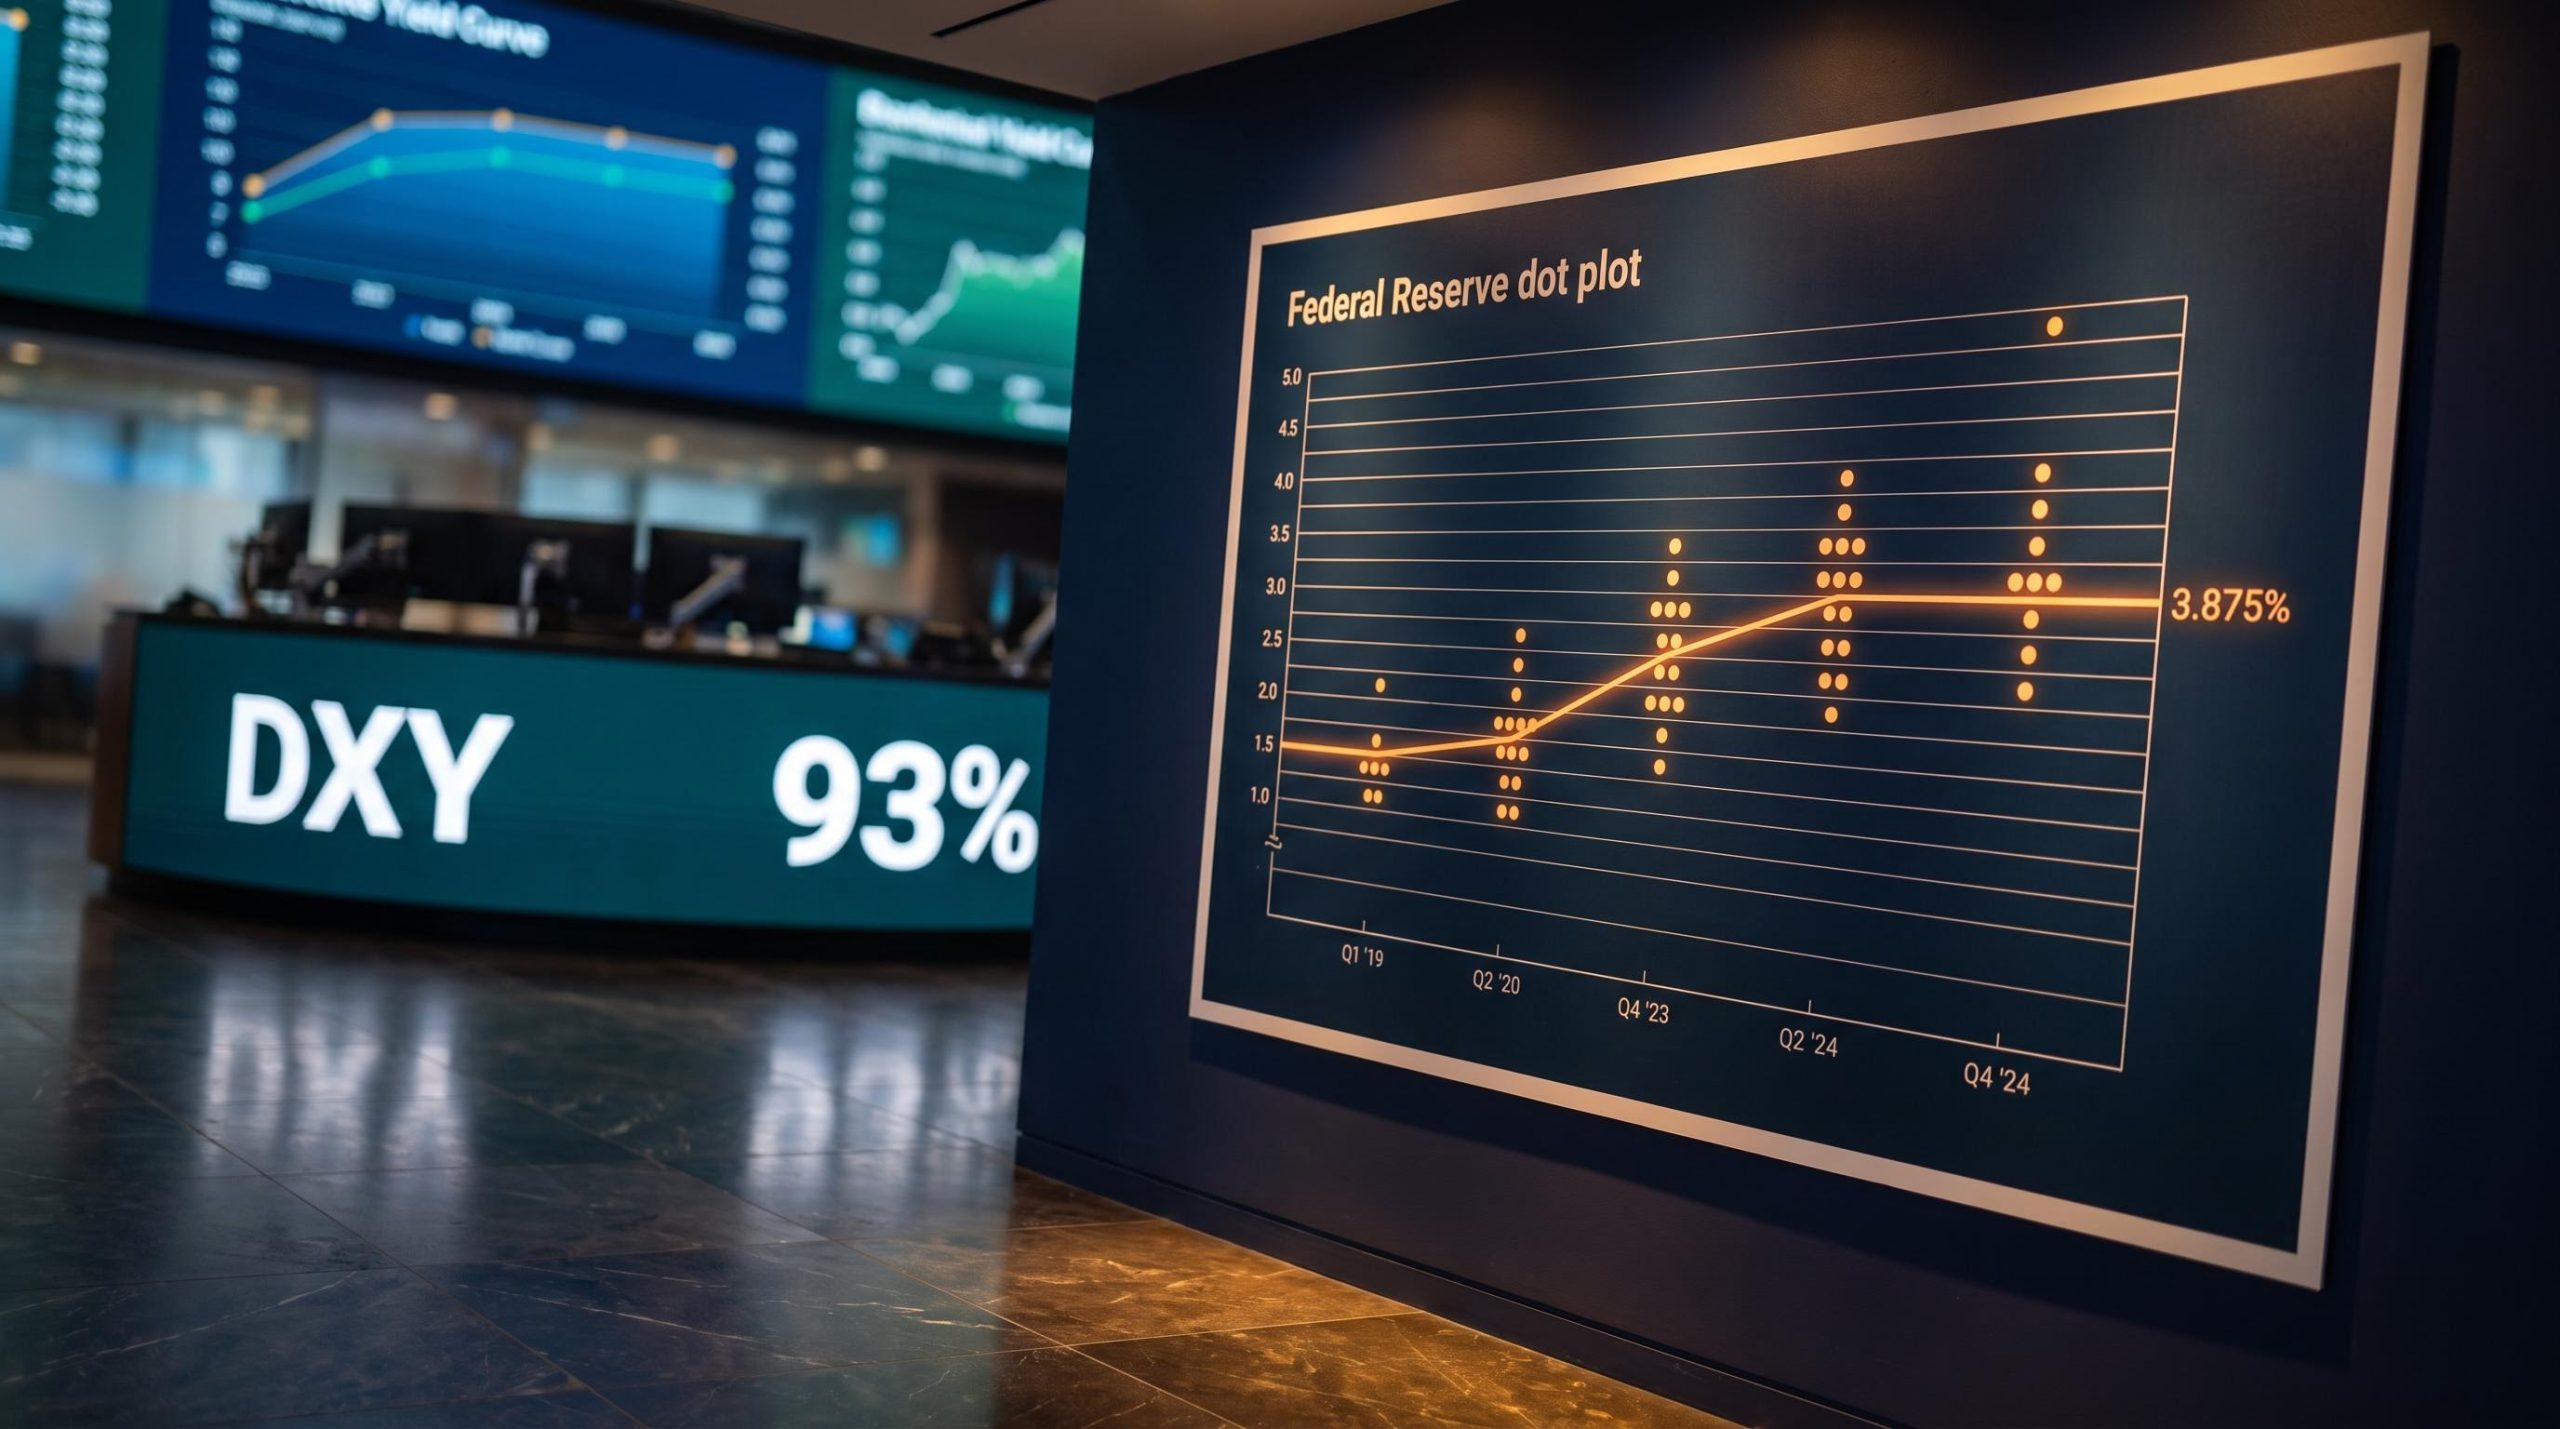
The September 15-16 FOMC meeting is a Summary of Economic Projections (SEP) meeting, which means the rate decision arrives wrapped in an updated dot plot (the chart of individual policymakers’ rate expectations) and fresh economic forecasts. That packaging changes everything, because the vote and the dots can point in opposite directions, and the dollar responds to both at once.
Here is a clear framework for reading the FOMC decision and its effect on the US dollar in real time: what each of the three most likely outcomes means for USD direction, the shape of the yield curve, and the currency pairs that move hardest.
Why a near-certain hike does not guarantee a stronger dollar
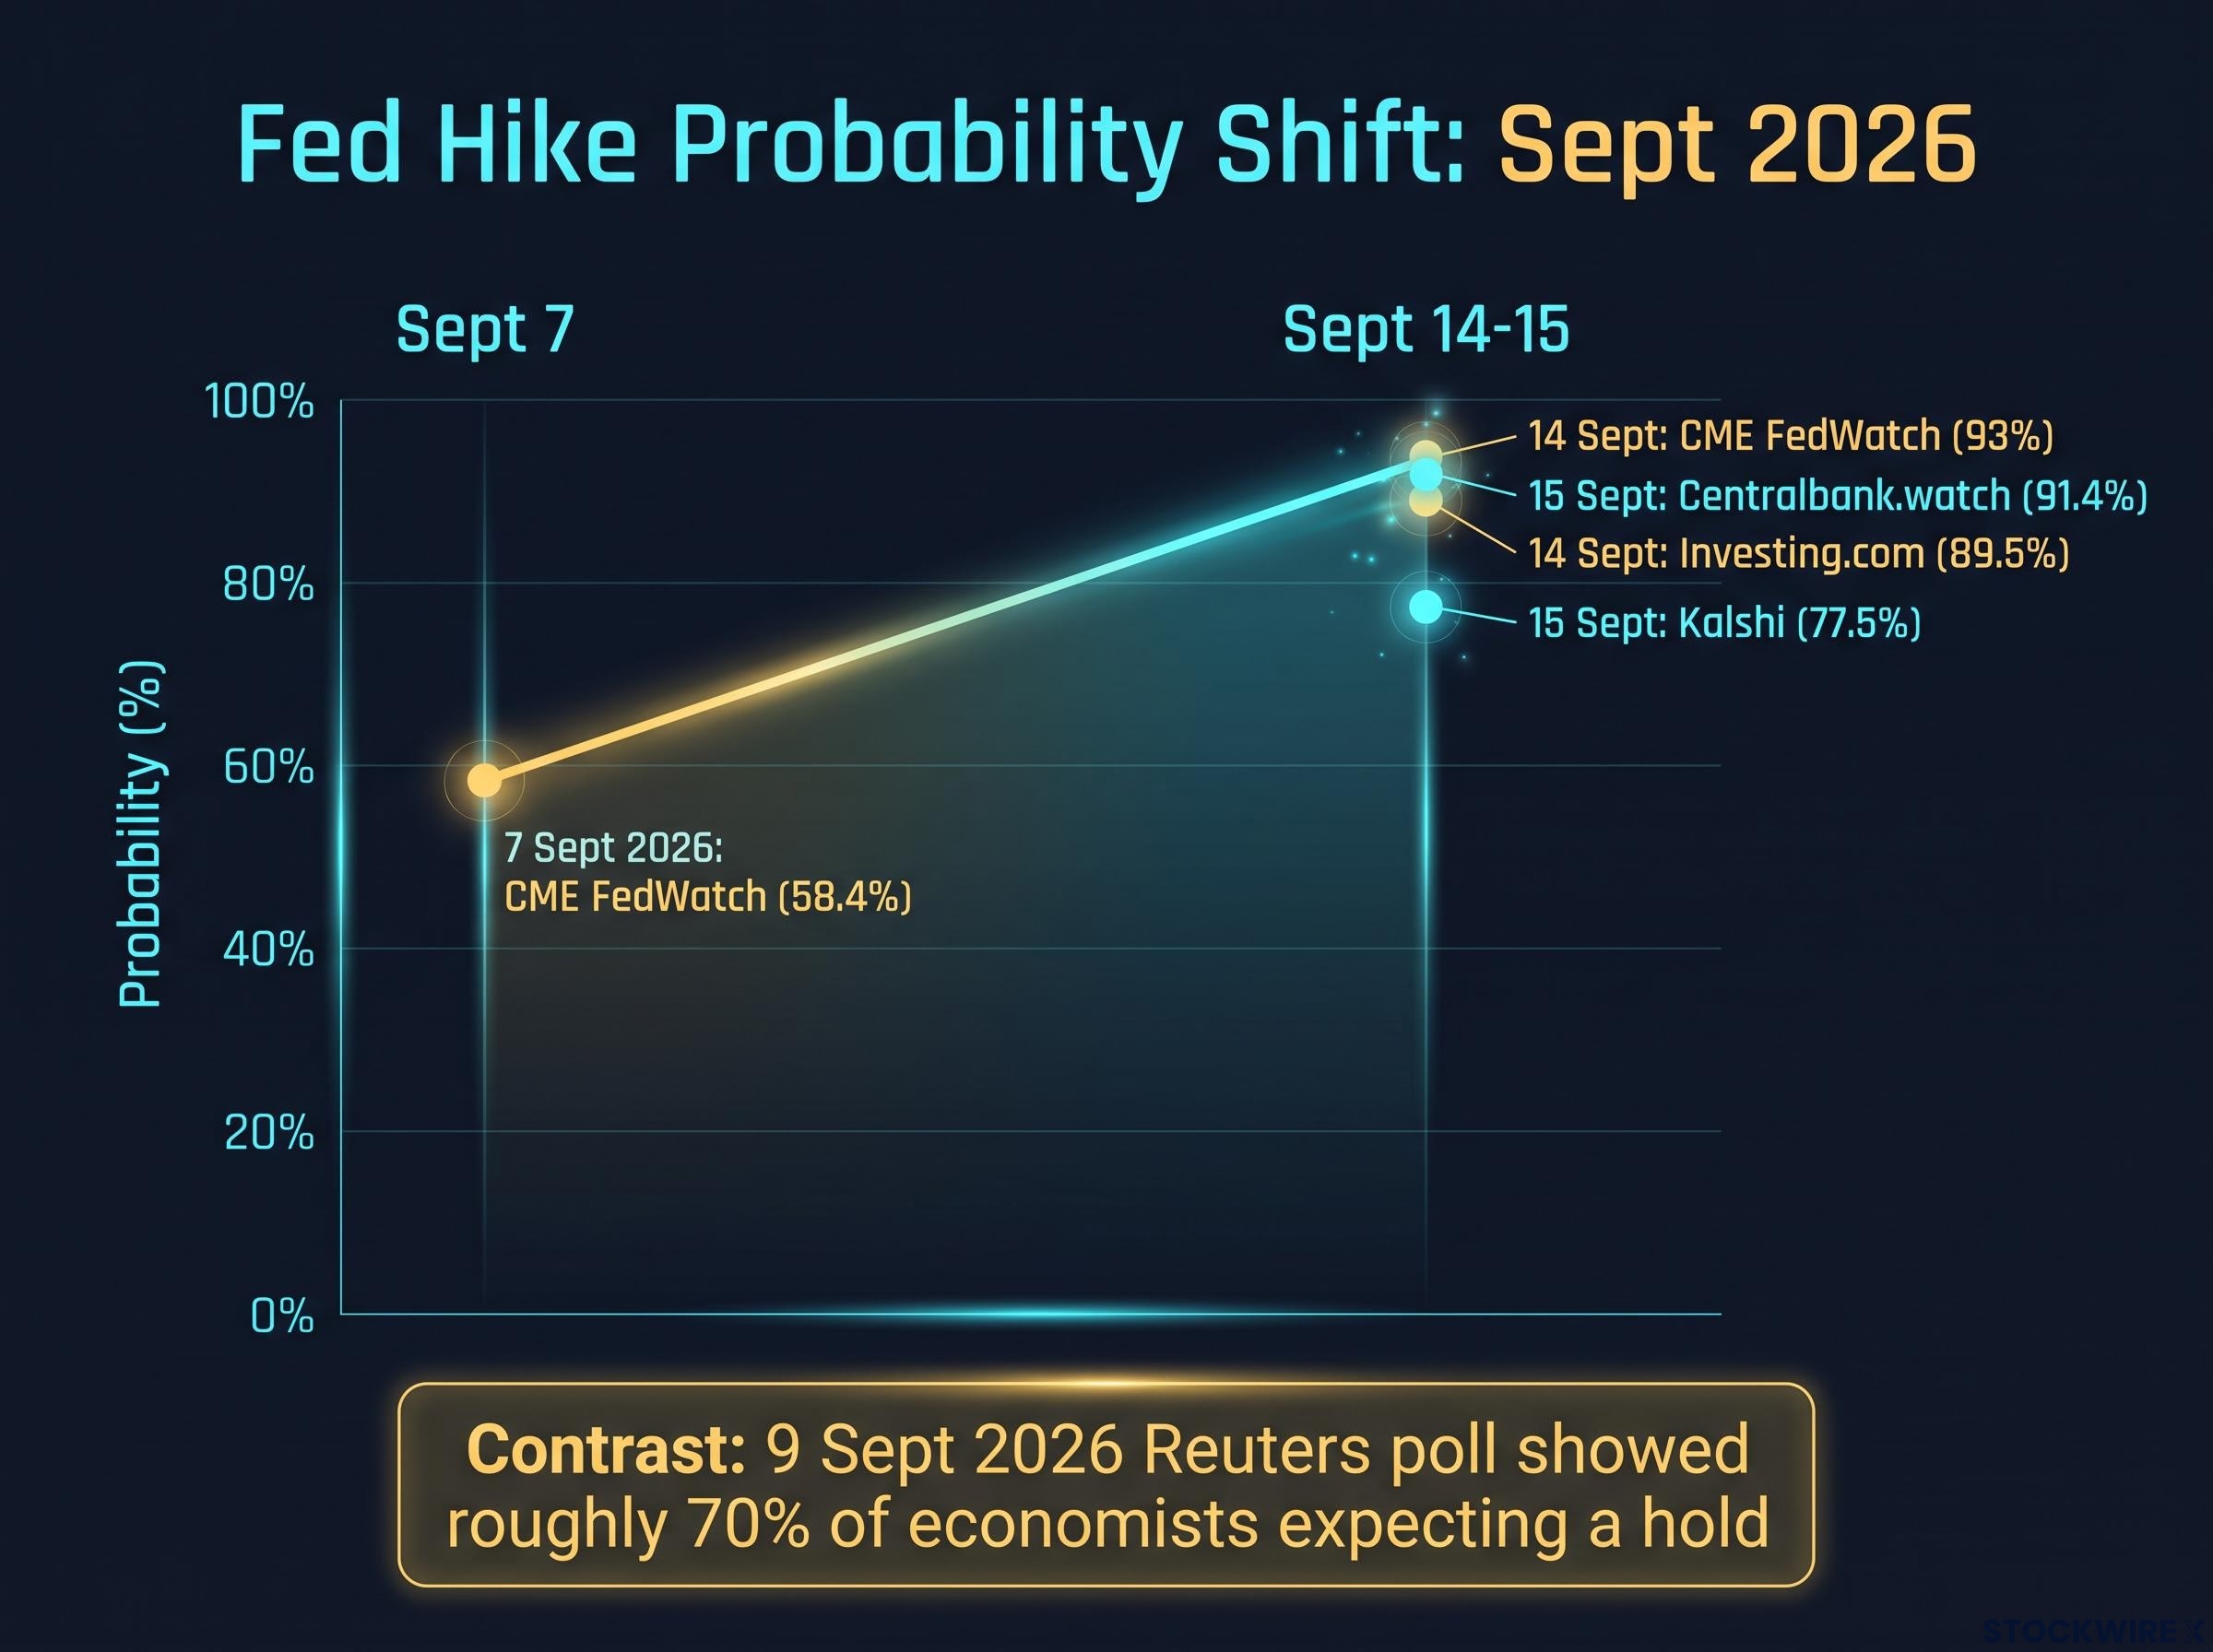
Start with what the pricing actually tells you. As recently as 7 September 2026, CME FedWatch put the odds of a 25 basis point hike at just 58.4%. By 14 September, after the August inflation reading landed, that figure had jumped to 93%. The dollar’s bullish case was built in a single week.
That speed is the problem. When most of the buyers who wanted to be long the dollar are already long, the flow after the announcement tends to be dominated by profit-taking rather than fresh demand. This is the “buy the rumour, sell the fact” dynamic, and it hits foreign exchange markets hard when probability readings climb into the high-70s to low-90s.
The Fed transmission to the dollar runs through yield differentials, balance-sheet policy, and forward guidance simultaneously, which is why a rate hike that compresses the yield advantage relative to what was already priced can leave the currency flat or lower despite the nominal tightening.
The readings themselves cluster tightly, which is exactly why the marginal buyer is running out:
The CME FedWatch methodology derives these probabilities from 30-day federal funds futures prices, which means the figures shift intraday with every new futures print and can move significantly on a single piece of inflation data, as the jump from 58.4% to 93% in one week demonstrated.
- Kalshi prediction markets: 77.5% (15 September 2026)
- Centralbank.watch: 91.4% (15 September 2026)
- CME FedWatch: 93% (14 September 2026)
- Investing.com futures-implied: approximately 89.5% (14 September 2026)
- Versus just 58.4% on 7 September 2026, before the August CPI release
Once probability crosses roughly 80%, the marginal buyer of the dollar on the headline hike is limited by definition. Almost all of the genuine surprise risk shifts to the tone of the guidance and the dot plot, not the vote.
The numbers back this up. Kalshi’s probability-weighted expected move is only about +20bp, which tells you that even the more bullish tools embed a fairly modest directional signal. TD Securities projects an initial short-term dollar pullback under the baseline 25bp scenario, precisely because the move is so fully priced.
The fade-the-hike thesis in one line Stockwirex labels a hike delivered with a neutral statement as “flat to lower” for the dollar, with the key risk being a crowded long-dollar unwind.
What this means for you is straightforward. The jump from 58% to 93% in a week means the market has already done much of the dollar’s bullish work. The hike is likely already sitting in your exchange rate screens before the announcement lands, which is why chasing dollar strength on the headline is one of the easiest ways to be right about the Fed and wrong about the trade.
When big ASX news breaks, our subscribers know first
The three scenarios and what they mean for USD, yields, and key currency pairs
Do not read the decision as a coin flip. Read it as a branching tree with three clear outcomes, each with its own dollar call, curve shape, and set of currency pairs to watch.
- Scenario A, the baseline: a 25bp hike to 3.75-4.00% with neutral guidance.
- Scenario B, the hawkish outcome: a hike plus aggressive dots, or a hold paired with hawkish dots.
- Scenario C, the dovish hold surprise: no hike, and a flat or lower dot plot.
Under Scenario A, the views split. TD Securities expects an initial short-term dollar pullback and modest bull steepening of the yield curve (short-end yields falling faster than long-end yields). Stockwirex calls it “flat to lower.” Investing.com offers the counterpoint: delivering the hike still carries credibility value, supporting the dollar against EUR/USD, GBP/USD and USD/JPY because it preserves the US yield advantage.
Under Scenario B, the direction is cleaner. FXIFY defines the hawkish threshold as a median year-end 2026 projected rate above 3.875%, and TD Securities flags that dots signalling an October hike would qualify. The expected result is dollar strength, rising front-end yields, a potential curve flattening, and pressure on risk assets.
Under Scenario C, the move is the largest of all. TD Securities notes a hold would be a significant dovish surprise capable of driving the dollar back toward pre-August-CPI levels. Stockwirex marks this “sharp downside” as crowded longs unwind, and Investing.com warns it narrows expected rate differentials and invites carry flows away from the dollar.
| Scenario | Fed Action | Dot Plot Signal | USD Direction | Yield Curve Shape |
|---|---|---|---|---|
| A: Baseline | 25bp hike to 3.75-4.00% | Broadly unchanged, near 3.8% | Flat to lower initially (TD, Stockwirex); modest support (Investing.com) | Modest bull steepening |
| B: Hawkish | Hike, or hold plus hawkish dots | Median year-end above 3.875% | Stronger | Front-end rises, potential flattening |
| C: Dovish hold | Hold at 3.50-3.75% | Unchanged or lower | Sharp downside | Falls across the curve |
For institutional context, the hawkish camp is well populated. UBS expects September plus December hikes, Macquarie’s David Doyle expects a September hike with a Q1 2027 follow-up, and MUFG revised its call to a September hike as of 11 September 2026.
Here is the read that matters most for anyone holding dollar-sensitive positions. The scenario to prepare hardest for is not the most likely one but the one that produces the biggest move, and that is Scenario C. Because the dollar’s long positioning is so crowded, a dovish surprise lands with disproportionate force.
DXY overvaluation signals from institutional models add structural context to the crowded-long problem: Morningstar estimated the index at roughly 15% overvalued as of mid-2026, a reading that raises the downside velocity of any dovish surprise because the unwind starts from a stretched valuation baseline, not a neutral one.
What the dot plot actually does to the dollar, and why most traders miss it
Most traders watch the vote. That is the mistake. At a SEP meeting, the dot plot and the economic projections carry equal weight to the decision itself, which means the dots can quietly reverse the dollar’s reaction to the headline.
Here is the mechanism. If the Fed hikes but publishes a dot plot that does not move the median year-end rate higher, the market reads that as dovish relative to expectations. The policy rate just rose, yet the projected path of future rates did not, so traders reprice the terminal rate lower and the dollar can slip even as the rate ticks up.
The baseline for judging this is the 17 June 2026 SEP, which showed a median year-end rate of 3.8%, implying at least one hike before year-end. The current target range is 3.50-3.75%, held at the 29 July 2026 meeting, so a September hike would move it to 3.75-4.00%. The question is what the new dots do to that 3.8% median.
The tension between dot plot vs market pricing has rarely been sharper heading into a SEP meeting: the June 2026 median of 3.8% reflects a near-even committee split, while futures markets price a substantially higher terminal path, meaning the two signals can produce opposite dollar reads from the same announcement.
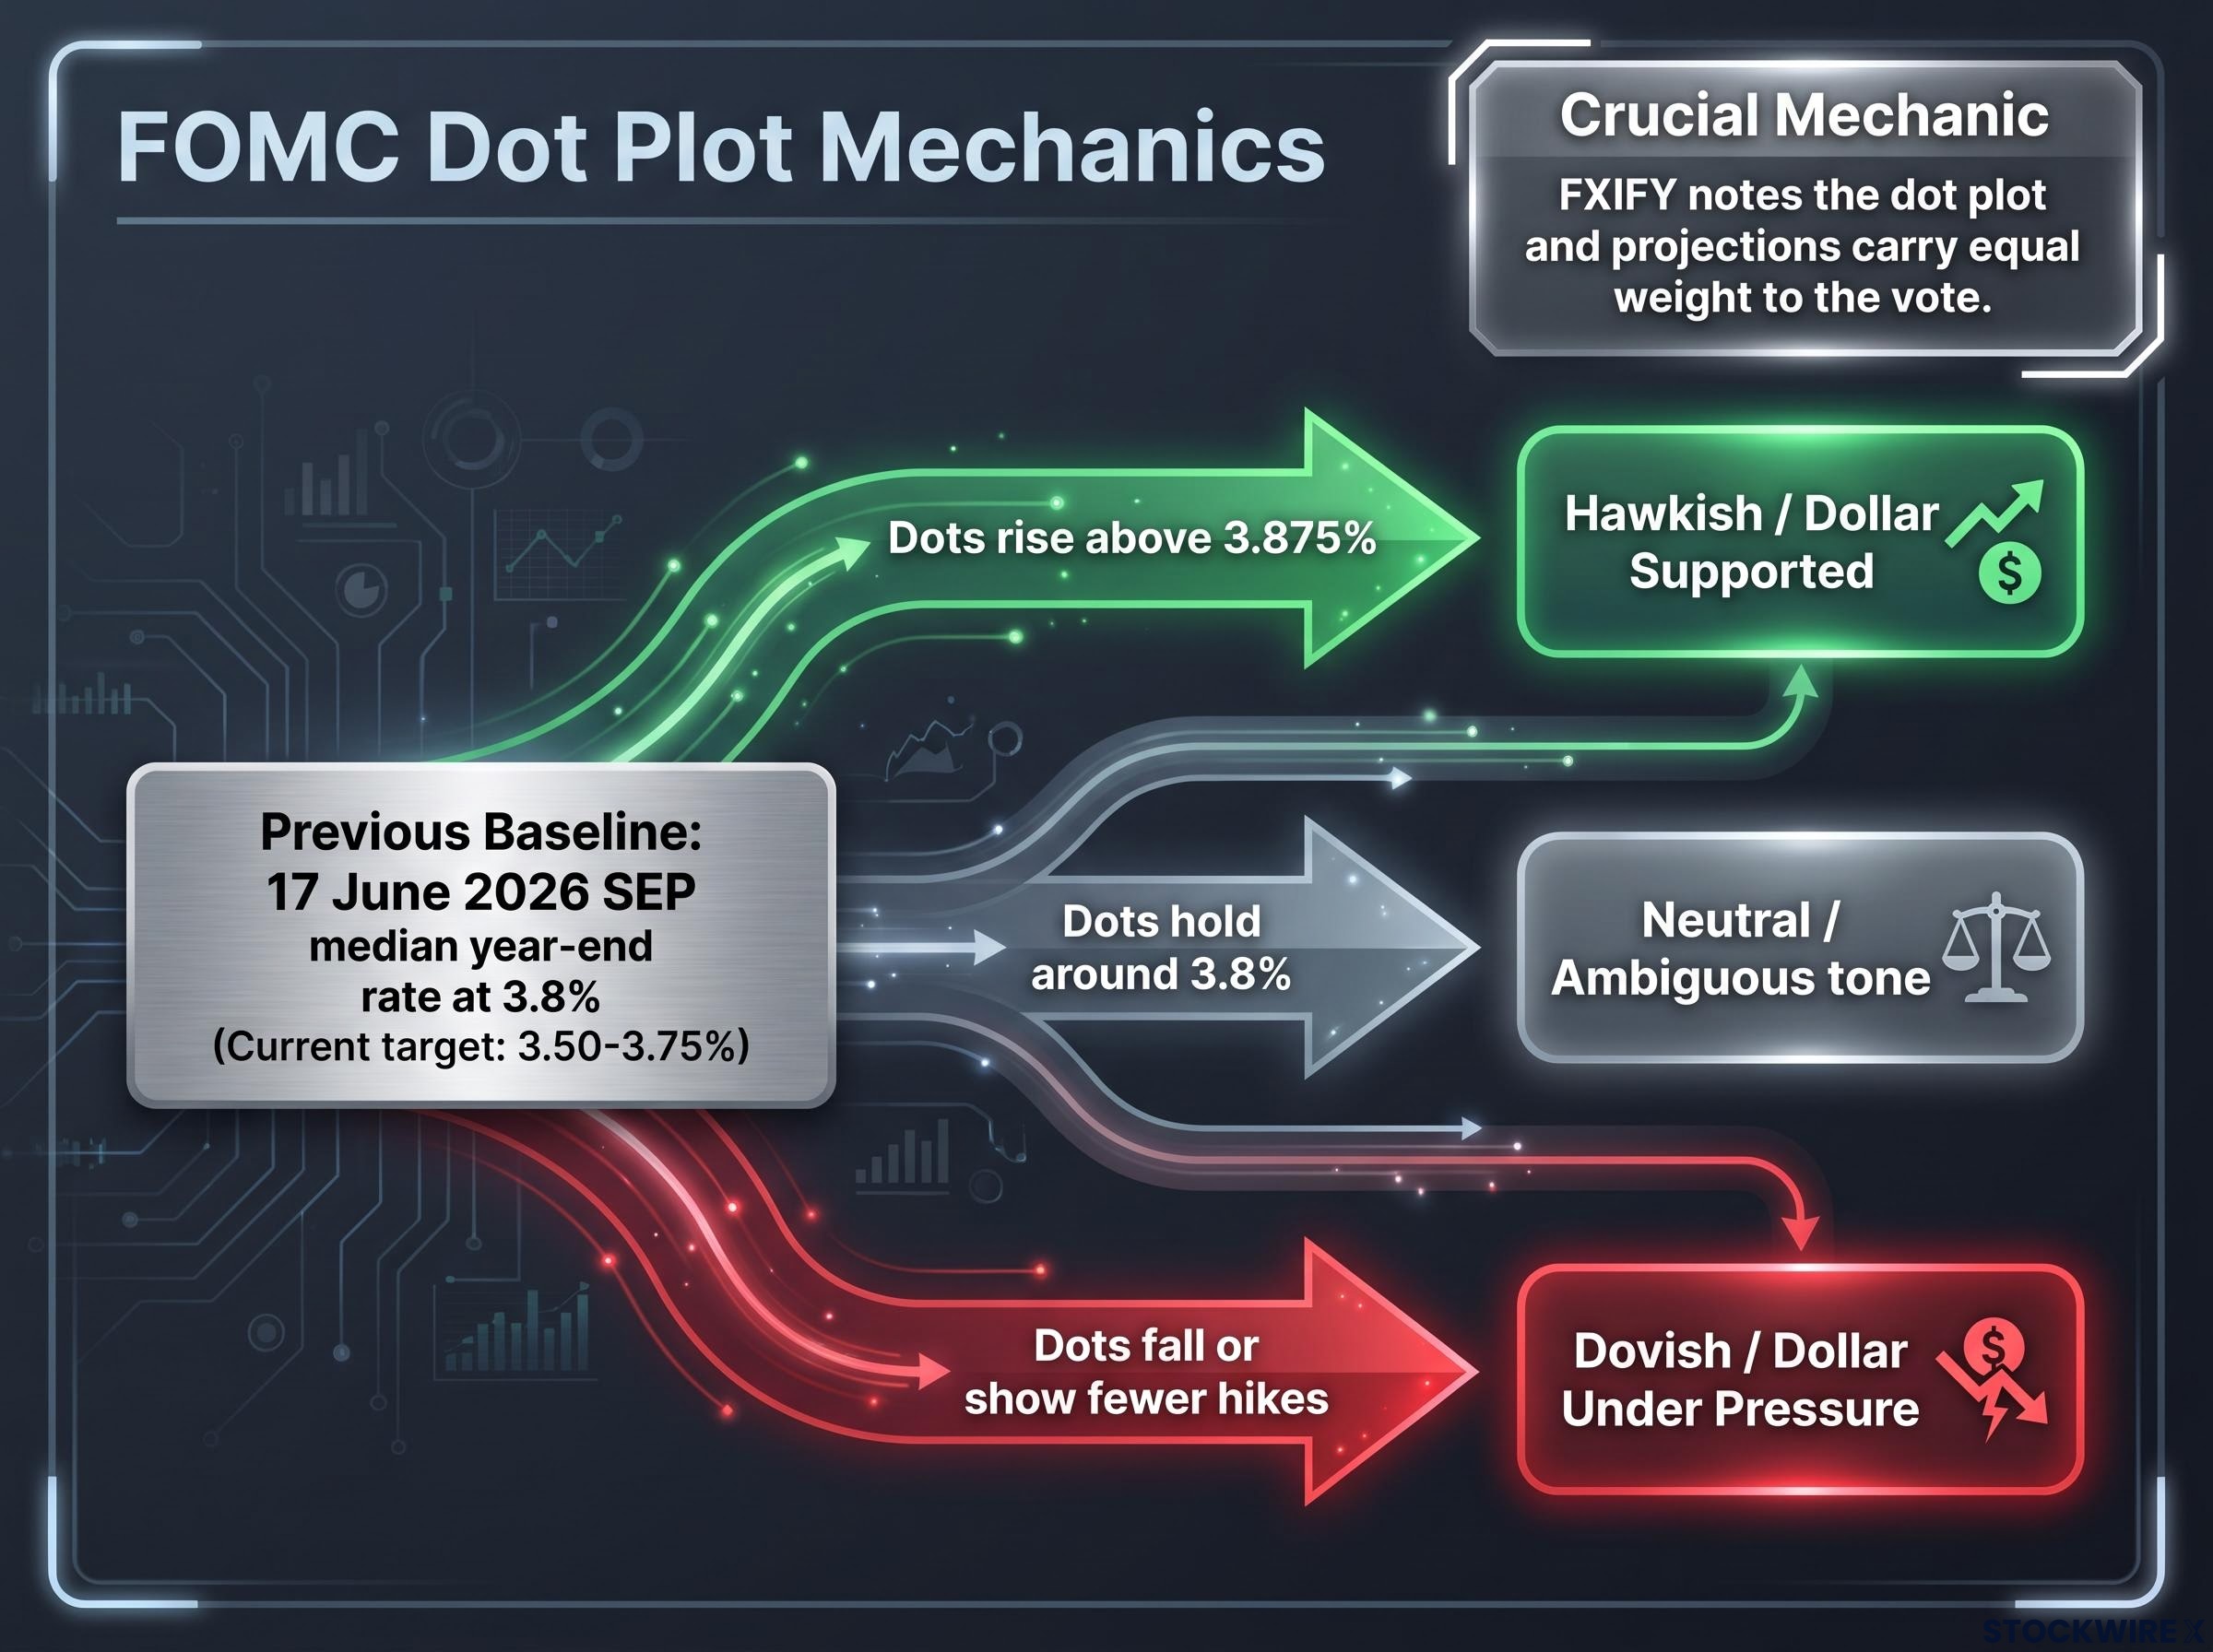
Why the dots are not a footnote FXIFY stresses that at SEP meetings, the dot plot and the updated economic projections carry equal weight to the vote.
The three ways the dots can break, and what each does to the dollar:
- Dots rise above 3.875%: hawkish, dollar supported. This is the variant that could extend the recent dollar uptrend.
- Dots hold around 3.8%: neutral and genuinely ambiguous, leaving the tone of the statement to decide.
- Dots fall or show fewer hikes: dovish relative to pricing, dollar under pressure.
This is where TD Securities’ call gets interesting. The firm expects the September dot plot to show fewer anticipated hikes than futures markets are currently pricing. If that happens, expect the dollar to struggle even on a hike, because the market will reprice the terminal rate lower and that repricing hits the currency faster than the rate increase supports it.
The practical edge is timing. Most post-FOMC commentary anchors on the vote, so if you understand the dot plot mechanic you can form a dollar view within seconds of the SEP release, before the broader market has finished reading the projection tables.
Six risks traders get wrong around FOMC announcements
Knowing the three scenarios is useful. Knowing where analysis breaks down is what separates a prepared reader from one who calls the outcome correctly and still loses money. Here are the six most common errors, each with the corrective behaviour.
- Watching only the vote and ignoring the SEP. A hold with hawkish dots is effectively tightening, and a hike with soft dots is effectively easing. Read the dots alongside the decision, not after it.
- Treating a single probability snapshot as certainty. CME FedWatch ran from 58.4% on 7 September to 93% on 14 September in a single week. Treat these tools as moving expectations, not settled facts.
- Underestimating crowded long-dollar positioning. Stockwirex flags the unwind risk in EUR/USD, GBP/USD and USD/JPY under a dovish scenario. Size positions with the knowledge that a crowded trade reverses violently when it turns.
- Misreading the yield curve. Focusing only on the fed funds rate misses the bigger move, which often sits in long-end yields and curve shape. Watch the whole curve, because that is what drives FX through term premia.
- Ignoring cross-asset spillovers. Hawkish outcomes tend to pressure equities while dovish outcomes lift risk assets. Track the correlations, or an FX-only view will understate your real portfolio risk.
- Over-relying on any single scenario grid. Chair Warsh’s press conference can trigger reactions that fall outside every predefined box. Keep the framework as a guide, not a script.
The uncertainty you cannot design away A Reuters poll of economists (9 September 2026) found roughly 70% expecting a hold, while CME FedWatch put the hike probability at 93%. Professionals working from the same data reached opposite conclusions.
That divergence is itself the most important calibration signal before 2:00 p.m. ET. It tells you any position taken into the announcement carries genuine binary risk and should be sized accordingly.
How to position yourself before 2:00 p.m. ET tomorrow
You do not need to predict the outcome. You need to recognise it the instant it arrives, and that comes from mapping your own exposure to each scenario in advance.
Run this three-point checklist before the announcement:
- Watch the vote: a hike to 3.75-4.00% is the baseline, and on its own it may do little to the dollar.
- Watch the median dot against the 3.875% threshold: above it is hawkish and dollar-supportive; unchanged near 3.8% is ambiguous; lower is dovish relative to pricing and a headwind for the dollar.
- Watch Chair Warsh’s press conference: language pointing to downside sensitivity or a nearing cycle peak can override the scenario grid entirely.
Hold the whole picture in view. TD Securities’ baseline points to an initial dollar pullback and modest bull steepening even on a hike, while Stockwirex flags “sharp downside” on a dovish pivot. The single most important input for sizing your position is the direct conflict between the Reuters economist poll at roughly 70% expecting a hold and futures pricing at 77-93% expecting a hike.
The right posture is not to commit to one scenario but to know what each looks like, so tomorrow’s decision becomes recognition rather than improvisation.
For readers wanting to understand why crowded long-dollar positioning has not produced stronger momentum despite restrictive rates, our full explainer on the dollar’s real yield floor examines the structural forces, including AI capex, fiscal issuance, and OCBC’s neutral USD framework, keeping the currency range-bound even as nominal yields rise.
This article is for informational purposes only and should not be considered financial advice. Investors should conduct their own research and consult with financial professionals before making investment decisions. Past performance does not guarantee future results, and these scenarios are speculative and subject to change based on market developments.