The Dollar Index just posted its fourth consecutive daily gain to its highest level since April 2025, and the catalyst that pushed it to a fresh high was not a word from the Federal Reserve. It was a Pentagon report of a third US carrier strike group deployment.
Most currency coverage reaches for Fed policy as the default explanation. Rate expectations move first, everything else follows. That framing held for much of the post-2008 era and still carries weight, but it is missing most of the current picture. Two forces operating independently of monetary policy are doing the heavy lifting: crude oil prices that now reward the US as a net energy exporter while punishing the euro area and Japan as importers, and euro weakness tied to French sovereign debt that has nothing to do with rate differentials.
Here is what is actually driving the dollar right now, and why the standard Fed-centric explanation misses most of the story. This piece breaks down the three structural engines behind the rally, explains how US net exporter status rewires the oil-dollar relationship, and maps the conditions under which the thesis holds and where it could break.
Four sessions, a multi-month high, and almost no Fed news in sight
The Dollar Index (DXY) rallied to 102.06 on 1 October 2026, according to Barchart, with the original source reporting an intraday session range of 102.10 to 102.13. Either way, that is the strongest the index has traded since April 2025, and it capped a fourth straight daily gain.
What makes the move analytically interesting is what drove the session high. Two catalysts stood out, and neither came from the Fed.
The dollar index breakout above 100 in mid-September 2026 established the technical and fundamental preconditions for the current four-session run, with a unanimous Fed hike and simultaneous geopolitical escalation near the Strait of Hormuz compressing the same three-channel structure now operating at the 102 level.
- China’s halt on fuel exports, which helped push crude oil prices higher
- A Pentagon report of a third US carrier strike group deployment, which lifted the DXY to its session peak
- EUR/USD falling below 1.1300, its fourth consecutive daily loss and weakest level since May 2025
- The ISM manufacturing prices index at 77.9 in September, an inflationary signal in the current environment
That last reading deserves a closer look, because it tells you something about the backdrop.
Inflation pressure is building again: The ISM manufacturing prices index hit 77.9 in September, closing in on the 78.3 reading recorded in March at the onset of the war.
When a multi-month currency high is driven by a carrier group deployment and a Chinese export halt rather than Fed guidance, the standard monetary-policy lens is not just incomplete. For anyone trying to understand their own currency exposure, it is actively misleading.
The parallel data point reinforces the puzzle. EUR/USD slid below 1.1300 even as the backdrop included elevated US yields, with the 10-year Treasury yield trading above 5.30% intraday and the 30-year near 5.65 to 5.67%, both at their highest since 2002. The euro’s weakness demands its own explanation, and it is not one a Fed-watcher alone will find.
This matters for a practical reason. A Fed-driven dollar rally and a geopolitics-and-oil-driven rally have different half-lives and different hedge implications. Knowing which one you are looking at changes how you assess its durability.
When big ASX news breaks, our subscribers know first
What the US energy transition actually does to the dollar’s relationship with oil
For decades, the received wisdom was simple: rising oil prices hurt the dollar. Understanding why that logic broke is the key to understanding the current rally.
Why the old playbook said oil hurts the dollar
The pre-shale logic ran like this. The US imported large quantities of crude, so when oil prices rose, the trade balance worsened, domestic inflation climbed, and growth expectations dimmed. All three channels weighed on the dollar.
That model grouped the US alongside Europe and Japan as energy-import-vulnerable economies. The beneficiaries of an oil rally were the commodity currencies, the Canadian dollar and the Norwegian krone, whose economies earned more as crude climbed.
That grouping no longer describes reality. The United States reached a record net crude oil and fuel export volume of 5.8 million barrels per day in April, according to the original source, and that structural shift rewires the entire terms-of-trade relationship.
The EIA import and export data confirms that the United States has been a net total energy exporter since 2019, with total energy exports reaching record highs in 2024, a structural shift that fundamentally changes how rising crude prices feed through to the dollar.
When oil rises now, US energy exporters earn higher dollar revenues. Capital flows into US energy equities, infrastructure, and credit. The currency benefits from improved terms-of-trade rather than suffering from a worsening trade balance, behaving more like a commodity currency than it ever did before.
The other side of that trade is where the DXY math gets powerful. The euro area and Japan remain structural net importers, and the European Union imports roughly 96.6% of its crude oil and fuel consumption. The US was the EU’s largest single supplier in 2024, providing 16% of its crude and fuel imports.
| Economy | Oil Trade Position | DXY Impact When Oil Rises |
|---|---|---|
| United States | Net exporter at 5.8M bpd record | Positive: higher export revenues support the dollar |
| Euro Area | Net importer, 96.6% import dependency | Negative: 57.6% of DXY basket, import cost rise weakens euro |
| Japan | Net importer, minimal domestic production | Negative: 13.6% of DXY basket, same import cost dynamic |
Here is why the asymmetry compounds. The euro’s 57.6% weight and Japan’s 13.6% weight mean the economies representing 71.2% of the DXY basket face rising energy import costs exactly when the US earns more from its exports.
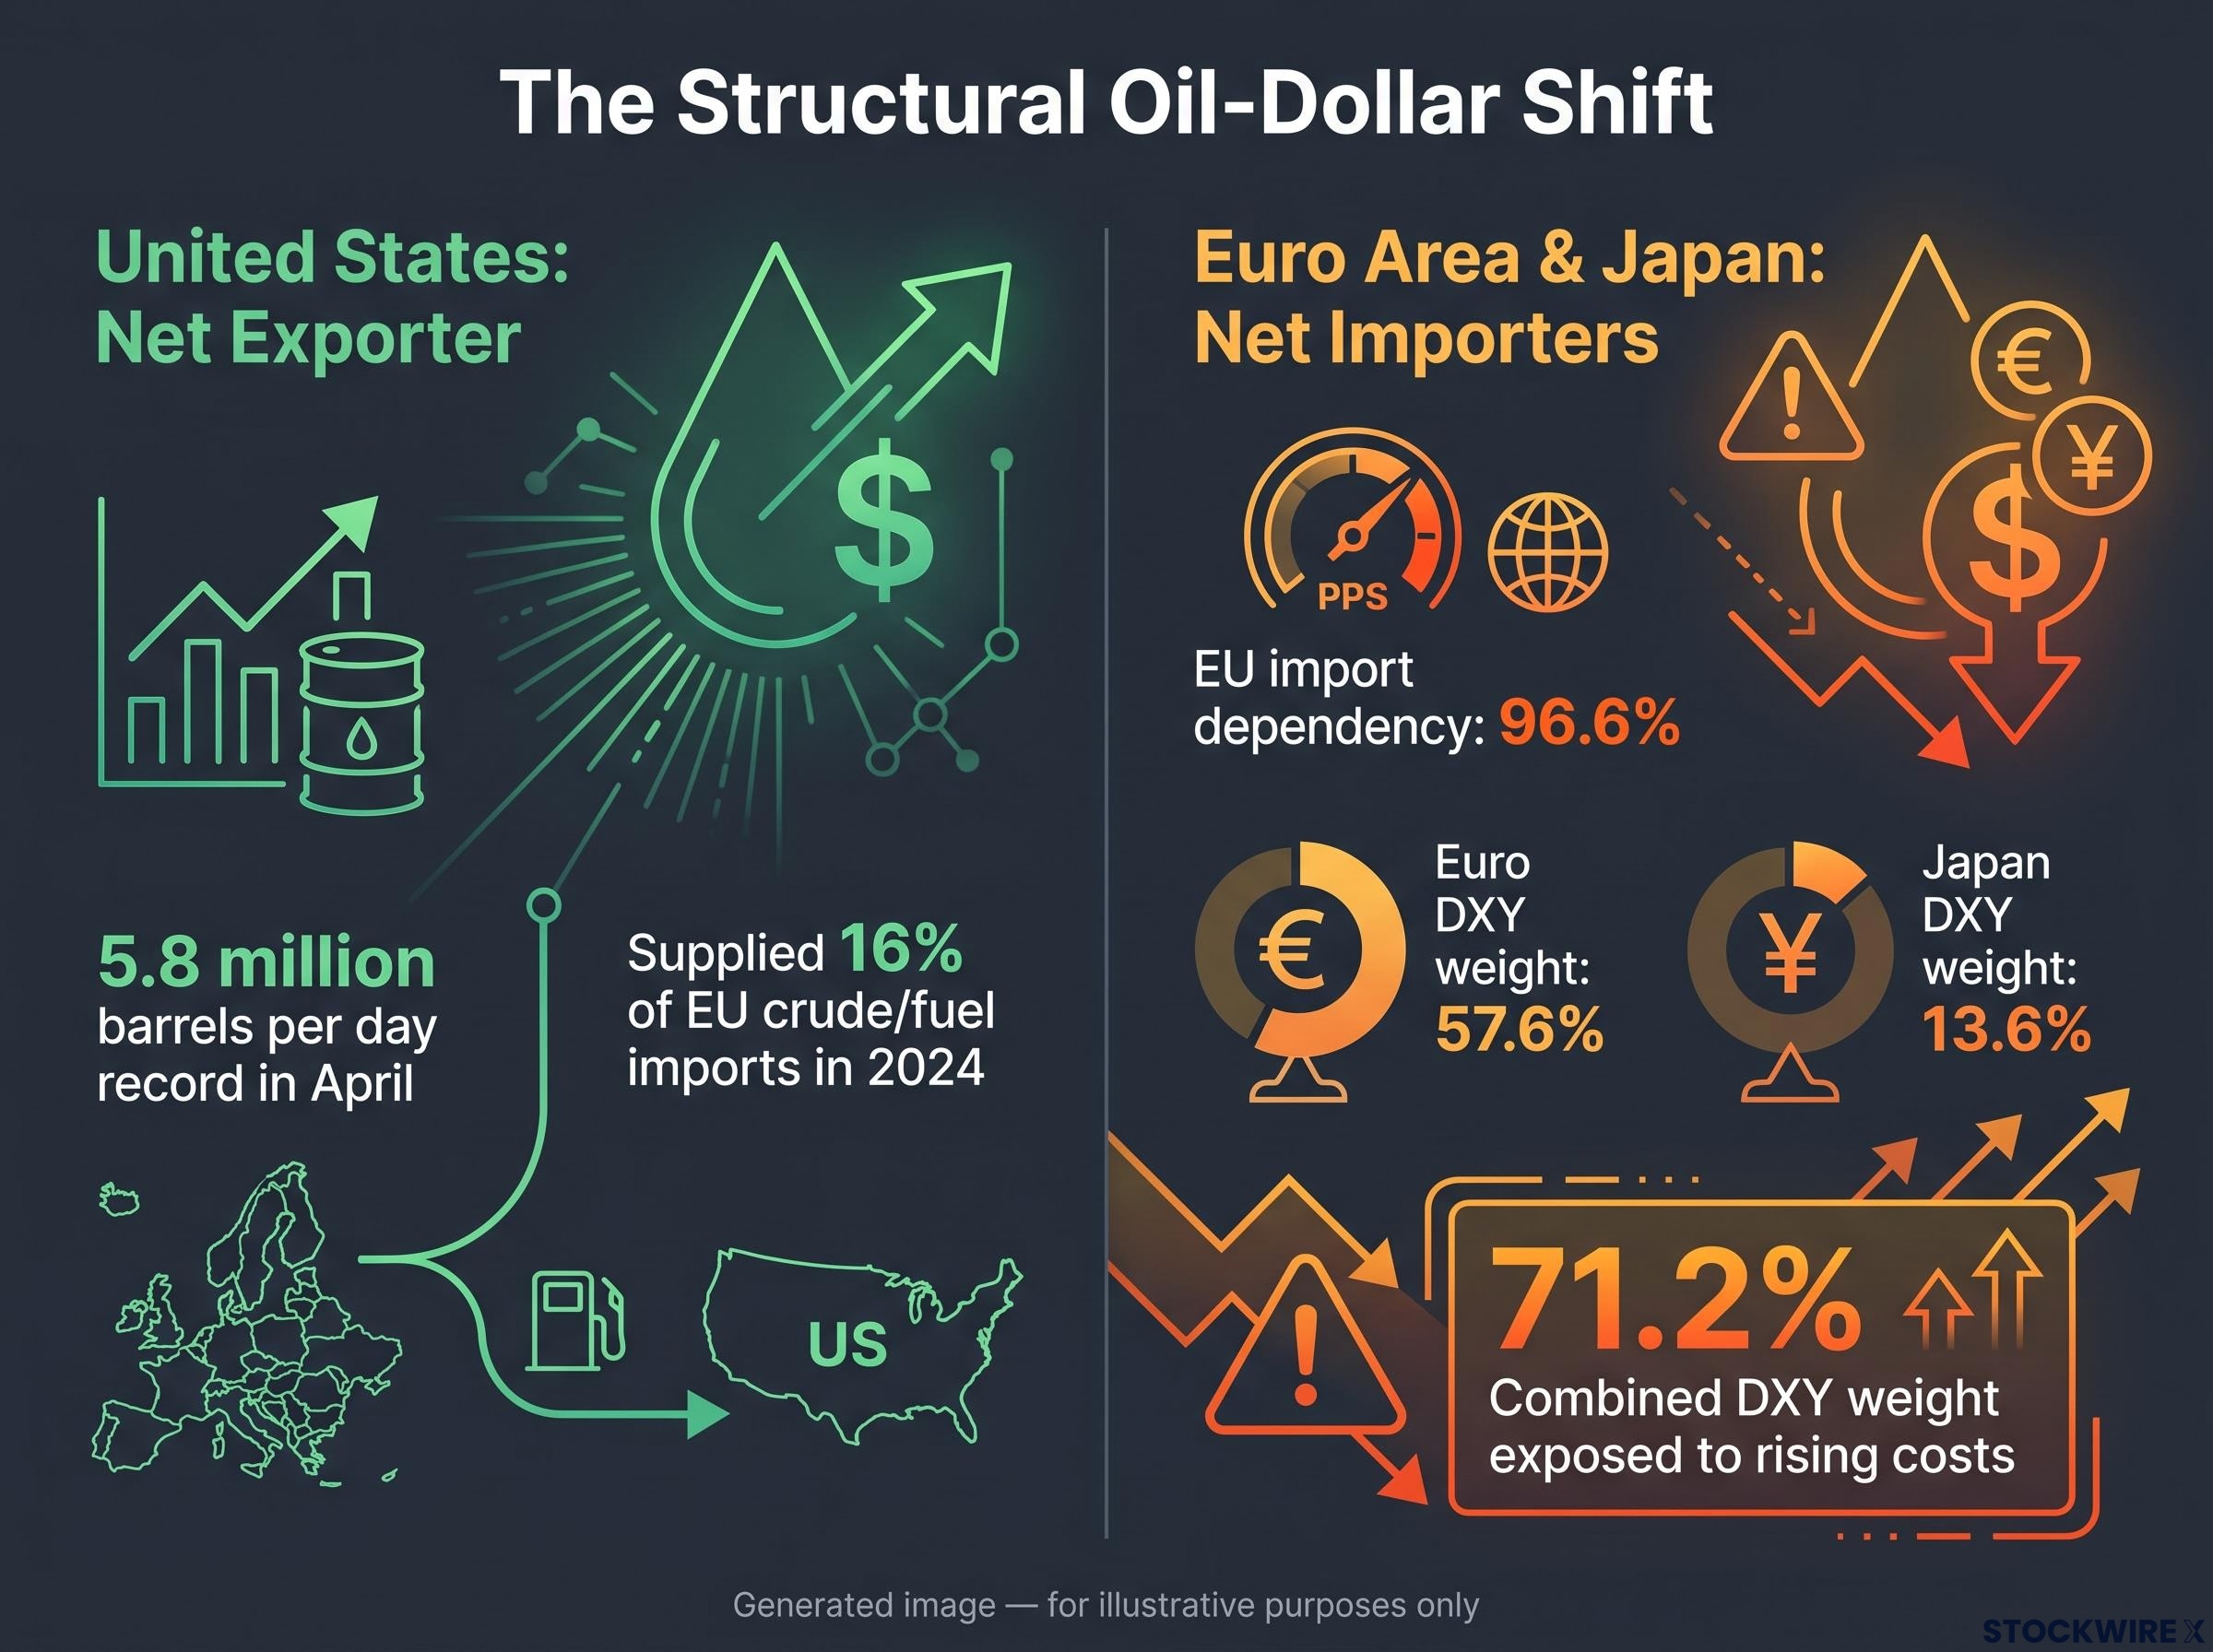
For a global investor, that means rising oil is no longer a simple dollar headwind. It lifts the numerator, US export revenues, while depressing the denominator, euro and yen purchasing power, compounding the DXY move in a way pure rate-differential models will never capture. This is the mechanism most Fed-centric commentary misses, and it explains why this rally can persist even if the Fed holds steady.
The euro’s double problem: energy costs and French sovereign debt
The euro’s slide across four sessions looks persistent because two independent pressures arrived at once, not because of a single-day reaction.
- Energy import costs: Rising crude raises the EU’s import bill, eroding the macro backdrop given its 96.6% dependency on imported oil and fuel.
- French sovereign debt concerns: Worries about fiscal credibility in the EU’s second-largest economy have added a risk premium to the common currency that rate differentials do not explain.
The telling detail is what failed to stop the slide. Elevated September inflation readings across major eurozone economies were released during this period, and under normal conditions that signals potential European Central Bank tightening, which supports a currency. The euro fell anyway.
The euro is the dominant lever: At 57.6% of the DXY basket, a sustained EUR/USD decline is not one input among many in the index’s move. It is the single largest mechanical driver of the four-session gain.
When a currency falls on a day its own inflation data comes in hot, the driver is structural and idiosyncratic, not rate-expectations-driven. That distinction matters for how long the weakness persists, because a fiscal credibility problem does not resolve on the next data print.
There is a data gap worth naming honestly. Specific OAT-Bund spread moves and French sovereign rating actions were not available in the research layer, so the French debt concern is identified as a contributing factor rather than quantified. What the ECB’s own Economic Bulletins confirm is the broader pattern: widening rate gaps between the US, with its 10-year above 5.30%, and the euro area tend to weaken the euro when policy diverges.
The IMF’s 2026 Article IV assessment of France identified high deficit and debt levels, modest growth dynamics, and rising spending pressures as acute concerns, framing the absence of a credible multi-year consolidation strategy as the core fiscal risk weighing on the country’s sovereign standing.
For anyone holding euro-denominated assets, the read is a compound headwind. Energy costs are eroding the growth backdrop while fiscal concerns layer on a risk premium, and neither is something the ECB can quickly reverse.
Geopolitical risk premium, safe-haven demand, and the carrier group signal
A carrier group deployment contains no monetary-policy content whatsoever, yet it moved the DXY to a session high. The reason is that geopolitical escalation works through two reinforcing channels at once.
- The oil-price channel. Supply fears push crude higher, which rewards net exporters and punishes net importers. In the current structure that lifts the dollar through improved US terms-of-trade while weighing on the euro and yen.
- The risk-aversion channel. Rising uncertainty drives capital into safe-haven assets, and the dollar is the primary global safe-haven currency alongside the Swiss franc. Flows into US Treasuries and dollar cash strengthen the DXY regardless of the underlying fundamentals.
The third carrier strike group deployment activates both channels simultaneously because it signals elevated operational tempo in a region that intersects with major energy supply routes.
The proximate trigger: A Pentagon report of a third US carrier strike group deployment was identified as the specific catalyst behind the DXY’s session high, a factor with no connection to Fed policy.
The critical point is that these two channels are additive for the dollar, not offsetting. Geopolitical risk raises oil, which is a terms-of-trade benefit for the US, and simultaneously raises safe-haven demand, which is a flow benefit for the dollar. Both arrows point the same way.
History shows this pattern repeatedly. The Russia-Ukraine war triggered a pronounced rotation into dollar safe-haven assets alongside surging oil and gas prices, and attacks on Red Sea shipping created supply-risk premia that moved both crude and currencies. The risk-aversion channel tends to dominate when the event has direct energy supply implications, a Strait of Hormuz scenario being the clearest example, because both channels push the dollar in the same direction.
The geopolitical risk premium in crude is not a temporary spike in the current structure; Goldman Sachs estimates approximately $14 per barrel of Brent’s price reflects conflict risk that could evaporate on credible de-escalation, which is exactly the double-reversal scenario the DXY faces if both the oil-price and safe-haven channels unwind simultaneously.
For your own reading of the market, this prevents a common analytical error. In the current structure, non-monetary-policy news is not noise. Geopolitical escalation is dollar-positive through two reinforcing routes, which is why the DXY moved on Pentagon news rather than waiting for the FOMC minutes.
Where the thesis holds and where it breaks
The energy-and-geopolitics case is strong, but it is not unassailable. Treating the following as monitoring conditions rather than disclaimers gives you a clearer map of what would change the picture.
- A Fed easing cycle repricing: If markets move to price faster Fed cuts, yield differentials narrow and the structural yield support compounding this case could weaken or reverse.
- Oil overshooting US growth tolerance: Beyond a certain price, oil shocks weigh on US consumers and non-energy sectors, potentially slowing growth enough to offset the export revenue benefit.
- Extended positioning vulnerability: A crowded long-dollar trade is exposed to sharp reversals if a catalyst arrives.
- US fiscal credibility concerns: The twin-deficit narrative and gradual de-dollarisation are longer-horizon risks to confidence in US assets.
Near-term: positioning and technical resistance
The momentum picture is stretched. The DXY daily Stochastic RSI sat near 96 as the index approached its fourth consecutive gain, a reading that tells you the trade is crowded.
Resistance levels at 102.20, 102.50, and 103.00 are all untested since April 2025, with support at 102.00 and the June peak near 101.80. The combination of extended momentum and untested resistance suggests the move may be in its mature phase, with profit-taking risk if de-escalation news or weaker US data arrives.
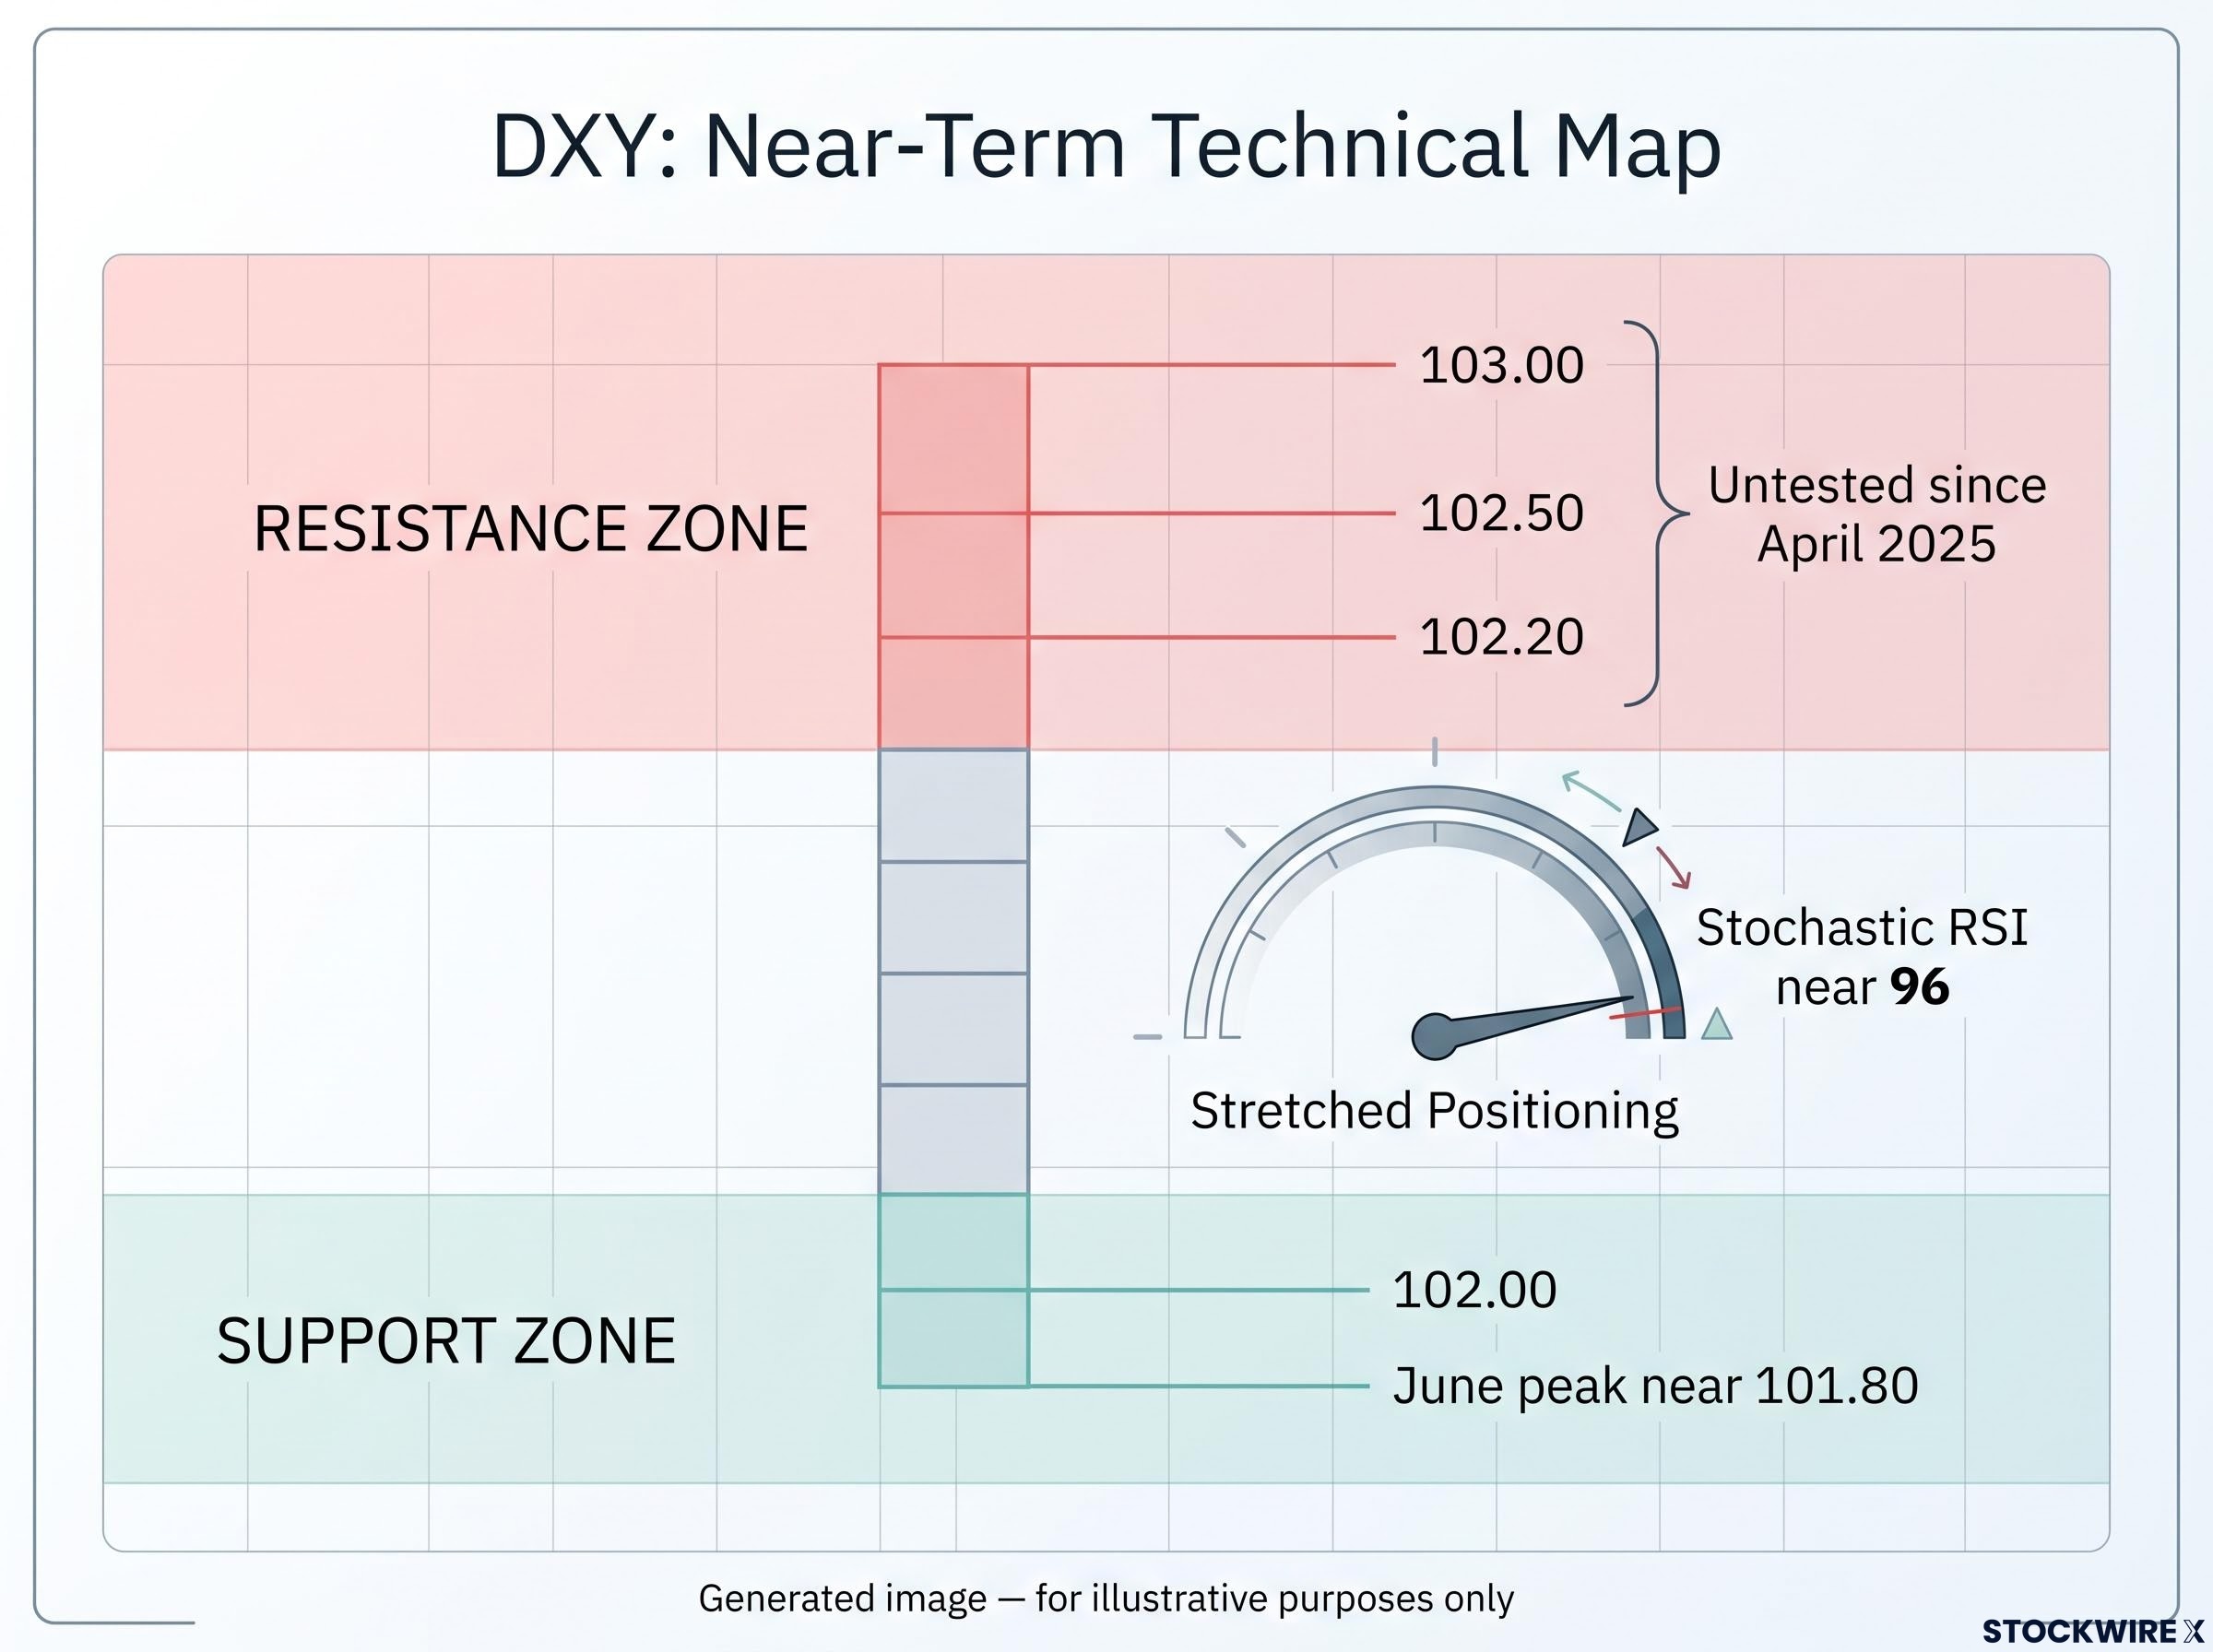
A Stochastic RSI near 96 does not tell you the fundamental case is wrong. It tells you the risk-reward of chasing the move here is asymmetric in the near term.
Longer-horizon: fiscal deficits and de-dollarisation
The twin-deficit narrative, large US fiscal and current account deficits running together, suggests a country could eventually face depreciation pressure if foreign investors demand higher risk premia or diversify away from its assets.
The gradual de-dollarisation trend sits alongside it, with some countries expanding local-currency trade settlement and reserve diversification. The honest read is that empirical evidence of meaningful diversification away from the dollar remains limited to date, so this is a structural tilt to watch rather than an imminent threat.
The de-dollarisation trend registers in reserve data as a gradual decline from roughly 72% to 56.8% over two decades, but a significant portion of that measured shift is a statistical artefact of non-dollar currency appreciation rather than active central bank selling, which explains why it functions as a long-horizon structural tilt rather than a near-term DXY risk.
This article is for informational purposes only and should not be considered financial advice. Investors should conduct their own research and consult with financial professionals before making investment decisions. Financial projections are subject to market conditions and various risk factors, and these statements are speculative and subject to change based on market developments.
What the dollar’s next move depends on
The rally’s next phase hinges on three variables, and the reader who tracks them will have a better early-warning system than the one watching only the FOMC calendar.
- Crude oil trajectory. Watch whether rising prices keep lifting US export revenues or begin dragging on global growth; a supply-driven spike extends the dollar’s terms-of-trade benefit, while a growth-sapping overshoot erodes it.
- EUR/USD and French fiscal developments. At 57.6% of the basket, the euro is the mechanical dominant driver, so any resolution or escalation of French debt concerns feeds straight through to the DXY.
- Geopolitical escalation or de-escalation. Further escalation keeps both the oil-price and safe-haven channels active, while genuine de-escalation would reduce both simultaneously, removing two sources of support at once.
Investors wanting to track EUR/USD as the dominant DXY input will find our dedicated guide to euro valuation fundamentals covers the BTP-Bund fragmentation risk signal and the ECB Governing Council structure that determines how quickly policy can respond to a fiscal shock like France’s.
The Fed is not irrelevant. It is simply the third or fourth input right now rather than the first. A sharp pivot toward easing would reassert its dominance, but absent that signal, energy and geopolitics are setting the tone.
The practical checklist is short. Track the ISM manufacturing prices index, last at 77.9, as the domestic inflation signal; watch EUR/USD as the highest-weight input into the index; and treat any de-escalation news as a potential double-reversal, easing both safe-haven demand and oil supply-risk premia at once.