
What Domino’s Q1 Results Reveal About the Consumer Spending Slowdown
15 hrs ago

CMBS delinquency rates reached a cycle peak in March 2026, with credit analytics firm CRED iQ placing overall distress at 12.07% of the CMBS universe, a figure that captures loans in special servicing alongside outright delinquency. While equity markets have drawn attention through technology-driven gains, the commercial real estate debt market is broadcasting a different signal. Stress in CMBS is not uniformly distributed, and regional banks, which hold nearly 45% of their loan portfolios in commercial real estate (CRE), face compounding pressure as maturities accumulate and loan modifications defer rather than resolve the underlying strain. What follows is a breakdown of what the delinquency data actually shows across competing sources, why the office and multifamily sectors are behaving differently, what $76.6 billion in 2026 hard maturities means for debt resolution, and which metrics investors should be tracking in regional bank portfolios.
CRE distress does not transmit into the broader financial system evenly. It transmits through specific institutions, and regional banks sit at the centre of that transmission mechanism. With approximately 45% of total loan portfolios concentrated in CRE exposures, regional banks carry asymmetric risk relative to large national banks, whose diversified lending books dilute any single sector’s impact on credit quality.
Exposure concentration: Regional banks hold nearly 45% of their loan portfolios in CRE, making them particularly sensitive to continued CMBS deterioration and broader commercial property stress.
Community banks carry an even sharper concentration, with CRE exposures representing approximately 42% of total assets. The median CRE concentration across FDIC-tracked institutions sits at roughly 200% of capital. Under longstanding interagency guidance, banks exceeding 300% of capital in CRE concentrations face heightened supervisory attention, a threshold that a meaningful number of smaller institutions approach or exceed.
The interagency guidance on CRE concentration risk management, issued jointly by the OCC, Federal Reserve, and FDIC, establishes the specific 300% of total capital threshold that triggers heightened supervisory attention, a standard that remains the operative benchmark for evaluating regional and community bank exposure today.
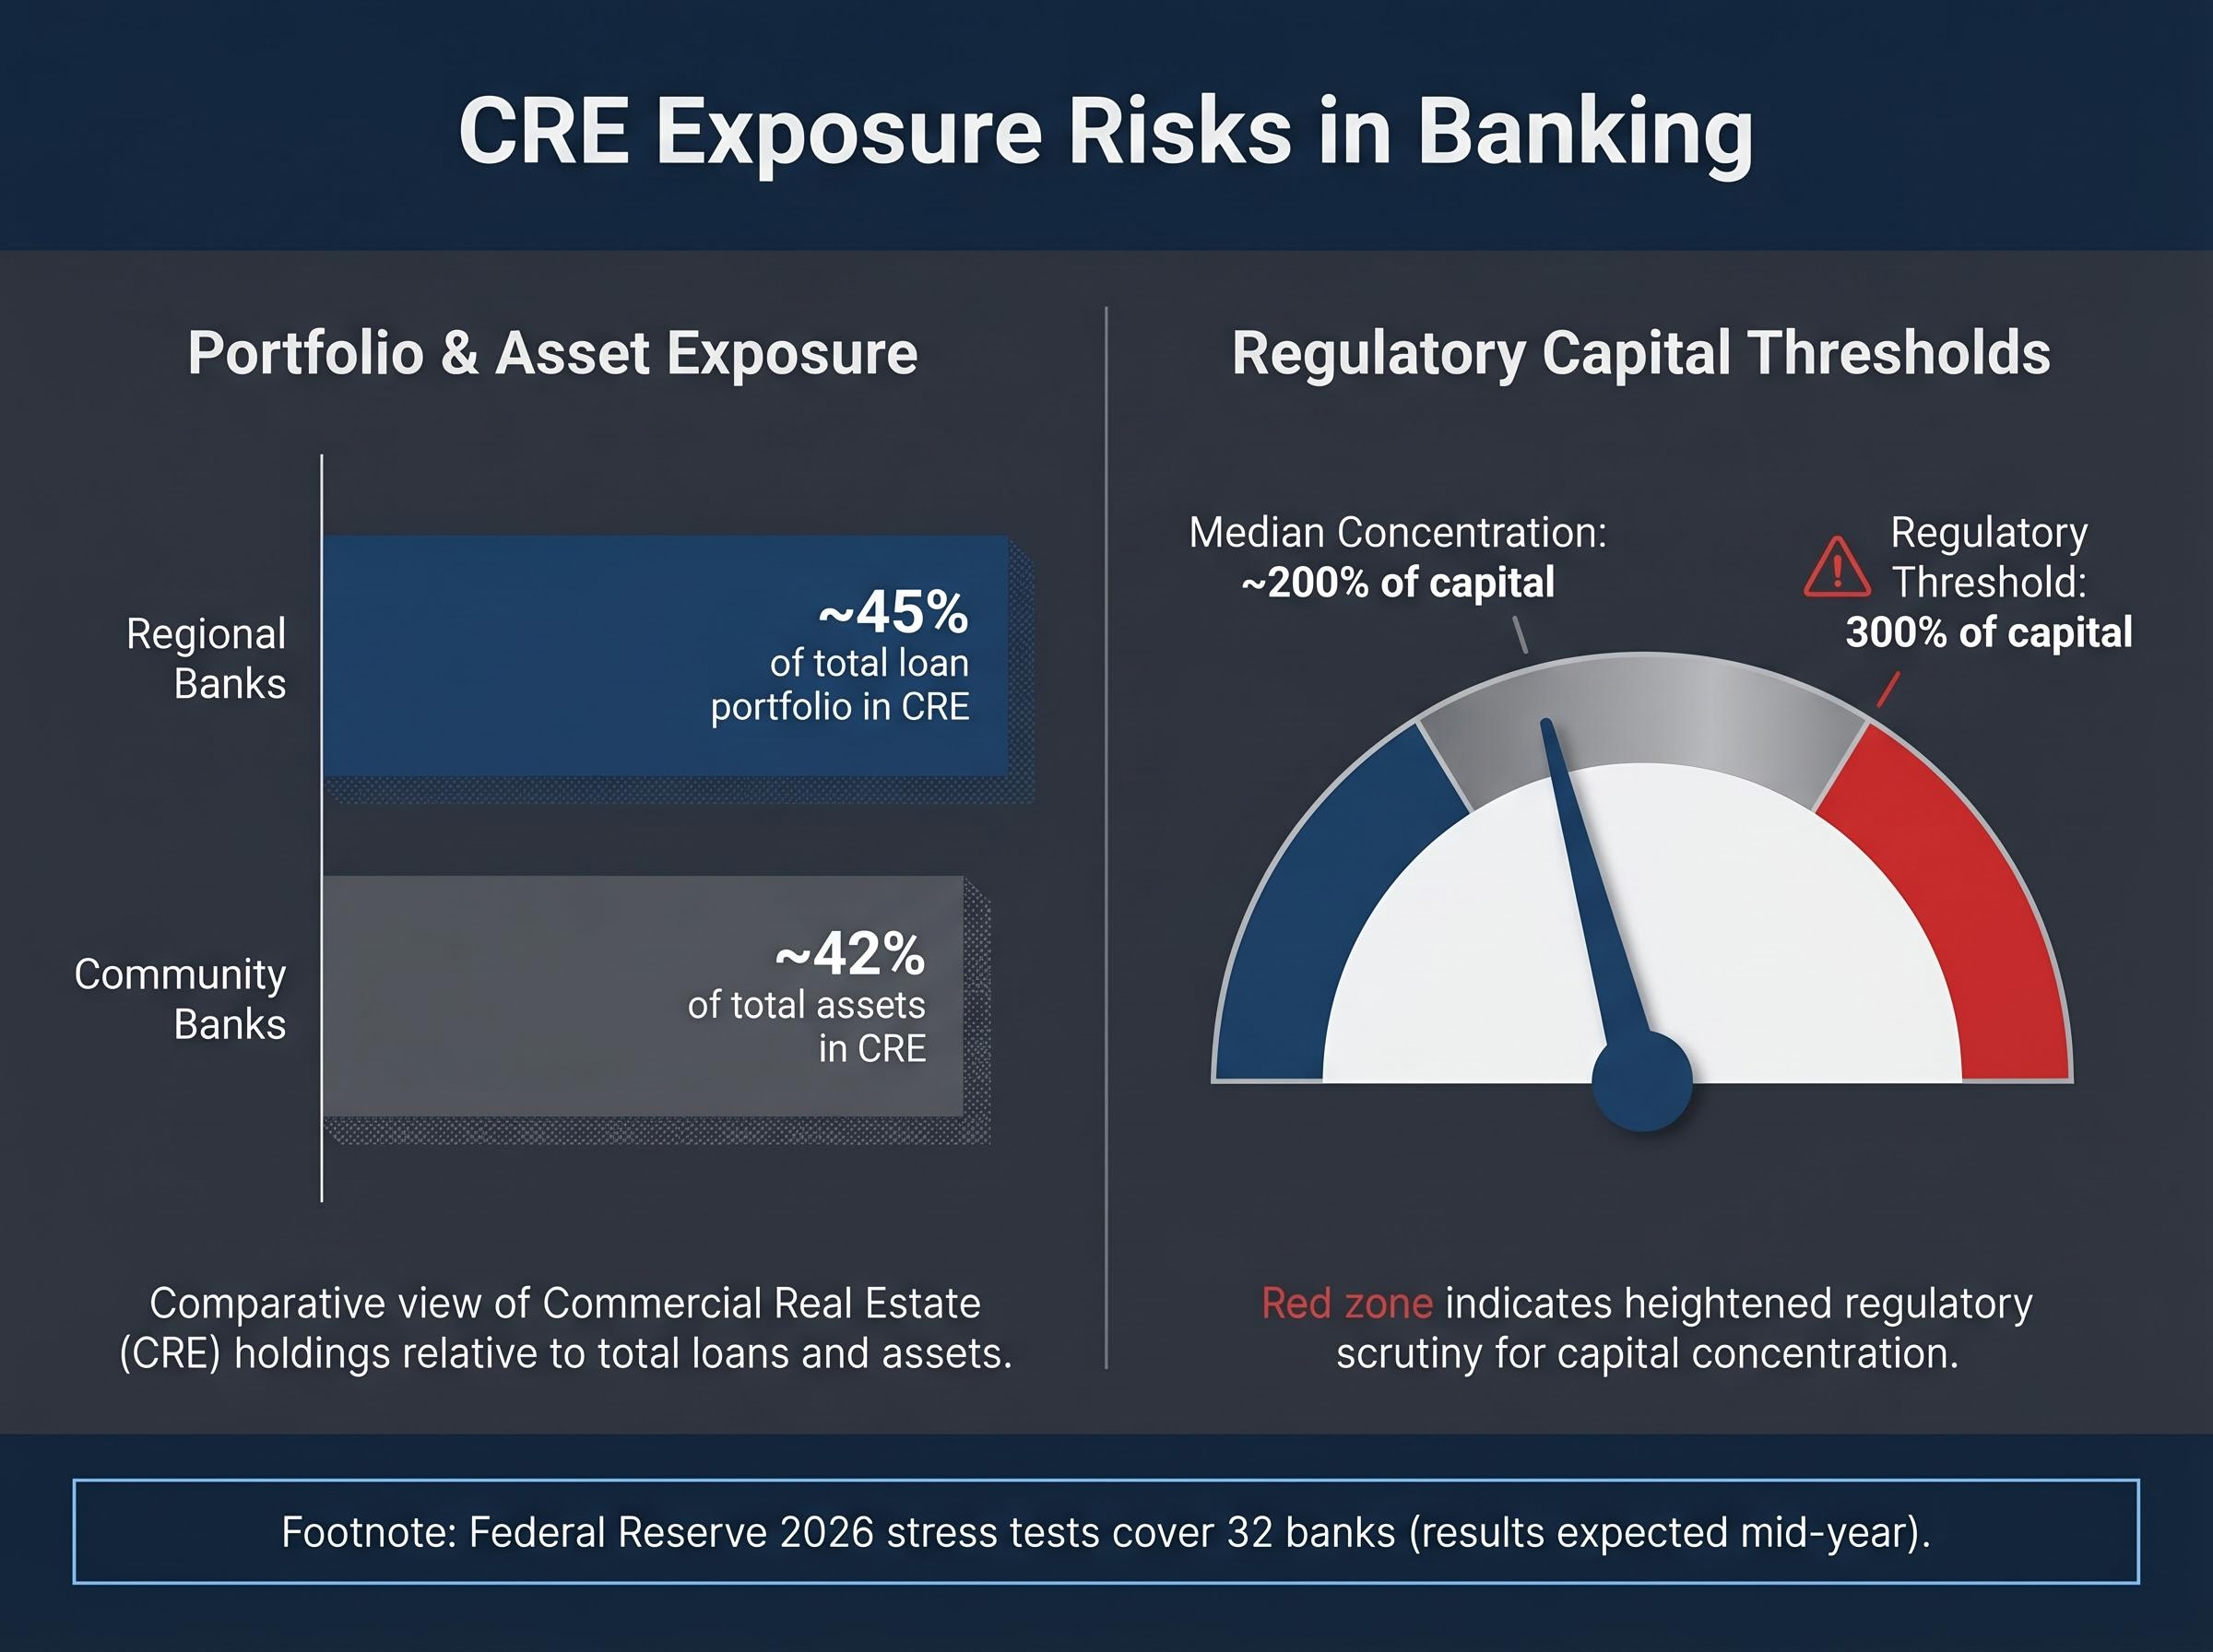
The Federal Reserve’s 2026 stress tests, finalised in February 2026, cover 32 banks under a severe adverse scenario that includes heightened CRE stress. Results are expected mid-year. For investors evaluating regional bank exposure before those results arrive, three metrics deserve close monitoring: provision for credit losses as a percentage of total loans, the allowance for loan and lease losses (ALLL) as a percentage of CRE loans, and non-performing CRE loan ratios.
| Institution Type | Approx. CRE Loan Concentration | Regulatory Threshold for Heightened Scrutiny | Key Monitoring Metric |
|---|---|---|---|
| Regional Banks | ~45% of total loan portfolio | 300% of capital (interagency guidance) | Provision for credit losses / total loans |
| Community Banks | ~42% of total assets | 300% of capital (interagency guidance) | Non-performing CRE loan ratio; ALLL / CRE loans |
With nearly half their loan books tied to CRE, these institutions have limited capacity to absorb simultaneous credit deterioration across office, multifamily, and retail sectors. Rising provision levels would be an early signal that management teams expect losses to accelerate.
When a CMBS delinquency report shows a sharp monthly improvement, the instinct is to read it as good news. In February 2026, the office sector’s delinquency rate fell 114 basis points, and the headline looked like a turning point.
It was not. The decline was driven by modifications and extensions of five large matured office loans, which removed approximately $3 billion from delinquency counts. By March 2026, office delinquency had re-accelerated to 11.71%, reversing roughly half the February improvement. The reversal was structurally predictable once the mechanics are understood.
The modification cycle follows a consistent sequence:
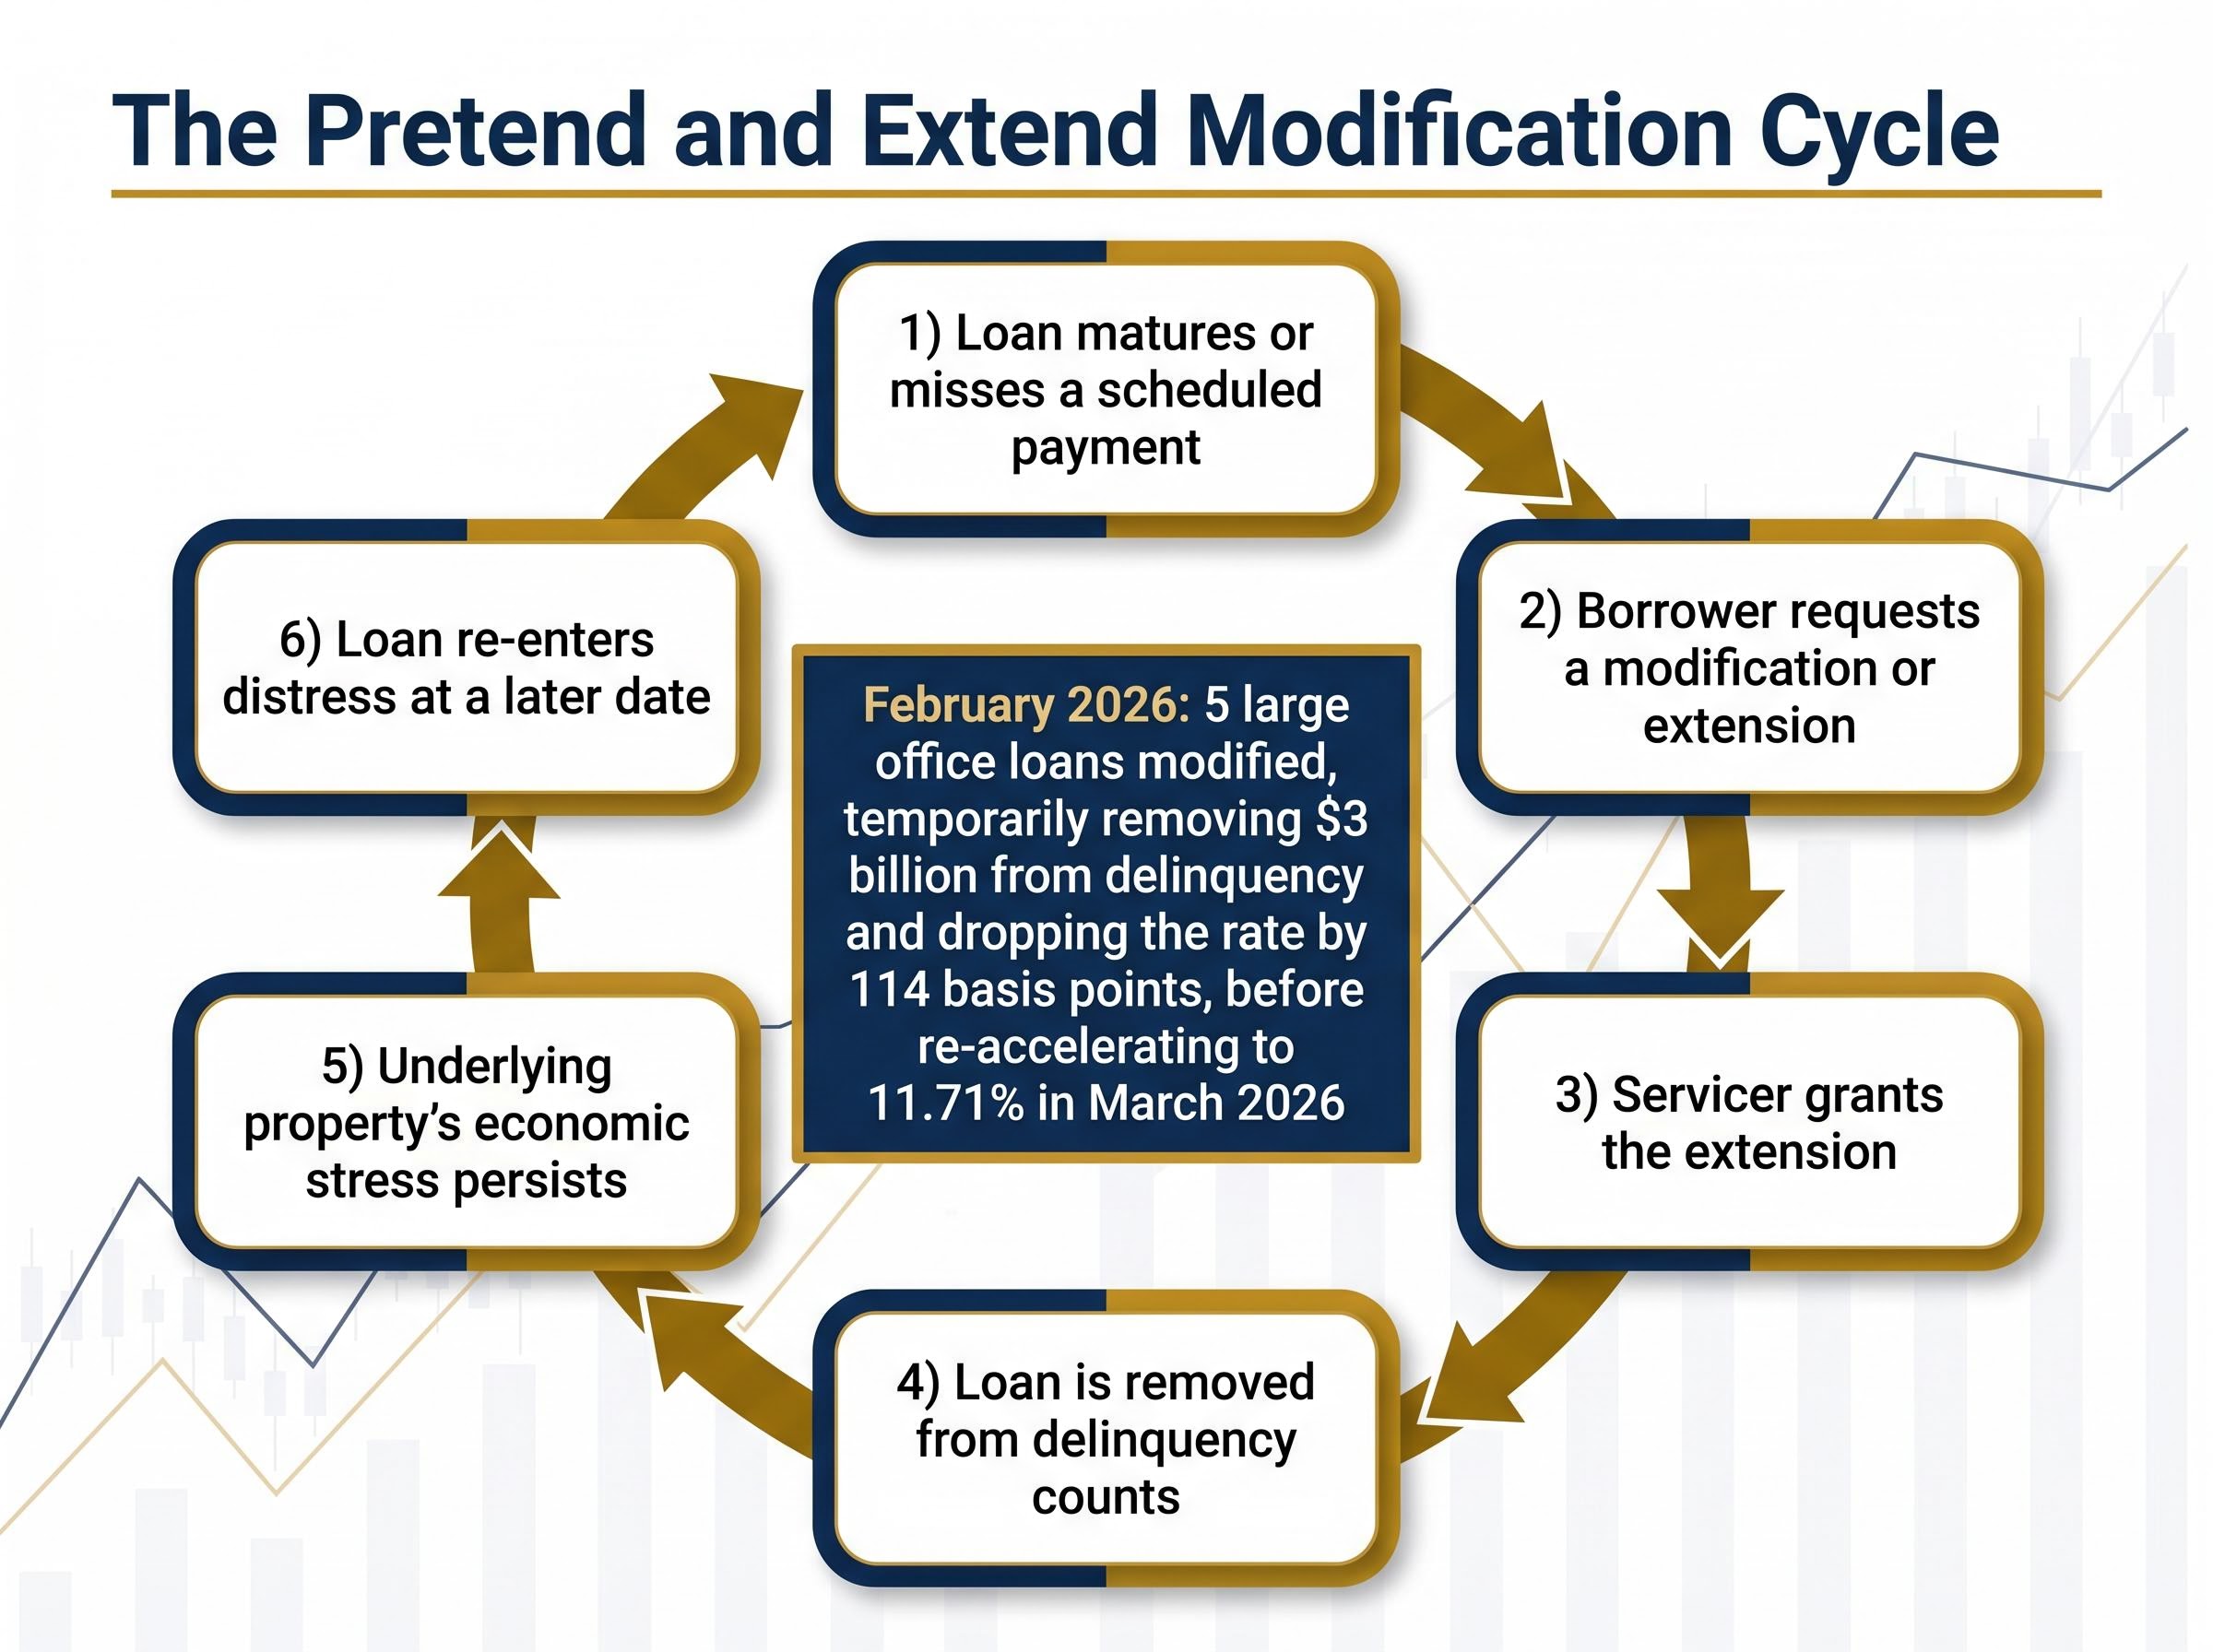
This pattern, sometimes referred to as “pretend and extend,” has become the debt market’s dominant short-term response to CRE stress. It pushes default risk forward rather than eliminating it. CRED iQ’s forward projection reflects this dynamic.
Federal Reserve Bank of New York research on extend-and-pretend in CRE lending draws on loan-level supervisory data to show that banks have systematically extended maturities on impaired commercial real estate mortgages to defer capital loss recognition, providing empirical confirmation that the modification cycle described here is a broad institutional pattern rather than an isolated servicing response.
Forward projection: CRED iQ analysts project distress rising to up to 13% by mid-2026, absent meaningful shifts in financing conditions. A mid-2025 plateau that analysts had anticipated proved premature.
For investors reading monthly delinquency reports, distinguishing between administrative modification activity and genuine credit healing is the difference between misreading the trend and tracking it accurately.
Commercial mortgage-backed securities (CMBS) are securitisation vehicles, meaning pools of commercial property loans are packaged together and sold to investors as bonds. Those bonds are divided into tranches, each carrying different levels of risk and return. Senior tranches absorb losses last and offer lower yields; junior tranches absorb losses first and offer higher yields to compensate.
When a loan within the pool goes delinquent or approaches default, it transfers from the master servicer to a special servicer. The special servicer has authority to modify the loan terms, grant extensions, negotiate with the borrower, or initiate foreclosure. This is the mechanism that produces the modification dynamics described above: a special servicer’s decision to extend a loan can remove it from delinquency statistics without changing the underlying property’s financial health.
Understanding this structure matters because CMBS bonds are held across the financial system. Pension funds, insurance companies, and banks all carry CMBS exposure. Stress in the underlying loans flows through to bond valuations, and potential credit losses affect holders well beyond the original property owner or borrower.
According to Trepp’s “CMBS Hard Maturity Playbook,” published 18 February 2026, $76.6 billion in CMBS hard maturities come due in 2026. These are loans with no extension options remaining; they must be refinanced, sold, or they default.
The maturity profile is back-loaded toward year-end 2026, meaning the full pressure has not yet been reflected in delinquency statistics. No confirmed breakdown of what share of the $76.6 billion has been refinanced, extended, or defaulted is available in public data, which itself represents an information risk for investors attempting to gauge the pipeline of potential defaults still ahead.
The picture behind the headline delinquency numbers becomes sharper when payoff performance is added: securitised payoff rates falling to 60% in Q1 2026 means that roughly four in ten maturing loans are failing to resolve as expected, a data point that reframes the maturity wall from an abstract pipeline figure into an active resolution failure rate.
Five different data providers report CMBS delinquency, and five different numbers emerge. This is not noise; it is a methodological reality that investors need to account for.
| Provider | Reported Delinquency Rate | Reporting Period | Notable Methodology Note |
|---|---|---|---|
| Trepp | 7.55% | March 2026 | Includes matured balloon loans in delinquency calculation |
| CRED iQ (delinquency) | 9.60% | March 2026 | Described as cycle peak; narrower than distress metric |
| CRED iQ (distress) | 12.07% | March 2026 | Includes delinquent plus specially serviced loans |
| S&P Global | 6.2% | March 2026 | Methodology differences in loan universe treatment |
| Fitch | 3.28% | February 2026 | Substantially lower; likely narrower loan universe or definition |
The gap between Fitch’s 3.28% and CRED iQ’s 12.07% is enormous, driven primarily by how each provider treats matured loans, loans in special servicing, and the universe of CMBS deals included. Fitch’s substantially lower figure likely reflects a narrower definition of delinquency, though the exact methodology difference is not detailed in available sources.
Cycle-high marker: CRED iQ’s broader distress metric, capturing both delinquency and specially serviced loans, reached 12.07% in March 2026, the highest level recorded in the current cycle.
The directional signal, however, is consistent across all sources. No provider’s data suggests stabilisation. Stress is expanding, regardless of where the precise rate is pegged. CRED iQ’s distress metric offers the most comprehensive lens because it captures the full population of troubled loans, not just those that have formally missed payments.
Treating CRE debt stress as a single category obscures the sharply different dynamics at work across property types. Office and multifamily, the two sectors driving the bulk of CMBS delinquency, are deteriorating for distinct reasons and at different speeds.
Office sector (Trepp):
Multifamily sector (Trepp):
Office delinquency remains elevated even after February’s modification-driven dip because the sector’s problem is structural, not cyclical. Remote and hybrid work patterns have suppressed absorption rates in major metropolitan markets, and the buildings backing many of these loans have experienced sustained vacancy increases that no extension or modification can remedy. The modifications defer the loan stress. They do not restore the demand that would make the underlying properties viable at their original valuations.
Multifamily distress is rising from a different mechanism. Overleveraged construction loans originated during the 2021-2022 low-rate environment now face refinancing stress as capitalisation rates have moved higher. The month-over-month movement is slower than office, suggesting a less acute but steadily deteriorating trajectory. Where office distress is a long-dated structural problem with no clear resolution catalyst, multifamily stress is rate-sensitive, meaning it could stabilise if financing conditions ease, but will continue to build if they do not.
The Federal Reserve rate path in 2026 is the single largest external variable for multifamily debt stress: with core PCE still above target and growth signals deteriorating simultaneously, the Fed faces a genuine policy bind that makes the rate relief multifamily borrowers need to refinance at viable cap rates far less certain than it appeared at the start of the year.
The analytical arc across these sections points to a consistent conclusion: CRE debt stress is expanding, not stabilising, and the mechanisms that have temporarily suppressed headline figures (modifications, extensions) are deferring rather than resolving the underlying credit deterioration. Converting that diagnosis into a practical monitoring framework requires tracking a small number of high-signal indicators.
The sequence of events that would constitute escalating systemic risk follows a specific order:
The CRED iQ projection of up to 13% distress by mid-2026 provides a near-term test. If the April and May readings continue the March trajectory, that threshold comes into view. The $76.6 billion in hard maturities back-loaded toward year-end adds a timing pressure that compounds as each quarter passes without resolution.
Investors tracking this space directly should monitor four sources at defined intervals:
CRE debt distress tends to evolve slowly and then accelerate. Building a systematic monitoring cadence around these sources allows investors to track trajectory without being overwhelmed by data noise.
The CMBS delinquency data, read across multiple sources and accounting for modification mechanics, points to expanding rather than stabilising stress in commercial real estate debt markets as of Q1 2026. Three risk threads are converging: delinquencies are rising toward potential new cycle highs, the $76.6 billion maturity wall remains largely unresolved with its heaviest concentration still ahead, and regional banks carrying concentrated CRE exposure have limited cushion to absorb simultaneous deterioration across property types.
This is a developing situation with meaningful data points arriving monthly. Investors who understand which metrics to weight and which headline improvements to discount are better positioned than those watching only equity index performance. The next several months of CMBS data, bank provision disclosures, and Federal Reserve stress test results will determine whether the current trajectory stabilises or accelerates into something more consequential.
This article is for informational purposes only and should not be considered financial advice. Investors should conduct their own research and consult with financial professionals before making investment decisions. Past performance does not guarantee future results. Financial projections are subject to market conditions and various risk factors.
CMBS delinquency measures the share of loans within commercial mortgage-backed securities that have missed payments or matured without repayment. It matters because rising delinquency rates signal deteriorating commercial real estate debt quality, which flows through to bond valuations held by banks, pension funds, and insurance companies.
Regional banks hold approximately 45% of their total loan portfolios in commercial real estate, making them disproportionately vulnerable to simultaneous credit deterioration across property types compared to larger, more diversified national banks.
According to Trepp, $76.6 billion in CMBS hard maturities come due in 2026, meaning these loans have no extension options remaining and must be refinanced, sold, or they default. The profile is back-loaded toward year-end, so the full pressure has not yet appeared in current delinquency data.
Sharp monthly improvements are often driven by loan modifications and extensions, which remove loans from delinquency counts without resolving the underlying property stress. The February 2026 office sector drop of 114 basis points, for example, was almost half reversed by March 2026 after the modification effect faded.
Investors should track provision for credit losses as a percentage of total loans, the allowance for loan and lease losses as a percentage of CRE loans, and non-performing CRE loan ratios, alongside the FDIC Quarterly Banking Profile and Federal Reserve Senior Loan Officer Opinion Survey for broader signals.


