
Most investors treat unrealised bond losses as paper figures that vanish if nobody sells. Yet the US 10-year yield sat near 5.02% on 28 October 2026, according to Trading Economics. At the same time, FDIC-insured banks were still carrying US$326.7 billion in unrealised securities losses. That combination is why a bond selloff can matter for bank losses long after the headlines move on.
The stress does not sit in one place. Rising long-term yields, heavy government borrowing and debt-funded AI buildouts all draw on the same financial plumbing.
If you treat them as three separate stories, you can miss how pressure in one area raises the cost of everything else.
Here you will find a map of where strain is most likely to surface first. You will also learn which warning signs point to real risk and which ones are mostly noise.
Why are long-term yields rising across the developed world?
The selloff is not just an American story. Long-term borrowing costs in several major economies have climbed to levels not seen in years.
| Country | 10-year yield | Date |
|---|---|---|
| United Kingdom | 5.35% | 27 October 2026 |
| United States | 5.02% | 28 October 2026 |
| France | 4.94% | 28 October 2026 |
| Greece | 4.31% | 27 October 2026 |
| Germany | About 3.36% | 28 October 2026 |
Yields move during the trading day, so treat these figures as snapshots. The Asian Banker reported the US 10-year at 4.953% intraday on 28 October, when a flight to safety pulled yields lower.
So what is pushing them up? There is no single culprit. Several pressures overlap:
- Fiscal supply. Governments are borrowing heavily. The US adds about US$2 trillion of new debt each year, and Fitch’s October 2026 baseline has France’s debt-to-GDP ratio reaching 128% by 2030.
- A higher term premium. The term premium is the extra return investors demand for locking their money into a long bond instead of rolling over short-term debt.
- Inflation, oil and AI growth expectations. Persistent inflation and stronger expected growth both push yields higher.
- Less central bank buying. Central banks are no longer absorbing government debt at the pace they did during the quantitative easing years. Thomas Hoenig argues that markets now expect less debt monetisation, meaning central banks creating money to buy government bonds, from the Fed, the ECB and the Bank of England.
- A tighter expected policy path. Markets expect interest rates to stay higher for longer.
Term premium at a 12-year high Reuters reported that the US 10-year term premium reached about 96 basis points in October 2026, its highest in 12 years, based on the New York Fed’s model.
Central banks still have emergency tools. The Bank of England bought gilts during the 2022 mini-budget crisis, and the ECB has its Transmission Protection Instrument. These are tools for a crisis, used only when specific conditions are met. They do not amount to ongoing monetisation.
Where the IMF and BIS differ
The IMF reads the move mainly through the economy: inflation, oil prices and AI-linked growth expectations. The BIS puts more weight on term premium and on the compensation investors want for fiscal risk. It estimated that a rise of roughly 10 basis points in the term premium after the late-June shock accounted for about 40% of the overall rise in the 10-year yield.
Both institutions agree that reduced official demand raises the return investors require. Because the causes overlap, a single policy fix or one soft data release is unlikely to reverse the move. You should plan for higher borrowing costs as a lasting feature, not a passing blip.
Higher long-term yields also tighten financial conditions on their own, and this market-driven tightening can reduce pressure on the Fed to act while still raising mortgage and corporate borrowing costs across the economy.
When big ASX news breaks, our subscribers know first
How do unrealised securities losses turn into real bank problems?
Start with the reassuring part. When yields rise, older bonds paying lower interest rates lose market value, because a new buyer can get a better return elsewhere. On paper, the bank holding them is worse off. In practice, that loss often never reaches the bank’s earnings.
Accounting rules explain why. Held-to-maturity securities, which the bank intends to keep until they are repaid, are carried at amortised cost, meaning their original purchase value adjusted over time. Available-for-sale securities are marked to market, but those losses generally do not have to be charged against regulatory capital.
US Treasuries add another layer of comfort. They carry a zero risk weight for capital purposes because repayment is highly likely. They still carry duration risk, which is the sensitivity of a bond’s price to interest rate changes.
The latest figures look manageable at first glance:
Losses shrinking relative to holdings FDIC data for Q2 2026 shows unrealised losses equal to 5.5% of amortised cost, down from 6.8% a year earlier.
The dollar figure edged up to US$326.7 billion from US$325.1 billion in Q1. Even so, industry net income reached US$90.1 billion, up 12.0% on the prior quarter. The Federal Reserve said available-for-sale losses fell to US$98 billion at the end of 2025, less than a third of their 2022 peak. Reuters put the industry’s accumulated other comprehensive income balance, where many of those paper losses sit, at negative US$156.64 billion.
The dollar figure matters less than its composition, because most unrealised securities losses sit in held-to-maturity holdings that generally do not reduce capital unless the bank is forced to sell or the securities become impaired.
Silicon Valley Bank showed how paper losses become real ones:
- Yields rise.
- Bond values fall.
- Depositors lose confidence and withdraw cash.
- The bank must sell bonds before maturity.
- The loss is locked in.
The danger lies in the combination of long duration, flight-prone deposits, cash needs and fragile confidence.
| Factor | Resilient profile | Vulnerable profile |
|---|---|---|
| Funding | Diversified deposits, wholesale market access | Concentrated, flight-prone deposits |
| Duration | Able to hold securities to maturity | Long-dated holdings that may need to be sold |
| Capital | Higher capital, fee and trading income | Thinner buffers, reliant on interest margin |
Hoenig argues that large banks are too big to fail and can adjust the rates they pay on deposits. Changing the accounting rule for unrealised losses could strengthen banks but slow lending. It is unlikely to happen soon, because governments need buyers for their bonds.
For you, the headline loss figure matters less than who holds the securities and how stable their funding is. A bank’s deposit base is a better warning signal than the aggregate number.
What makes leveraged AI borrowers like CoreWeave and Oracle vulnerable?
Higher rates hit borrowers who depend on debt first, and AI infrastructure is heavily debt-funded. CoreWeave is a “neocloud”, a company that buys graphics chips and rents out AI computing power. It borrows to buy the hardware before the rental revenue arrives, which makes the cost of refinancing central to its business model.
Its credit market signals are flashing red. Reuters reported total debt of about US$50 billion, 2031 bonds yielding roughly 15-16%, and credit default swap spreads of about 1,000-1,200 basis points. A credit default swap is a contract that pays out if a borrower defaults, so its price tracks perceived default risk.
A sharp repricing in five months A CoreWeave bond issued at a 9.675% yield in June traded near 15% in October, according to Reuters.
That money came from a web of lenders. Facilities of US$2.3 billion in 2023, US$7.5 billion in 2024 and US$8.5 billion in 2026 involved Blackstone, Magnetar, Carlyle, BlackRock and major banks.
Oracle sits further along the spectrum. Reuters reported debt of US$129.5 billion, about 4.3 times EBITDA (earnings before interest, tax, depreciation and amortisation). The company has signed about US$260 billion of data centre leases and plans up to US$95 billion of fiscal-2027 capital spending. Oracle generates far more cash than CoreWeave, but its leverage could approach levels tied to a further credit downgrade.
| Company | Total debt | Stress signal |
|---|---|---|
| CoreWeave | About US$50B | Bonds near 15-16%, CDS 1,000-1,200 bps |
| Oracle | US$129.5B | Debt about 4.3x EBITDA, downgrade risk |
Why the share price and bond price tell different stories
Reuters had CoreWeave shares down 13% in 2026 as of 21 October. Earlier reporting showed a 40% fall in October and a drop of about 63% from the May high. These measure different periods, so they do not contradict each other.
The bond market’s message is clearer. A yield near 15% tells you investors are pricing meaningful default risk. Cheap money for AI infrastructure has turned from a tailwind into a constraint, and credit signals often show stress before equity prices do.
How could private credit and insurers link AI debt back to banks?
The risk does not stay with the borrower. Private credit is lending by investment funds rather than banks, and it creates a chain that can carry stress a long way:
- An AI infrastructure company borrows.
- A private credit fund provides the loan.
- An insurer holds the fund’s exposure on its balance sheet, backed by policyholder money.
- A private equity sponsor often owns the insurer.
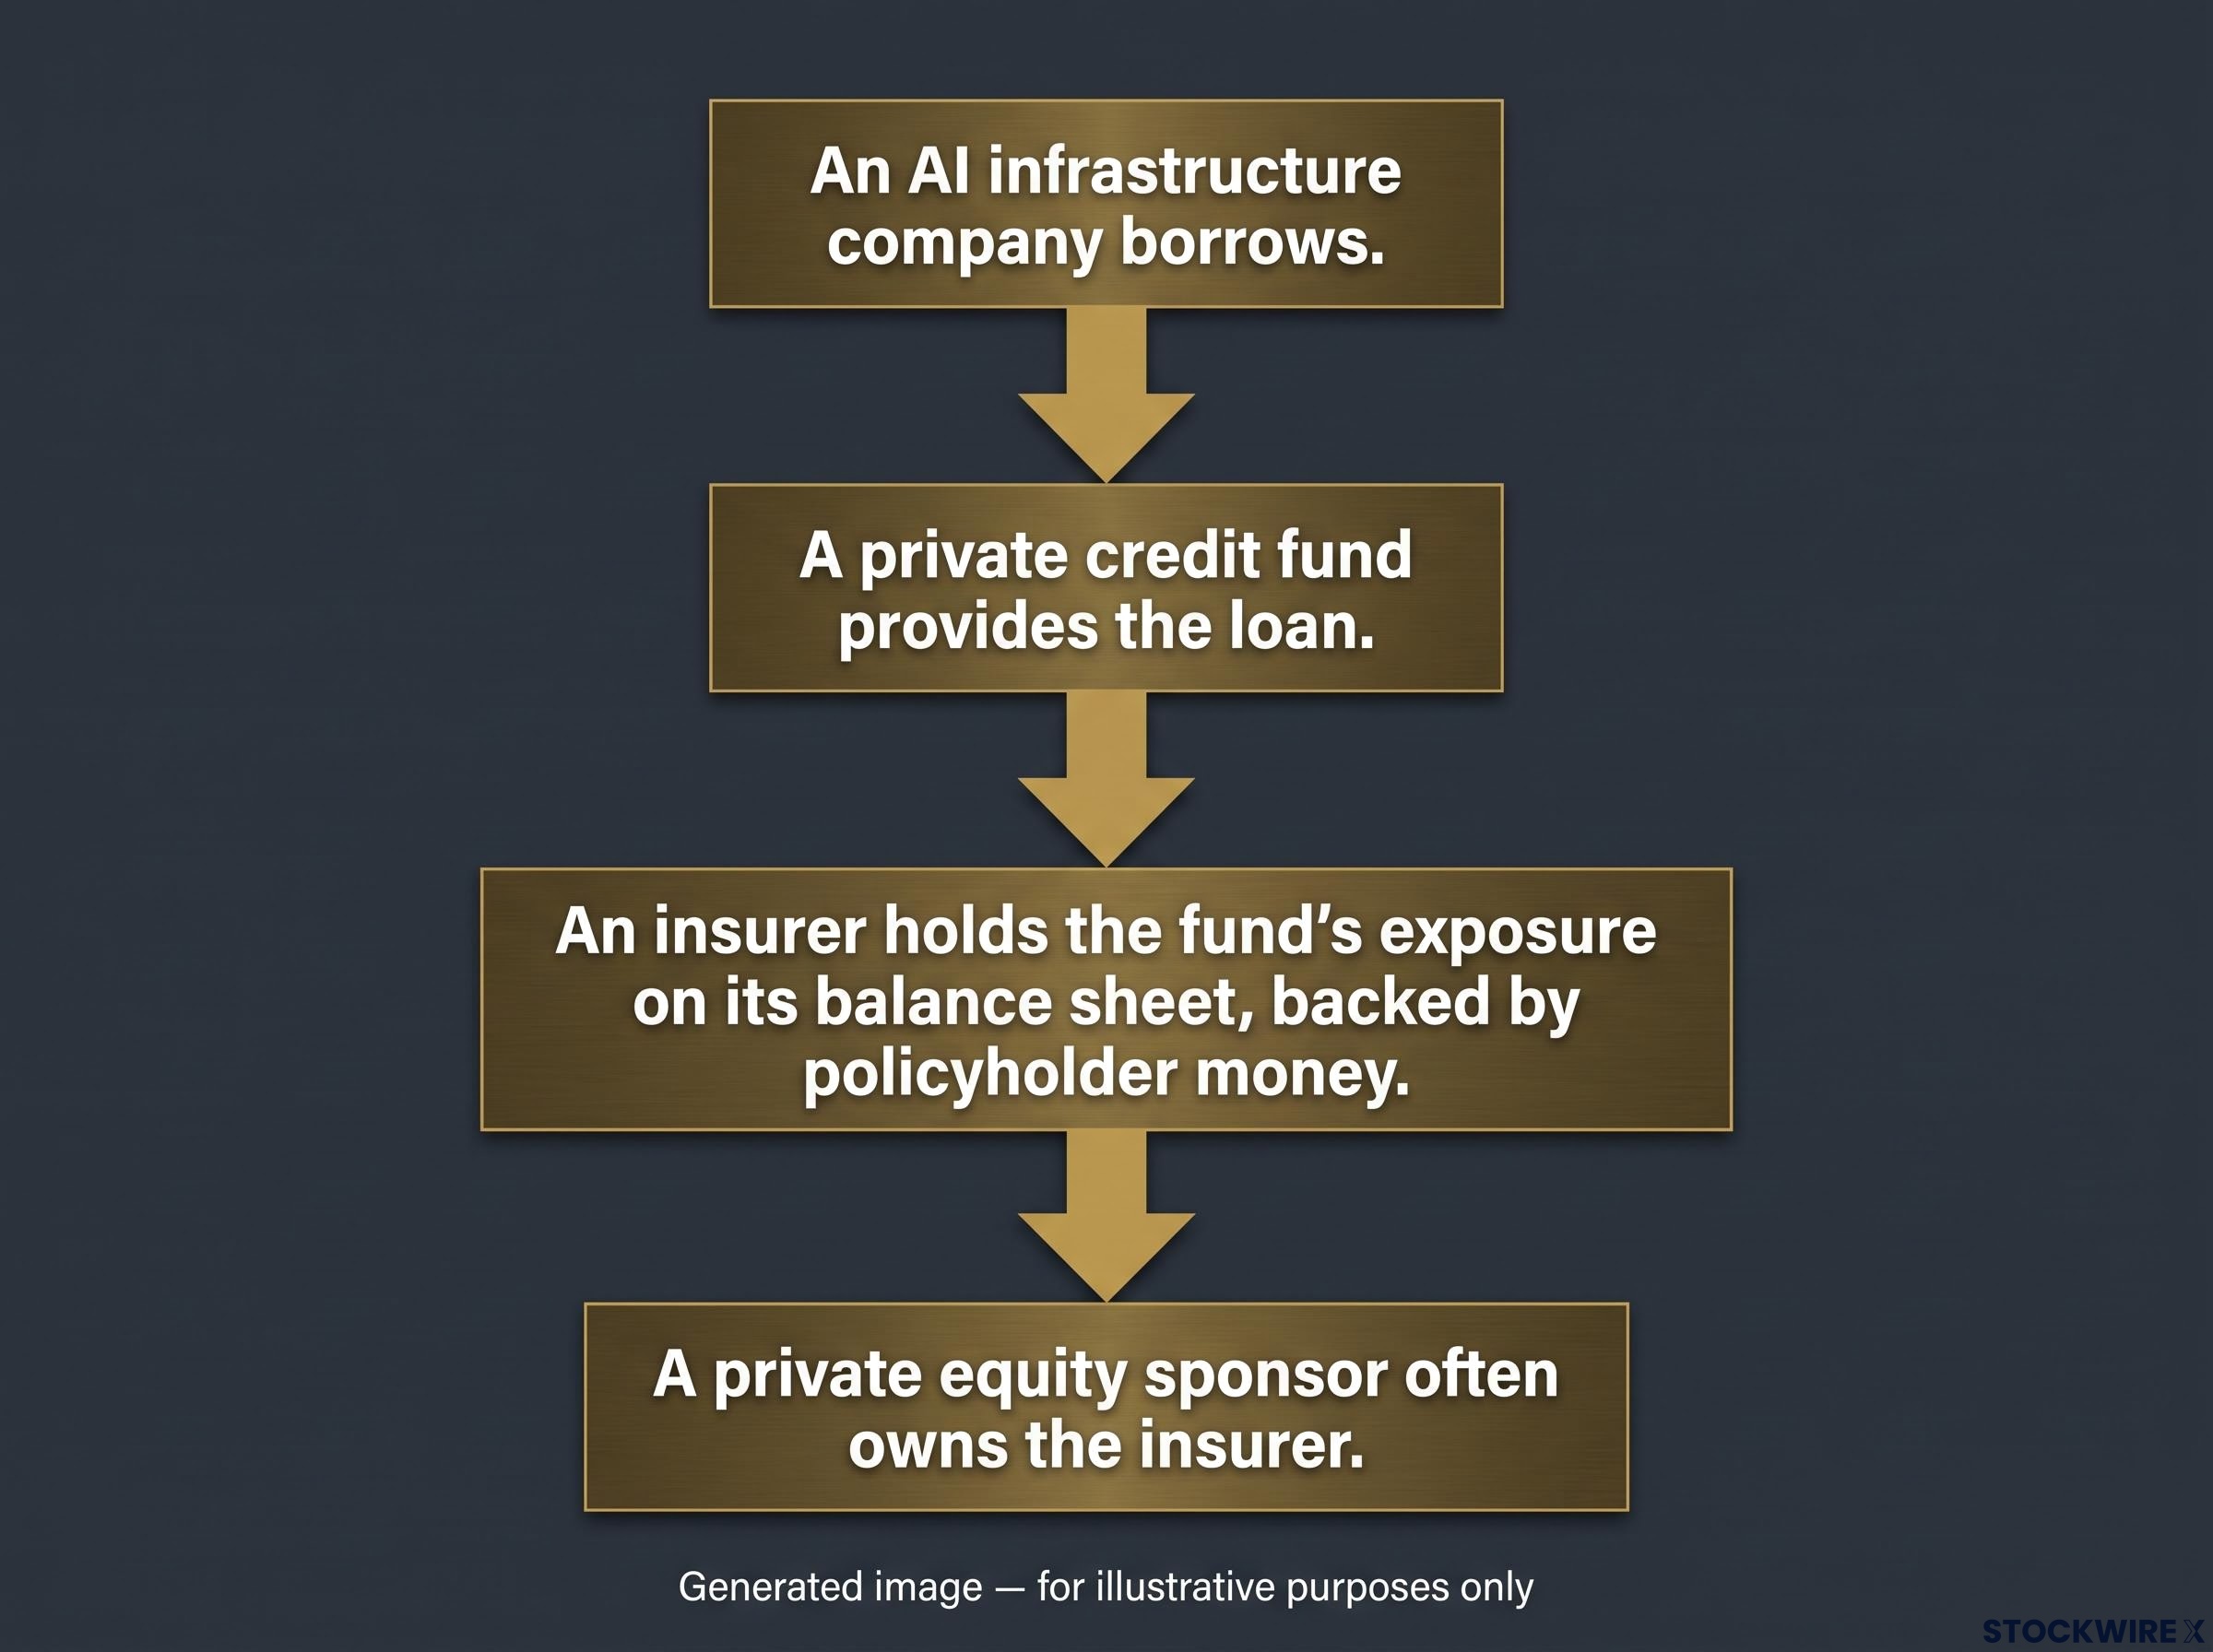
Hoenig describes private-equity-owned life insurers channelling policyholder funds into private credit, which then lends to other private equity companies. Banks lend to this ecosystem indirectly and, in his view, are growing more cautious.
The model has real advantages:
- Higher yields for insurers and their policyholders
- Financing that sits outside the regulated banking system
It also brings risks:
- Limited visibility into what is held
- Valuations that update slowly
- Exposures that can all fall at once
- Insurers that may face withdrawals while their assets are hard to sell
The IMF has sketched how that pressure could build. Its 13 October 2026 World Economic Outlook projects global growth of 3.1% in 2026 and 3.4% in 2027. In its downside scenario, a sharp drop in AI investment would cut global GDP by 1.1% by 2028 and US output by 1.8%.
The IMF’s “triple-whammy” AI equity values fall, debt becomes harder to service, and the revenues companies expected never arrive.
Circular financing makes this worse, because AI companies lend to and buy from one another. Stress at one firm can cut revenues and valuations at others.
Be clear on one point: no specific realised loss at a private-equity-owned life insurer from AI private credit has been documented. This is a plausible pathway, not a confirmed event. Because private credit valuations adjust slowly, you should read calm reported values as a lagging signal rather than proof of health.
Calm reported values can mislead because public BDCs holding similar assets have traded at 17-26% discounts to stated net asset values, while billions in redemption requests have been gated at semi-liquid funds.
Is this the dot-com bust again, or something different?
The parallel is easy to draw. Both cycles feature excitement about a world-changing technology, valuations resting on future earnings, and the risk of a sharp repricing if commercial results disappoint.
The differences matter more.
| Feature | Dot-com bust | Today’s AI cycle |
|---|---|---|
| Funding source | Mainly equity | Heavily debt-financed |
| Bank exposure | Limited | Greater, direct and through private credit |
| Cushion | Fed liquidity support | Real revenues at many leaders, but tighter fiscal room |
Today’s buildout is also far more capital-intensive, with spending on chips, power and data centres. Private credit, insurers, banks and tech companies are more closely tied together. The differences cut both ways: more revenue backing, but more debt and more linkage.
How imminent is a crisis? Three views
Hoenig’s warning In the source interview, Hoenig argued that crisis risk rises unless Congress addresses the national debt, and said he sees no sign that it intends to. No fresh dated quotation has been confirmed since.
- The warning view: a loss of investor confidence could force a sudden fiscal adjustment that spills into banks and markets. US federal debt sits around US$40.5 trillion and France near 120% of GDP, according to the original source.
- The reassuring view: the US issues the world’s main reserve asset, large banks hold substantial capital, and sovereign bond losses are manageable if held to maturity.
- The middle ground: the IMF and BIS forecast no inevitable crisis, but they see rising yields, fiscal strain and leveraged AI finance reinforcing one another.
Hoenig points to the mid-1990s, when debt reduction allowed a gentler adjustment. That kind of repair is harder now because debt, ageing-related costs and interest bills are all larger. Fitch and the IMF warn that higher yields make fiscal repair more urgent, because more debt means higher interest costs, which in turn means more borrowing.
The useful question is not whether history repeats. It is which links in today’s chain are strongest.
What to watch as yields, bank balance sheets and AI debt collide
Stress is most likely to surface where long duration, unstable funding and high leverage overlap, not evenly across the system. Four indicators can tell you whether that overlap is tightening:
- The US 10-year yield and the term premium
- The FDIC unrealised-loss trend and deposit stability at smaller banks
- AI borrower bond yields and credit default swap spreads
- Any legislative movement on the US national debt
Keep the gaps in mind as well. There is no fresh Hoenig quotation, no updated US debt total and no named insurer loss. Treat the risk as real but unproven, and let these signals, rather than headlines, guide your judgement.
This article is for informational purposes only and should not be considered financial advice. Investors should conduct their own research and consult with financial professionals before making investment decisions. Past performance does not guarantee future results. Financial projections are subject to market conditions and various risk factors, and forward-looking statements are speculative and subject to change.