The best-performing G10 currency in 2026 is not the US dollar. It is not the yen. It is the Australian dollar, and it is not particularly close.
That story just got more interesting. The July 2026 inflation print landed above expectations, the Reserve Bank of Australia’s (RBA) August meeting minutes revealed a board actively debating whether to raise rates again, and futures markets have repriced a November 2026 rate hike from a tail risk to a live option. For anyone holding AUD-denominated assets, watching carry trades, or trying to read where Australian monetary policy is headed into year-end, the convergence of these three signals matters.
Here is what the data actually tells you about where the Australian dollar goes from here, and what a higher-for-longer rate environment means for the assets most sensitive to it.
How the Australian dollar became the G10’s standout performer in 2026
The numbers are not ambiguous. According to DBS Group Research analyst Philip Wee, as reported by FXStreet, AUD/USD had climbed approximately 7.6% on a year-to-date basis by 26 August 2026, with the pair sitting at around $0.7178. That cumulative move reflects a 1.5% advance through July followed by a further 2.2% gain in the weeks to late August.
- AUD/USD level: approximately $0.7178 (26 August 2026)
- Year-to-date gain: 7.6% through late August 2026
- July 2026 gain: 1.5%
- August 2026 gain (through 26 August): 2.2%
Philip Wee of DBS Group Research identified the Australian dollar as the top-performing G10 currency on a year-to-date basis through late August 2026.
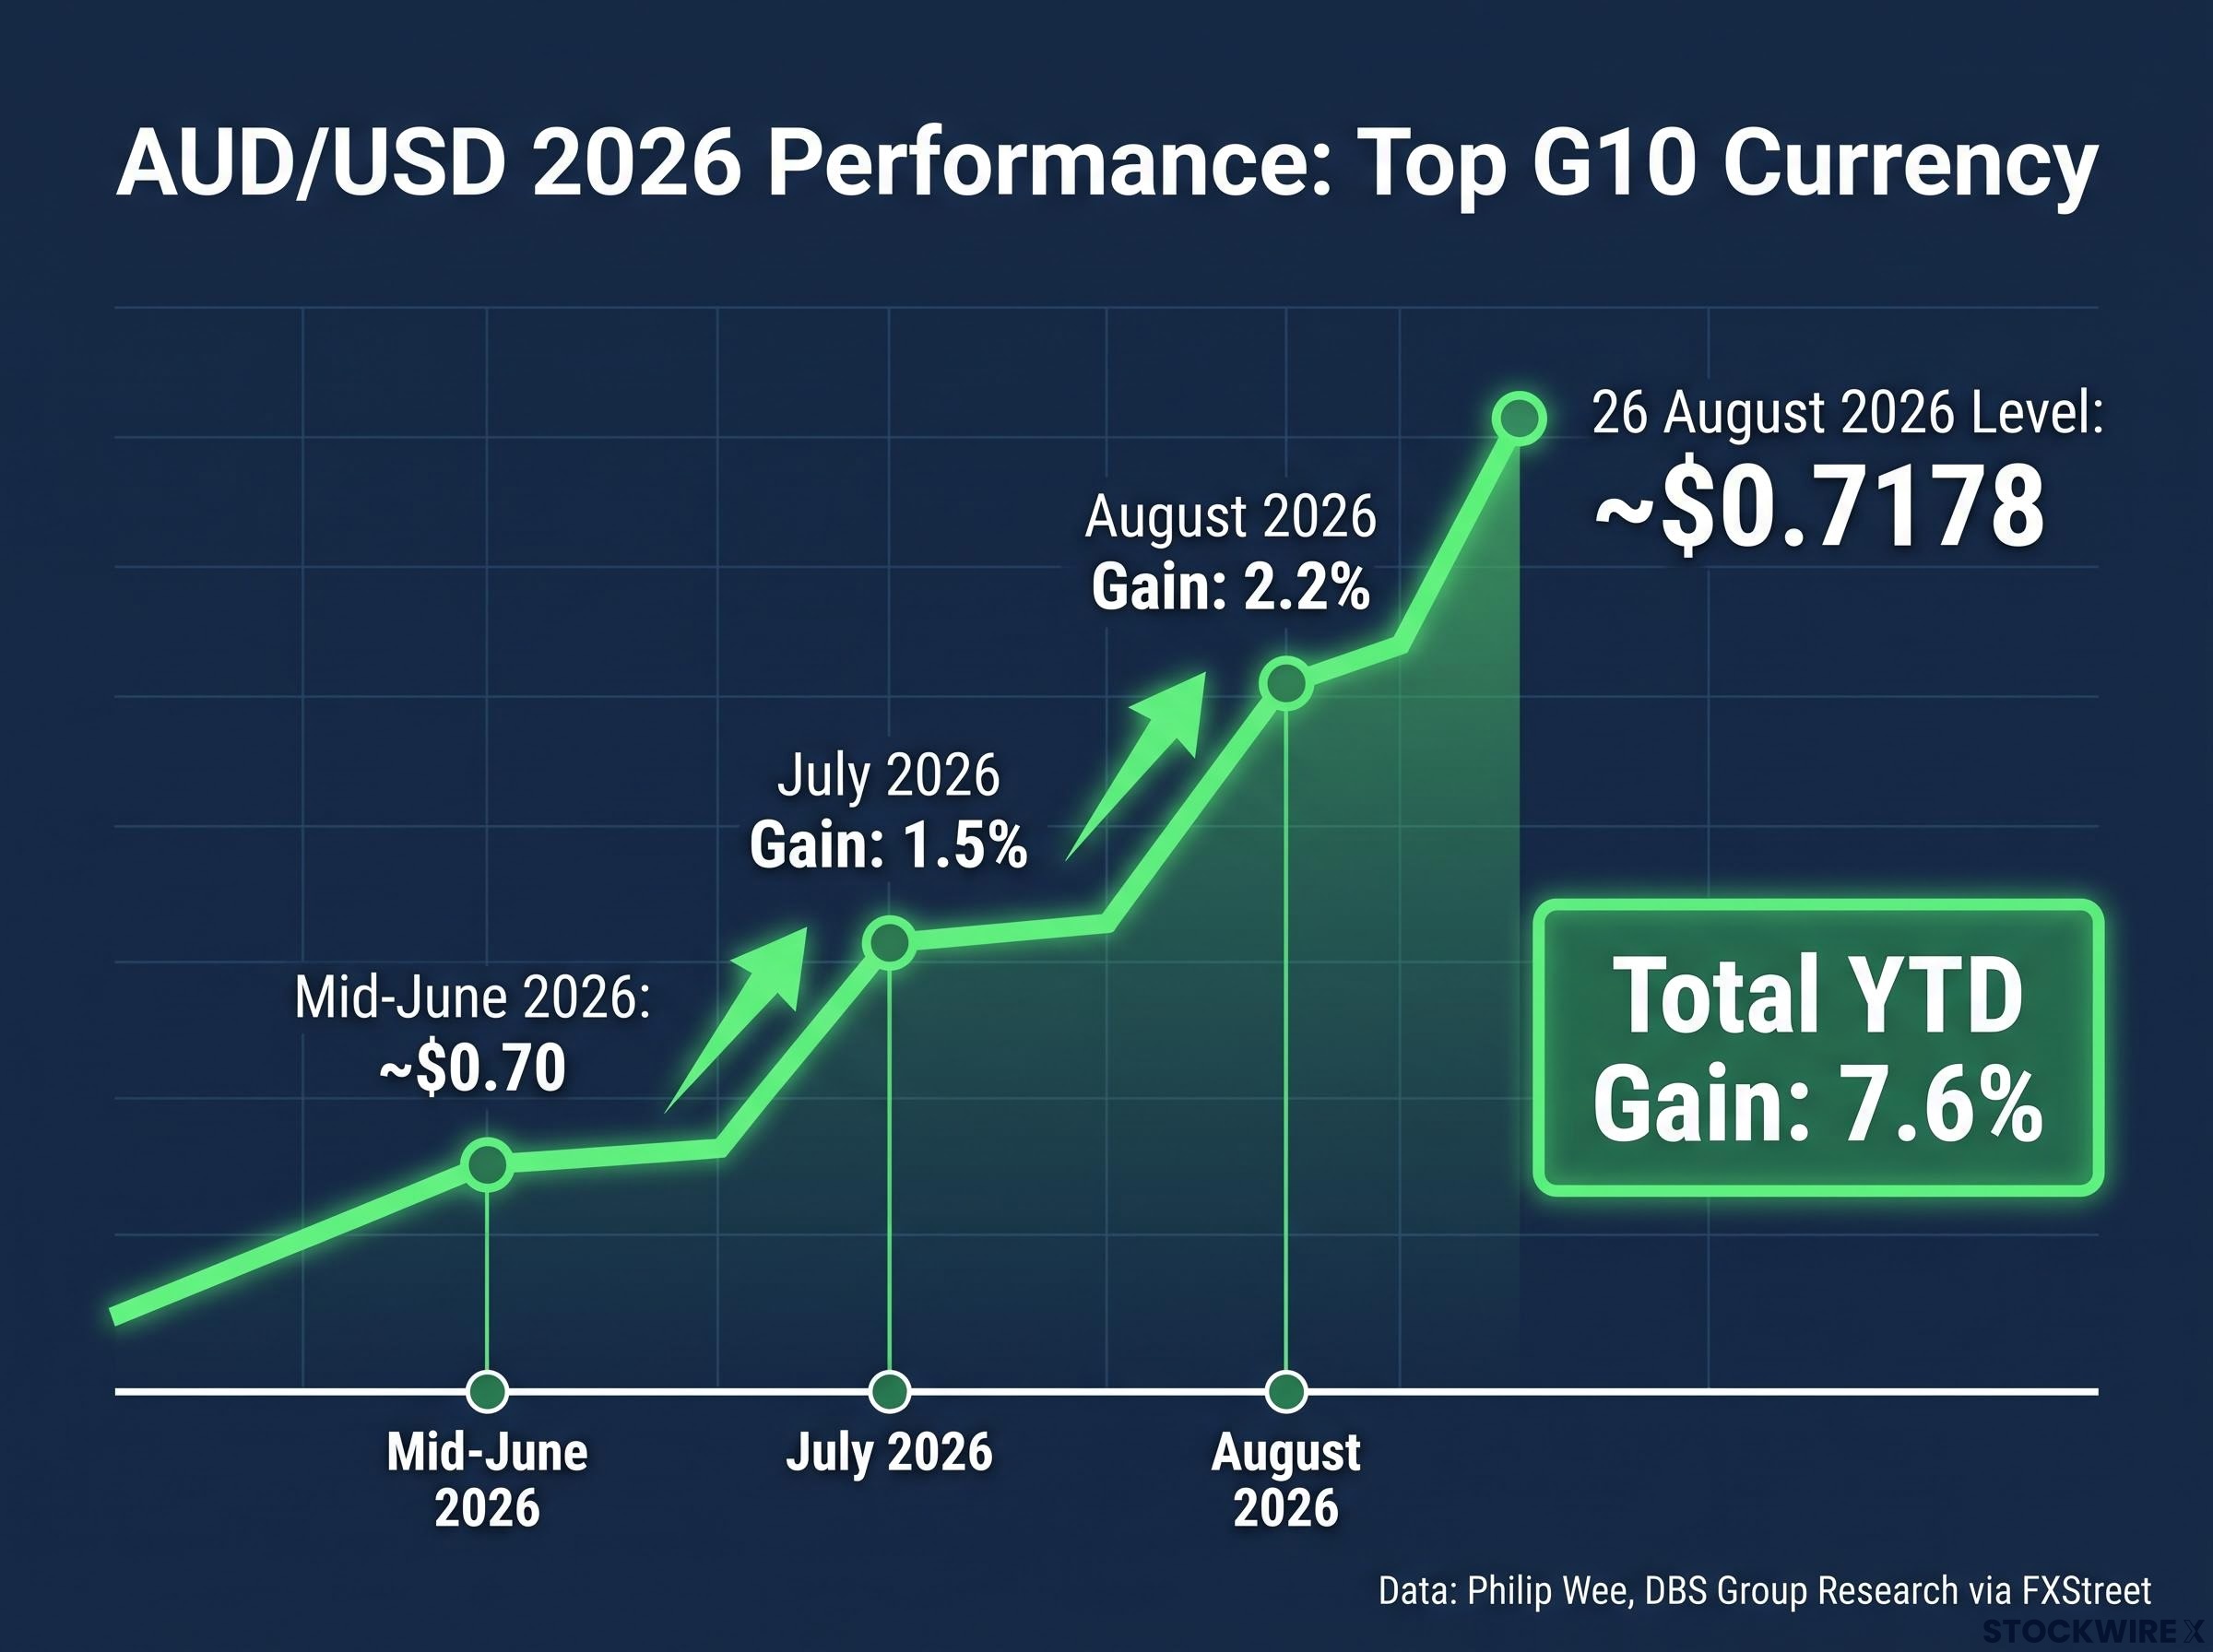
What makes those gains particularly telling is the context in which they occurred. The AUD strengthened against the US dollar even as the Federal Reserve maintained a hawkish posture. Back in mid-June 2026, the FOMC delivered a notably hawkish signal at its 17 June meeting, at which point AUD/USD was hovering close to $0.70; many expected that US rate guidance would keep the pair capped at those levels. The Australian dollar confounded that view and moved considerably higher regardless.
The explanation is structural rather than speculative. Australia holds the highest policy rate among G10 currencies. That yield advantage is what attracts capital into AUD-denominated assets and sustains the carry trade, where investors borrow in lower-yielding currencies and park capital in higher-yielding ones. This is not a momentum-driven spike that dissolves on the next risk-off session. The appreciation has a fundamental anchor: the rate differential itself.
The global rate divergence that has widened Australia’s yield advantage over the G10 field accelerated sharply at the May 2026 meeting, when the RBA raised its cash rate to 4.35% while the Federal Reserve, ECB, and Bank of England all held, creating a spread of up to 235 basis points between Australia and its major developed-market peers.
Understanding that distinction matters. A currency rallying on sentiment can reverse overnight. A currency rallying on yield advantage holds as long as the rate gap holds, and the inflation data suggests that gap is not narrowing any time soon.
When big ASX news breaks, our subscribers know first
What July’s inflation data actually showed, and why the trimmed mean is what matters
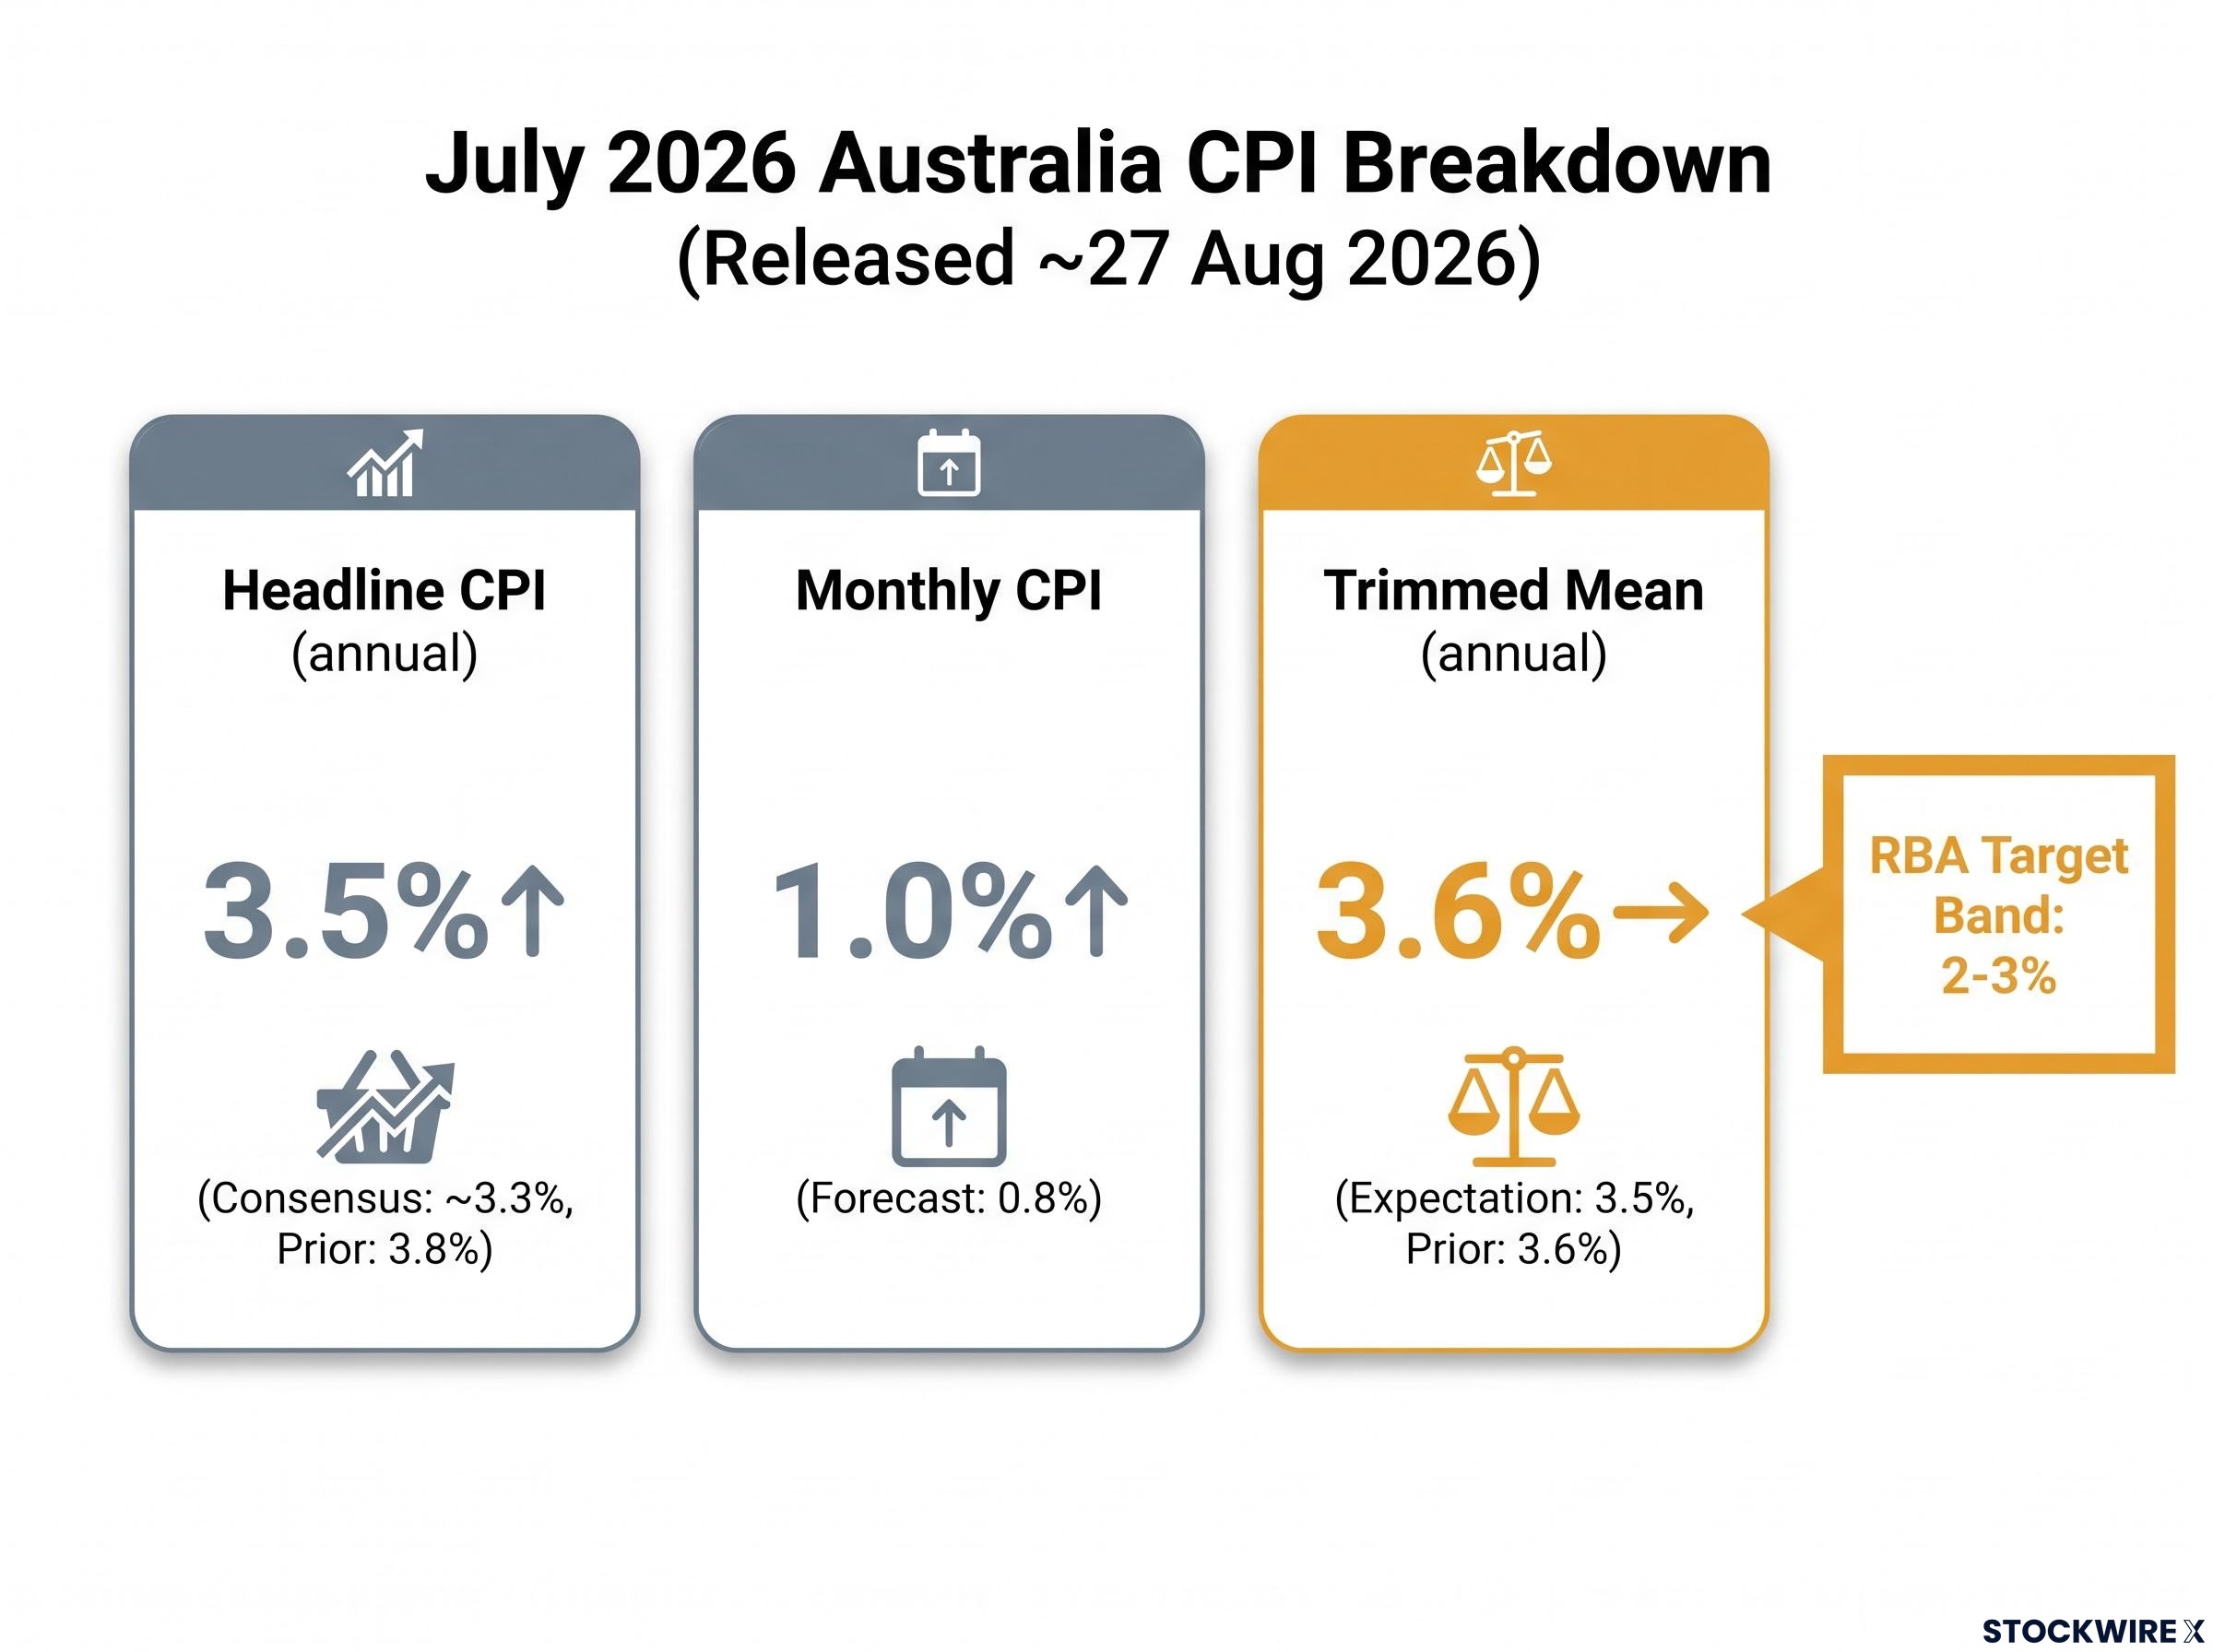
The headline number looked like progress. July 2026 saw Australia’s Consumer Price Index (CPI) print at 3.5% year-on-year, a step down from the 3.8% recorded in June. That direction is welcome. But the headline was still above the consensus estimate of roughly 3.3%, and monthly CPI came in at 1.0% against forecasts of 0.8%.
The real signal, though, sits in a different number entirely.
| Measure | Outcome | Consensus / Prior |
|---|---|---|
| Headline CPI (annual) | 3.5% year-on-year | Consensus: ~3.3%; Prior: 3.8% |
| Monthly CPI | 1.0% | Forecast: 0.8% |
| Trimmed mean (annual) | 3.6% year-on-year | Expectation: 3.5%; Prior: 3.6% |
The Australian Bureau of Statistics (ABS) released the data on approximately 27 August 2026. Most market commentary led with the headline decline from 3.8% to 3.5%, which is understandable. It is the wrong number to focus on.
The ABS July 2026 CPI release confirmed the headline annual rate at 3.5%, the trimmed mean at 3.6%, and the monthly CPI at 1.0%, providing the primary data set that shifted market pricing on the November rate hike from a contingency to a live scenario.
Why the trimmed mean is the RBA’s signal, not the headline
The trimmed mean is the measure the RBA monitors most closely when deciding whether to move on rates. It strips out the most volatile price movements at both ends of the spectrum, both the sharpest rises and the sharpest falls, to reveal what underlying inflation is actually doing once you remove the noise.
The RBA has publicly stated that the trimmed mean is central to its policy calibration. When the board looks at inflation, this is the number that shapes the conversation.
July’s trimmed mean reading came in at 3.6% year-on-year, flat relative to the prior month and a tenth above the 3.5% the market had anticipated, leaving it well outside the RBA’s target band of 2-3% over the economic cycle. That stasis is the signal. Underlying price pressures are not responding to current policy settings the way the RBA had hoped. It is that stubborn 3.6% reading, not the headline decline, that is driving the repricing of rate expectations.
What the RBA’s August minutes reveal about the board’s thinking
The minutes from the RBA’s August 2026 meeting carried a tone that markets could not ignore. Members of the board raised the question of whether pre-emptive action on rates was justified, given that the risks around their inflation outlook were skewed to the upside. That language is important. A board debating whether to act proactively is a qualitatively different signal from a board acknowledging that rates could, in theory, move higher. The first is an active consideration. The second is a hedge.
The RBA tightening bias that markets are now interpreting through August’s minutes was already visible in the board’s August statement language, where the distinction between holding with optionality and signalling a genuine pause carried direct implications for bond yields, the AUD, and rate-sensitive equities in real estate and utilities.
When those minutes landed alongside the July CPI print, the market reaction was immediate:
- Three-year government bond futures fell following the July CPI release
- Implied probability of another RBA rate hike increased materially
- AUD/USD rose approximately 0.3% on the day of the CPI release, reaching roughly $0.7183, according to Reuters
Reuters characterised the July inflation data as “adding to rate hike risk,” reflecting the shift from a theoretical possibility to a near-term scenario markets are pricing.
November 2026 is now the timeline markets are treating as live for a potential rate increase. Before the August minutes and the July inflation print, additional tightening was framed as a remote contingency. That framing has shifted. What changed was not the data alone, nor the minutes alone, but the reinforcement between them: sticky core inflation confirmed by a central bank that is telling you, in its own minutes, that it is debating whether to do something about it.
For Australian investors, this is the mechanism connecting the macro data to portfolio positioning. The RBA’s own language translated directly into the bond and currency market repricing that drove the AUD’s August move.
What higher-for-longer rates mean across Australian asset classes
The macro signal has been established: rates may stay higher for longer, and a November hike is a live possibility. The question that matters now is what that does to the assets you actually hold.
- Fixed income: Higher-for-longer supports shorter-duration AUD fixed income instruments, where reinvestment at higher yields is a direct benefit. Longer-duration bonds face renewed upward pressure on yields as markets extend their rate expectations, which pushes prices lower.
- Equities: A late-2026 rate hike would weigh on highly leveraged and rate-sensitive sectors, with real estate investment trusts and utilities the most exposed. Bank net interest margins, however, could see some support from a wider spread between lending and deposit rates.
- Household and consumer sector: Australia’s structurally high household debt and predominance of variable-rate mortgages mean any further rate increase directly amplifies mortgage stress for variable-rate borrowers, with flow-on effects for consumer spending and credit conditions.
- Currency: Higher domestic rates relative to lower-yielding G10 currencies sustain the AUD’s carry appeal, provided the global risk environment remains constructive. A risk-off shock could override that advantage.
The variable-rate mortgage dynamic that makes Australia different
Australia’s mortgage market is dominated by variable-rate loans. Unlike the United States, where 30-year fixed rates insulate most borrowers from rate movements, RBA rate decisions flow through to household mortgage repayments almost immediately.
That makes monetary policy transmission faster and more potent. A 25-basis-point hike in Australia delivers a cash-flow hit to household budgets within weeks, not years. The consumption headwind that creates can itself act as an inflation dampener without requiring further rate increases, because spending slows in response.
This structural feature shapes the RBA’s own calculus. The board knows that each additional hike carries more household impact per basis point than its counterparts in fixed-rate-dominated economies. That constraint means the RBA may have less room to tighten than the headline rate level suggests. If you are building a view on how far rates can realistically go, the variable-rate mortgage structure is the factor that sets the ceiling.
The variables that will determine where the AUD goes from here
The AUD’s 7.6% year-to-date appreciation is defensible on current data. Whether it holds depends on five variables, ranked by their direct relevance to the RBA’s November decision:
- Domestic trimmed mean inflation: This is the most direct determinant. A further reading at or above 3.6% reinforces the hike thesis. A clear downward move toward 3.5% or lower gives the board room to hold.
- Labour market conditions: A resilient labour market supports the case for further tightening. Unexpected softness in employment data would reduce urgency.
- Chinese commodity demand: Australia’s export earnings are heavily exposed to iron ore, coal, and liquefied natural gas. A slowdown in Chinese demand compresses Australia’s terms of trade and weakens the economic case for tighter policy.
- Global risk sentiment: A sharp deterioration in global growth or a risk-off environment could override the domestic inflation story and see the AUD retrace recent gains regardless of the rate differential.
- Federal Reserve posture: Any Fed pivot or pause shifts the global rate differential calculus. If the US begins easing while Australia is still tightening, the carry advantage widens further. If the Fed stays hawkish, the differential remains contested.
Carry currency positioning in the AUD sits within a broader institutional shift away from the US dollar, with UBS formally recommending the Australian dollar alongside the British pound, New Zealand dollar, Norwegian krone, and Swedish krona as preferred non-dollar holdings ahead of what major banks are framing as the dollar’s next cyclical decline.
The two scenarios are clear: a further upside inflation surprise reinforces the bullish AUD and November hike narrative; a downside surprise in inflation or activity data, or a deterioration in global growth, unwinds both.
The honest read is that the AUD’s 2026 gains have a fundamental basis that distinguishes them from speculative currency moves, but the outcome is not yet determined. The next six to eight weeks of data, particularly the following CPI print and RBA communications, are the period that resolves the question.
Where the rate-hike thesis stands heading into the final quarter of 2026
Four threads now point in the same direction. The AUD’s structural rate advantage over the G10 field is the broadest foundation. The trimmed mean’s stubborn hold at 3.6% is the specific data point that keeps the pressure live. The RBA board’s explicit debate about proactive tightening converts that data into policy intent. And the asset-class implications, from shorter-duration fixed income benefiting to variable-rate borrowers absorbing the strain, map the real-world consequences.
The thesis is well-supported by current evidence. It is not yet confirmed. The next monthly CPI print and the RBA’s subsequent communications are the data points that will either validate the November hike pricing or give the board enough cover to hold. The reader who has followed the trimmed mean, the minutes language, and the five forward variables is now equipped to read those releases with the same framework the market is using.
For investors building a view on how far the tightening cycle can realistically extend, our dedicated guide to the RBA rate plateau outlook examines all four major bank forecasts and the second-round inflation pass-through mechanisms that determine whether the November hike becomes the ceiling or a stepping stone.
This article is for informational purposes only and should not be considered financial advice. Investors should conduct their own research and consult with financial professionals before making investment decisions. Past performance does not guarantee future results. Financial projections are subject to market conditions and various risk factors.
—