
The 10-year US Treasury yield is sitting near 5%, yet no one in the futures market is betting that the Federal Reserve will lift its policy rate to 5%. If that gap looks odd, there is a second puzzle in the same week. Copper, aluminium and oil all rose while gold slipped below US$4,000 an ounce.
Both puzzles trace back to rate hike pricing, which is how markets turn rate expectations into probabilities that move asset prices. A hotter-than-expected October consumer price index (CPI) report showed headline inflation up 0.4% and core up 0.3%. That pushed traders from pricing two quarter-point Fed hikes to about three by mid-2027.
The next test is the Federal Open Market Committee (FOMC) meeting on 8-9 December 2026. The same shock is already visible in Australian housing finance data and in what markets expect from the Reserve Bank of Australia (RBA).
Here is a working model of how rate expectations travel from the Fed to gold, industrial commodities and Australian mortgages. It also covers the signals worth watching before December.
What does it mean when markets price three Fed hikes?
Start with the headline: three hikes by mid-2027. That sounds like a forecast, but it is not one.
Rate hike pricing refers to the path for the policy rate implied by futures contracts. A futures contract is an agreement to buy or sell at a set price on a future date, and its price shows what traders collectively expect. When you read that a hike is “priced in”, it means the market has assigned it a high probability. It does not mean the Fed has committed to it.
The starting point matters. The Fed raised its target range by 25 basis points (a basis point is one-hundredth of a percentage point) to 3.75%-4.00% in September. After the October CPI print, released on 10 November, the pricing has three layers:
- December: a 25-bp hike is effectively fully priced
- The tail risk: roughly a 10% probability of a 50-bp move
- 2027: about three 25-bp hikes by mid-2027, with pricing flirting with a fourth late in the year
Fed officials have fed that tail risk. Kansas City Fed President Jeffrey Schmid said policy remains relatively accommodative and that controlling inflation is the priority.
The 50-bp conditional Governor Christopher Waller backs a 25-bp December hike but has said a 50-bp move should be considered if core CPI comes in at 0.3% or higher. October’s core reading hit that mark.
Long-term yields followed. After the Veterans Day closure of the cash bond market yesterday, futures pointed to the 10-year yield returning above 5.01%.
For you, the point is that the market is repricing a path, not a single meeting. That means the next data point can move bonds, currencies, gold and commodities at once, even if the Fed does nothing unexpected in December.
With no forward guidance from the Fed, you have to read the path from inflation prints and the 2-year yield rather than from official signals, so each data release carries more repricing weight than it once did.
When big ASX news breaks, our subscribers know first
Why is the 10-year yield near 5% if the policy rate is below 4%?
This is the contradiction from the opening, and it resolves once you see what a long yield contains. The policy range tops out at 4.00%. The 10-year sits near 5%. The extra percentage point reflects more than the Fed’s next few moves.
A 10-year yield bundles together three things:
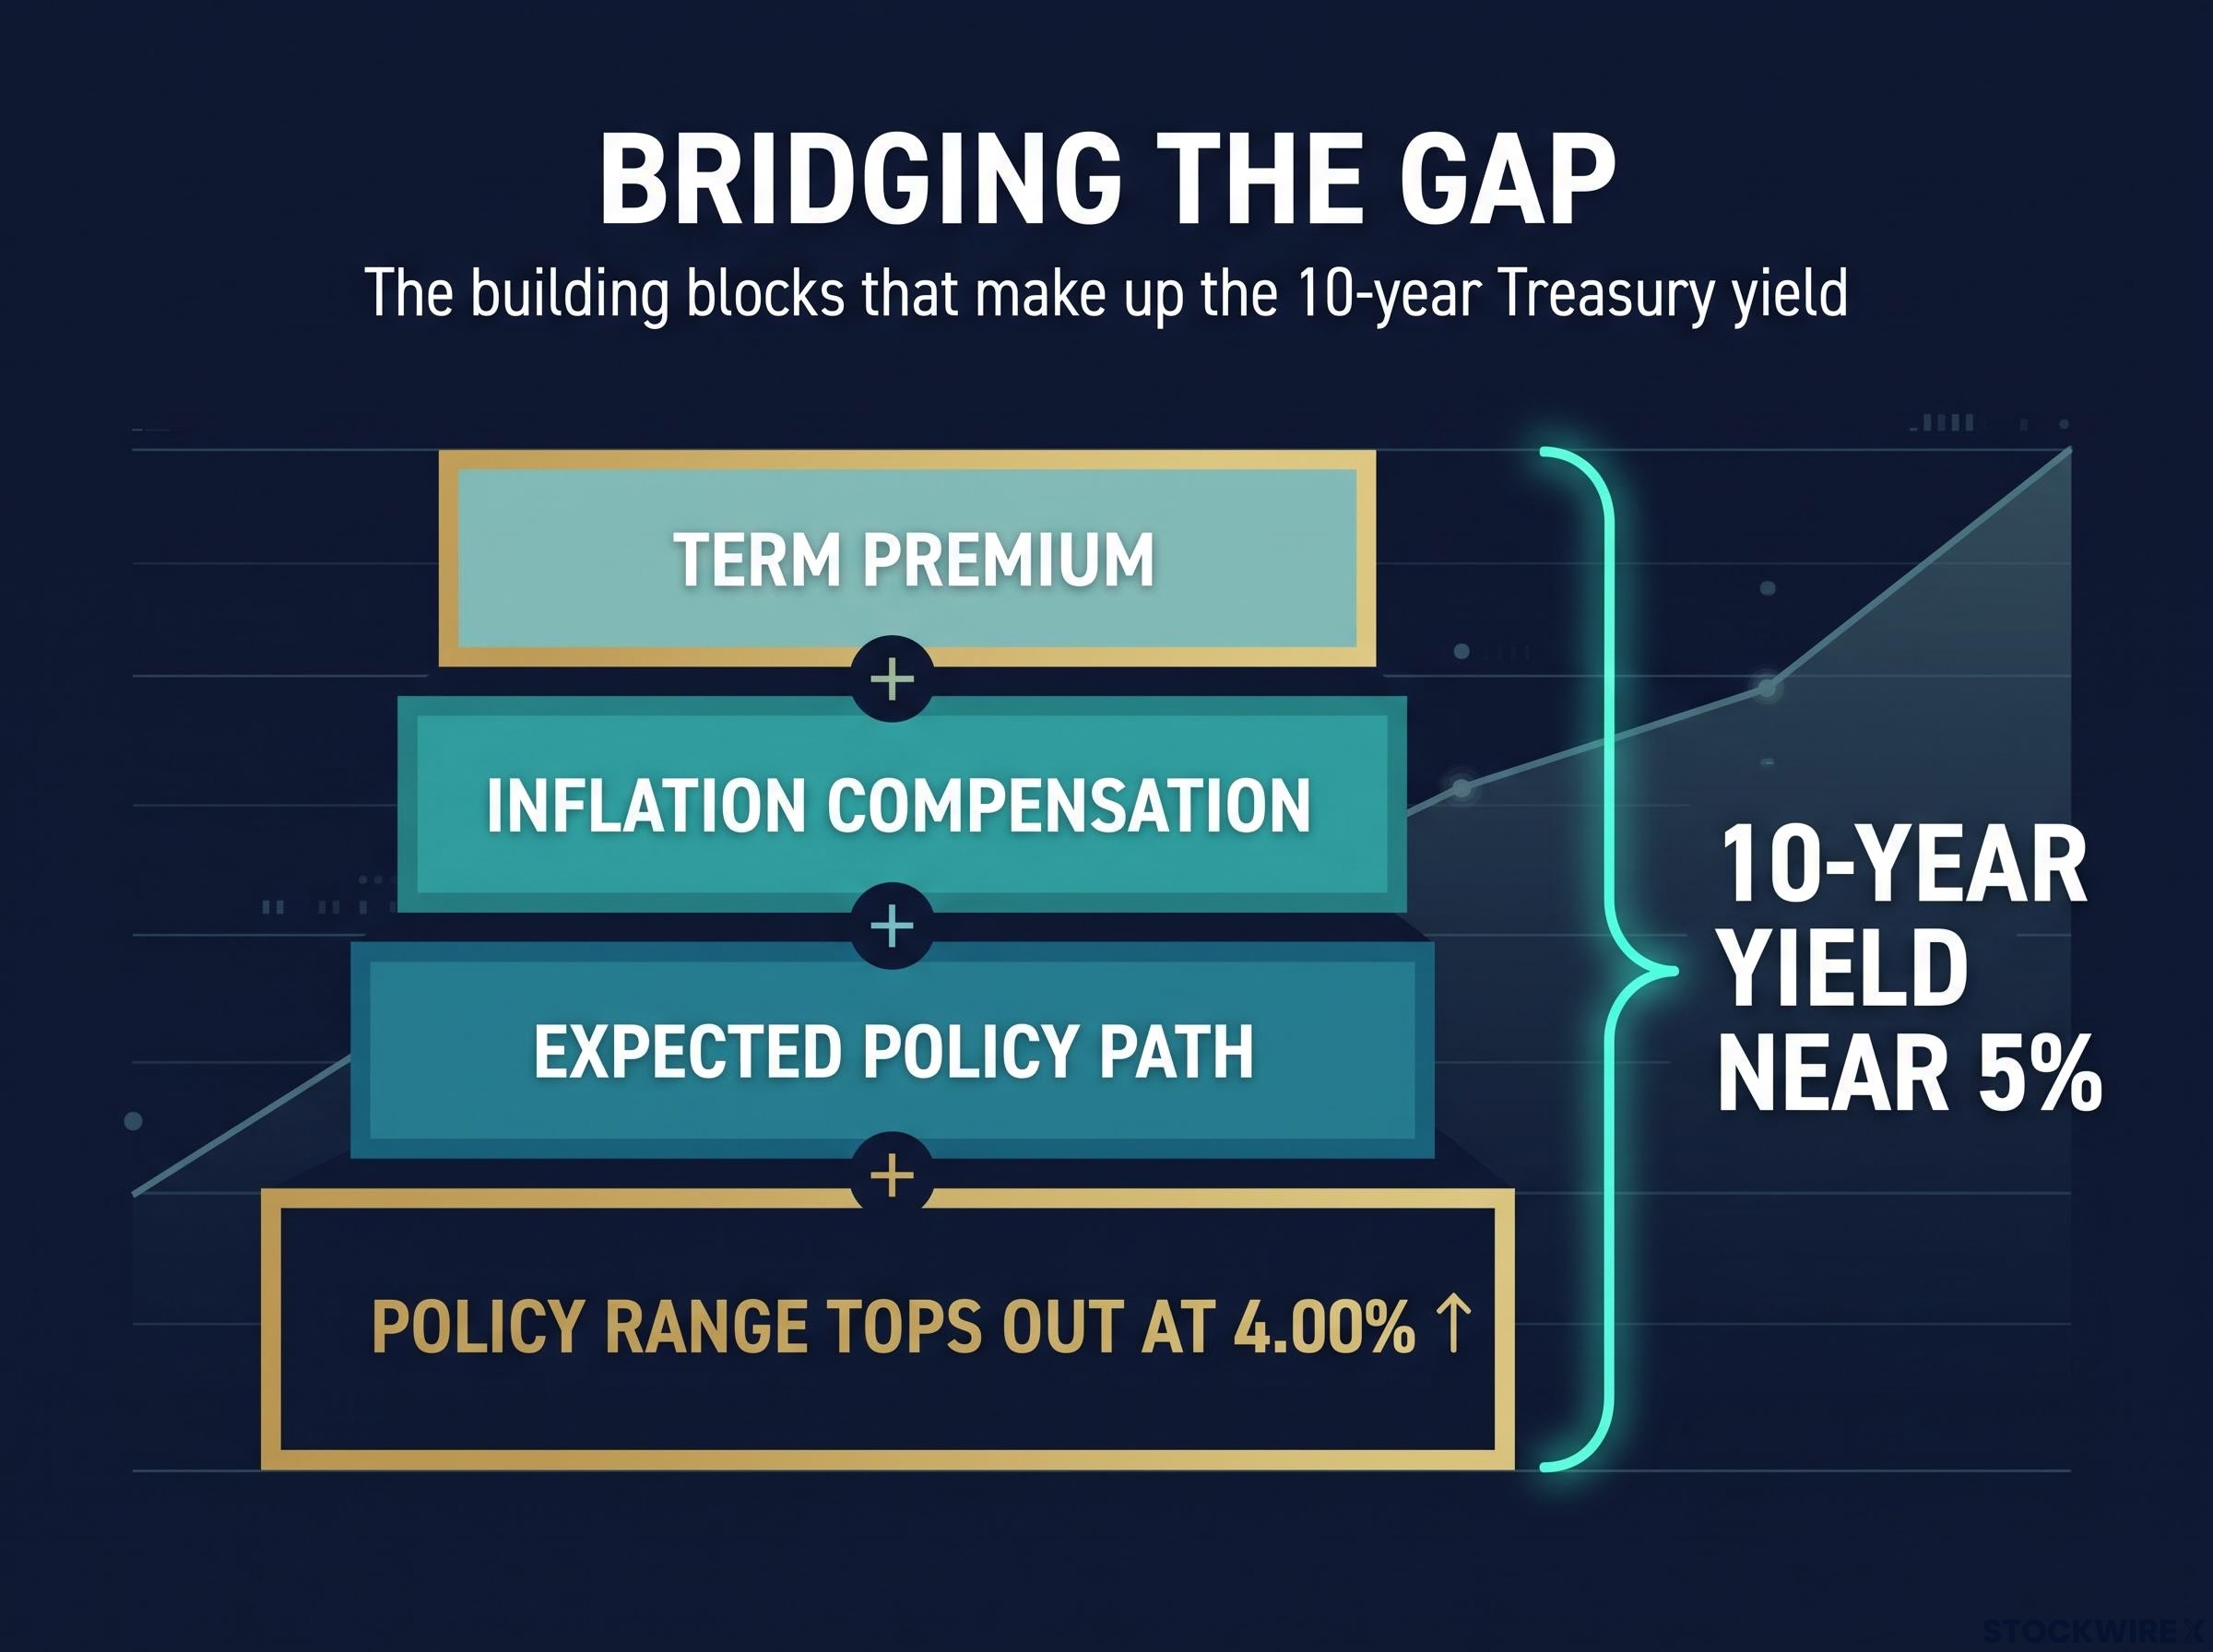
The 10-year yield sits near 5% because markets stack expected policy path, inflation compensation, and term premium on top of the 4.00% policy rate.
- Expected policy path: the average short-term rate investors expect over the decade. Hot CPI and hawkish Fed commentary lifted this.
- Inflation compensation: the extra return lenders want to cover rising prices over the life of the bond.
- Term premium: the additional return investors demand for tying money up for a long period, given uncertainty about inflation, policy and growth.
Fiscal supply adds weight to the third component. Heavy Treasury issuance means private buyers must absorb more duration (sensitivity to rate changes over a long horizon), and they want to be paid for carrying that risk.
So a 5% 10-year does not mean markets expect a 5% policy rate. If you watch only the Fed, you miss part of the pressure on asset prices: bond supply and inflation worries can push yields up even when expectations for the policy rate hold still.
How higher yields reach the dollar
Higher US yields make dollar-denominated assets more attractive to global investors, who need dollars to buy them. That demand tends to strengthen the currency. A stronger dollar is the bridge between bond markets and commodities, which is where the story gets more complicated.
How rate expectations reach gold, copper, aluminium and oil
Gold: the clearest case
Gold shows the rate channel most cleanly. The transmission runs in four steps:
- A higher expected Fed path lifts Treasury yields.
- Higher real yields (yields after inflation) increase the income available from government bonds.
- The dollar typically strengthens.
- Gold, which pays no income and is priced in dollars, loses appeal.
Rick de los Reyes of T. Rowe Price, quoted by Morningstar, linked gold’s pullback to higher rates, saying rising real rates make dollars more valuable relative to gold. The price path fits. Gold fell to US$3,869.85 on 30 October, closed at US$4,065.63 on 6 November, then dropped about 1% to roughly US$3,992 in a later reading. Goldman Sachs cut its end-2026 forecast to US$4,150 from US$4,650, citing a more hawkish Fed.
There is a floor, though. Morningstar reported that investors and central banks kept buying as prices fell, so safe-haven and structural demand are working against rate-driven selling.
Copper, aluminium and oil: when physical tightness wins
The same macro channels should weigh on industrial commodities. A stronger dollar, higher financing costs and weaker demand expectations all point lower. In November, physical shocks overrode them.
| Asset | Rate channel | Physical or geopolitical override | November price reading |
|---|---|---|---|
| Gold | Higher real yields and stronger dollar reduce appeal | Central-bank and safe-haven buying | About US$3,992/oz (later reading) |
| Copper | Stronger dollar and financing costs weigh on demand | Tariff-driven flows into US warehouses, low Chinese stocks | US$13,796/t (11 Nov) |
| Aluminium | Same macro pressure as copper | Extreme spot tightness | About US$3,050/t (11 Nov) |
| Oil | Weaker demand expectations | Hormuz shipping attacks and mines | Brent US$92.76/bbl (11 Nov) |
In copper, the Yangshan import premium hit a record US$230/t, and Shanghai Futures Exchange (SHFE) stocks fell more than 24% in a week to 33,848 t. Aluminium’s spot price was reportedly US$147/t above the three-month contract, the steepest gap since late 1980. Oil drew support from at least 37 ship attacks in October, while hopes of de-escalation capped the rally.
The physical story rests on a widening refined copper deficit, with supply failures at several major mines and collapsing treatment charges confirming that concentrate scarcity is already present in the market.
“Higher rates, lower commodities” is a tendency, not a rule. Before drawing conclusions about any market, ask which force is dominant there: the macro one or the physical one.
Where does the shock land in Australia: housing, the dollar and the RBA?
Rate expectations feel abstract until they show up in loan numbers. In Australia, they already have.
The Australian Bureau of Statistics (ABS) released September quarter lending data yesterday. New dwelling-loan commitments fell 15.0% to 111,878, with value down 15.5% to about $81.2 billion.
A record fall The 15.0% quarterly drop in new home-loan commitments is the largest since the ABS series began in 2002.
Investors pulled back hardest, down 30.6% in number to 35,301. Owner-occupier loans fell 5.3% and first-home-buyer numbers dropped 8.6%. The banking and settlement layers tell the same story.
| Indicator | Source | Latest change |
|---|---|---|
| Total loan commitments | ABS, September quarter | Down 15.0% to 111,878 |
| Investor loans | ABS, September quarter | Down 30.6% quarterly, 38.5% year-on-year |
| Home-loan applications | CBA and Bankwest | Down 16% year-on-year |
| Property settlement volumes | PEXA, 1Q FY27 | Down 11.5% to 934,000 |
Commonwealth Bank of Australia still grew its home-lending book 6.6%, but fewer new borrowers are knocking. PEXA said October transfers ran 26% below the prior corresponding period and cut its FY27 revenue guidance to $355-380 million from $385-415 million. For you, housing finance works as an early-warning gauge of how much tightening an economy can absorb.
Bank forecasts for housing credit growth have already been trimmed, with NAB pencilling in just 2.5% for FY27 and CBA cutting its own guidance, so mortgage application weakness is feeding straight into lender earnings models.
The RBA’s dilemma
Weak housing argues for restraint. The RBA’s November assessment acknowledged that housing prices had declined more than expected.
The same assessment said inflation, along with higher fuel and commodity costs from the Middle East conflict, warranted tightening. Its financial-conditions discussion cited an 85% market-implied probability of a November hike. A weaker Australian dollar, around 68.5 US cents, adds imported inflation risk.
That is a stagflation-style bind, where slowing activity and rising prices pull policy in opposite directions. If you hold a mortgage or AUD exposure, recognise that the RBA’s next move is a genuine trade-off, not a one-way call.
What to watch before the December FOMC, and where the pricing could be wrong
The November CPI report is not due before the 8-9 December meeting. That shifts weight onto other signals. In rough priority order:
- Core services and shelter inflation: the stickiest parts of inflation, and the gauges most likely to move December odds.
- Payrolls, unemployment and wages: strong labour data supports the hawkish path and higher yields.
- Dollar, credit spreads and the 10-year real yield: these show whether financial conditions are tightening on their own.
- Treasury auction demand and term premium: weak auctions can lift long yields regardless of the Fed.
- Gold ETF flows and central-bank buying: these reveal whether the floor under gold is holding.
- Copper inventories, tariffs, SHFE stocks and the Yangshan premium: these tell you whether the physical squeeze persists.
- Hormuz incidents and tanker insurance: the main override in oil.
- Australian housing credit, arrears and auction activity: further weakness could make the RBA less willing to follow market pricing.
The current pricing is also contested. Reported views include:
- Goldman’s David Mericle reportedly argued most FOMC voters would hesitate to deliver 50 bp, expecting a quarter-point move rather than a jumbo hike
- ING said 50 bp could be too aggressive and does not necessarily forecast further 2027 hikes
- Gold may resist higher real yields because of safe-haven and central-bank demand
These views are speculative and subject to change as data arrives. The useful habit is to track which indicators would force a repricing, rather than anchoring on today’s three-hike figure.
Reading the next repricing: what the November episode teaches
November gave you a full worked example. A hot CPI print lifted the expected Fed path to about three hikes by mid-2027. The 10-year yield pushed toward 5%, the dollar firmed and gold fell below US$4,000.
Copper, aluminium and oil broke from the script because physical shortages and shipping risk outweighed the rate channel. In Australia, loan commitments fell 15.0%, showing housing finance as the first place tighter conditions bite.
The 8-9 December FOMC is the next decision point for that whole chain.
Asset prices respond to rate expectations combined with local physical and credit conditions, so one signal alone is never the full picture. When the next repricing arrives, trace it through yields, the dollar, physical markets and local credit before deciding what it means for you.
This article is for informational purposes only and should not be considered financial advice. Investors should conduct their own research and consult with financial professionals before making investment decisions.