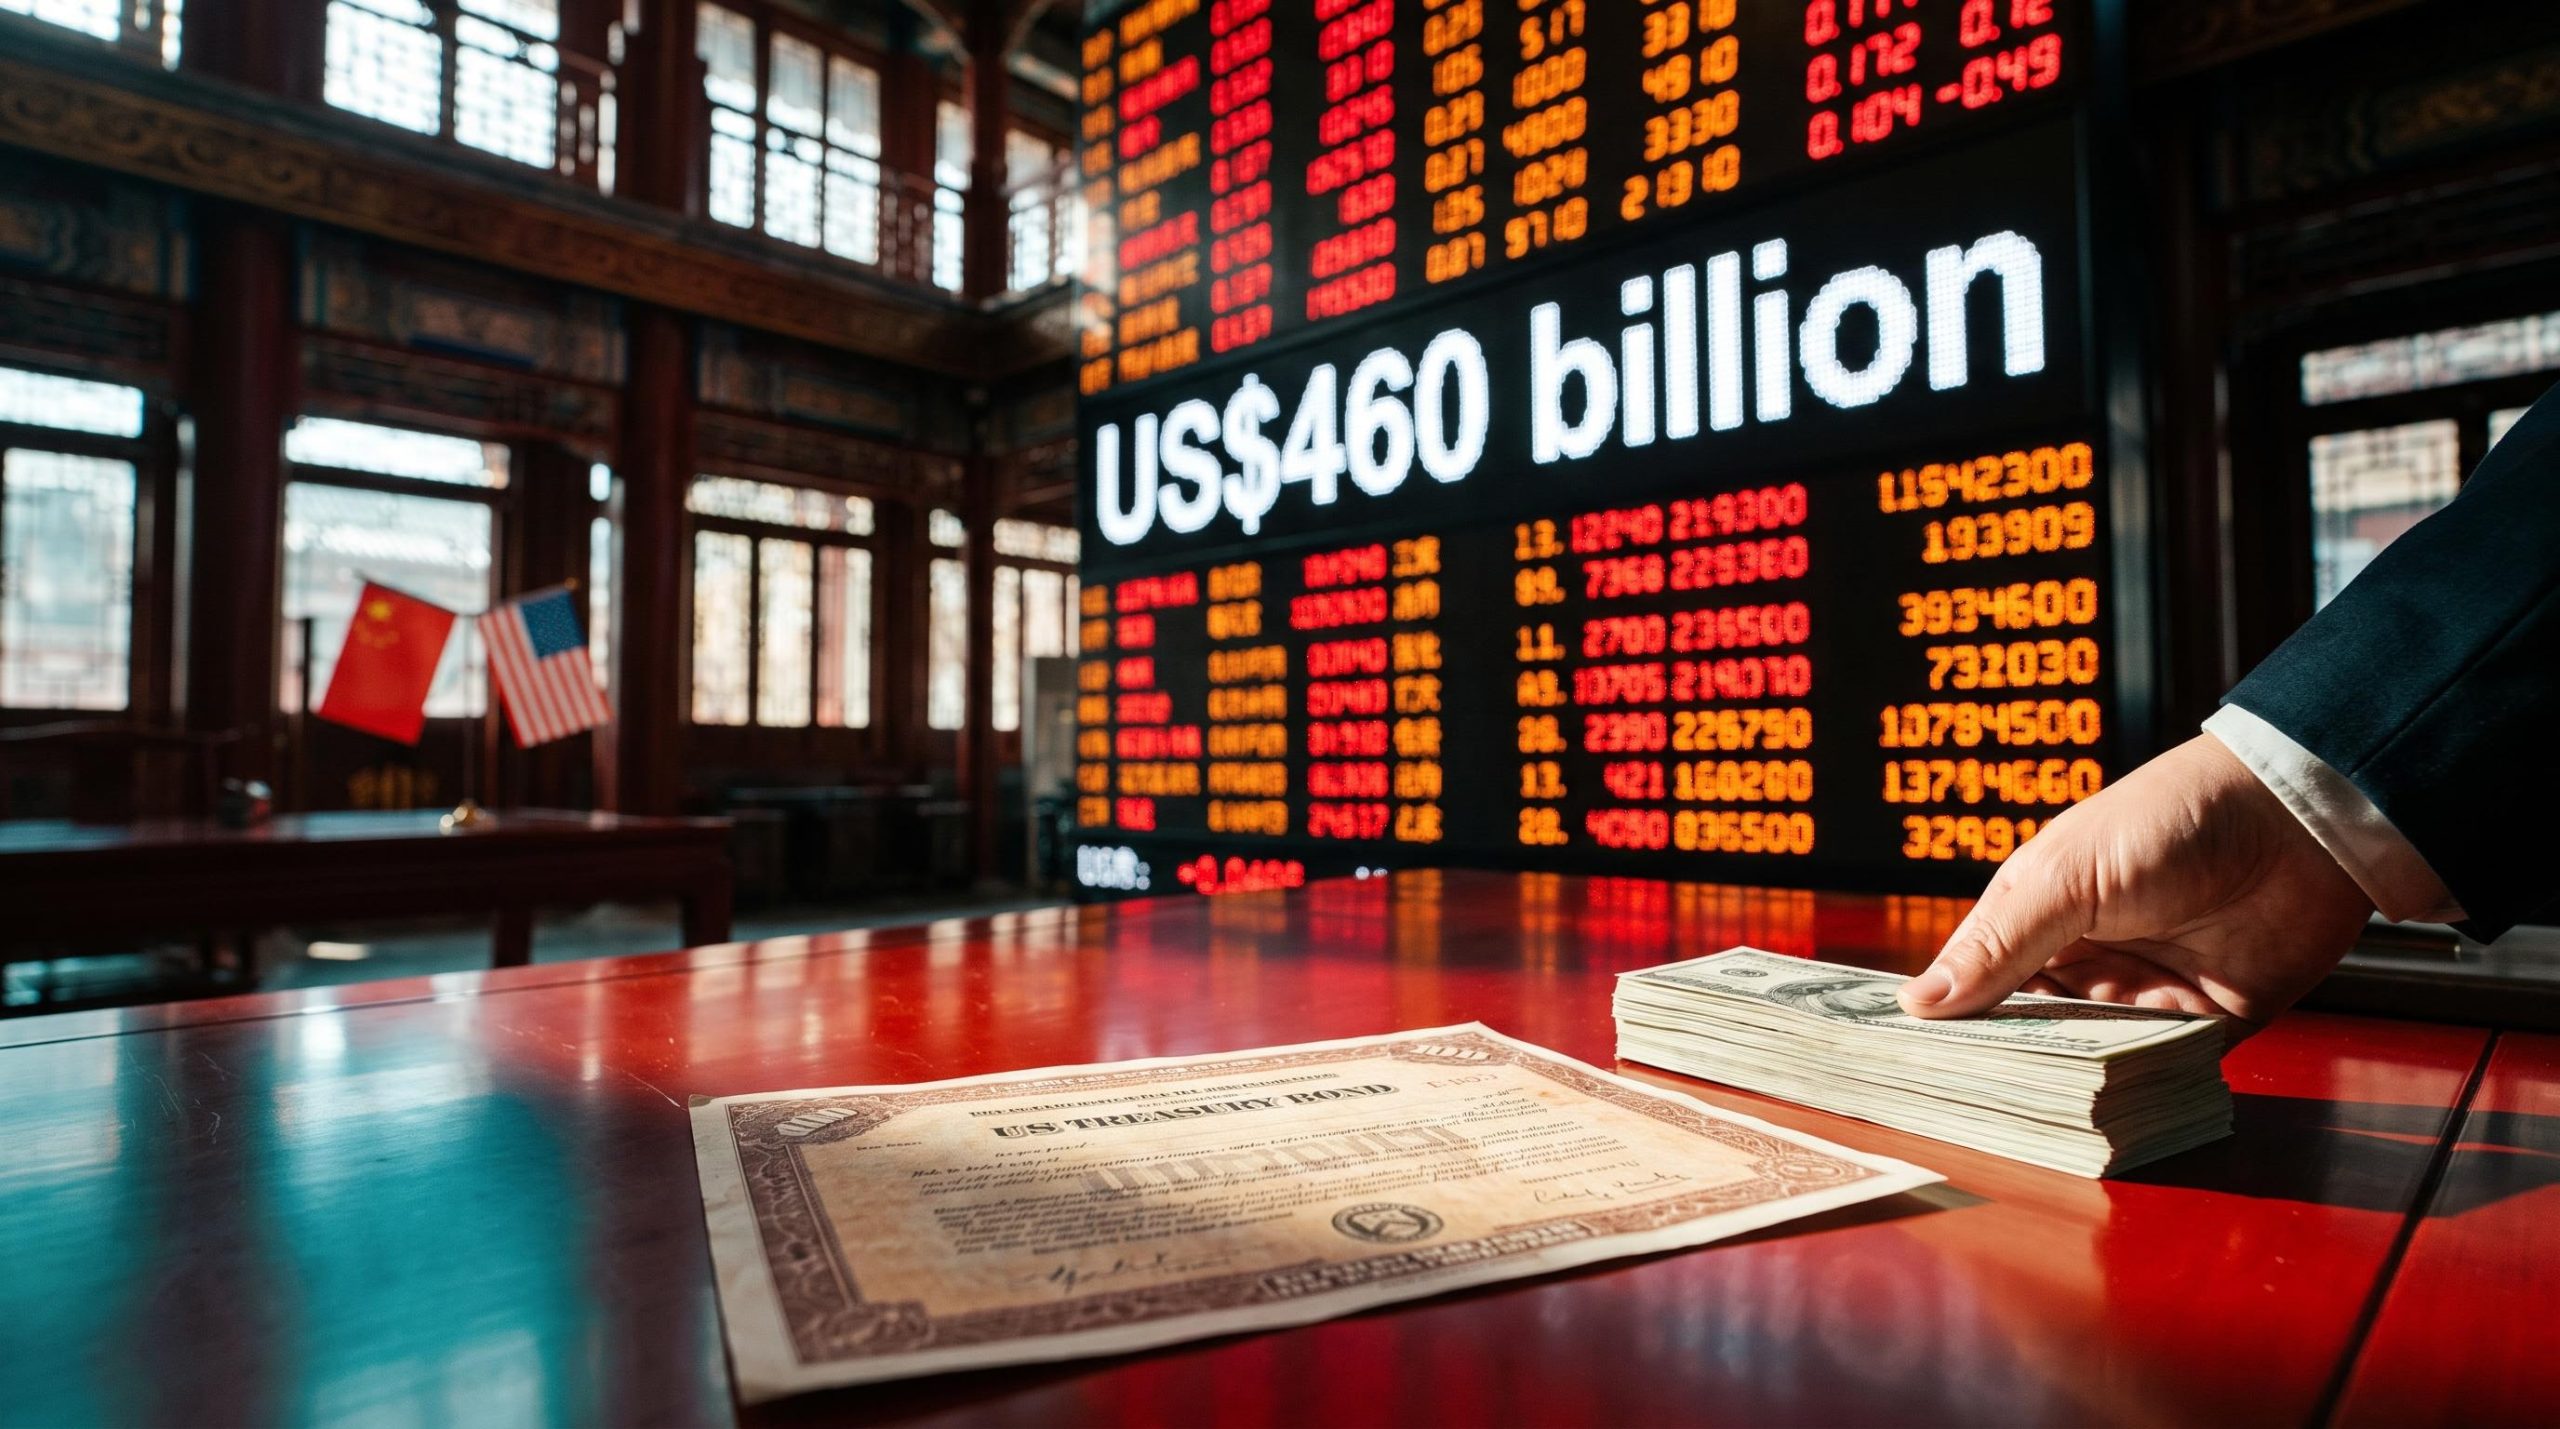
China has cut its US Treasury holdings by roughly US$460 billion since 2015, yet the value of its US equity holdings climbed 67.3% over the same stretch. That apparent contradiction sits at the centre of a new DBS Group Research report by FX and credit strategist Chang Wei Liang, covered by FXStreet today, which concludes that China’s retreat from US assets is real, state-led and country-specific.
The question matters beyond Beijing. If the world’s second-largest economy is stepping back from dollar assets, the knock-on effects could reach Treasury demand, currency markets and the risk sitting in your own portfolio.
The answer depends on reading the US Treasury International Capital (TIC) data correctly, and on whether China’s moves are being copied elsewhere. Here is how the numbers fit together, and what the evidence says about a China shift versus a global one.
Why China’s US asset numbers point in two directions at once
Start with the figures DBS drew from US TIC data covering roughly the past decade.
| Measure | Reported figure | What it captures |
|---|---|---|
| Net bond outflows | US$525.6 billion | Bonds sold minus bonds bought |
| Net equity outflows | US$271.2 billion | Shares sold minus shares bought |
| Change in Treasury holdings | Down US$459.9 billion | Fall in market value of Treasuries held |
| Change in equity holdings | Up 67.3% (US$214.9B to US$359.5B) | Rise in market value of shares held |
China sold far more US shares than it bought, yet its US share portfolio grew. Both statements are true.
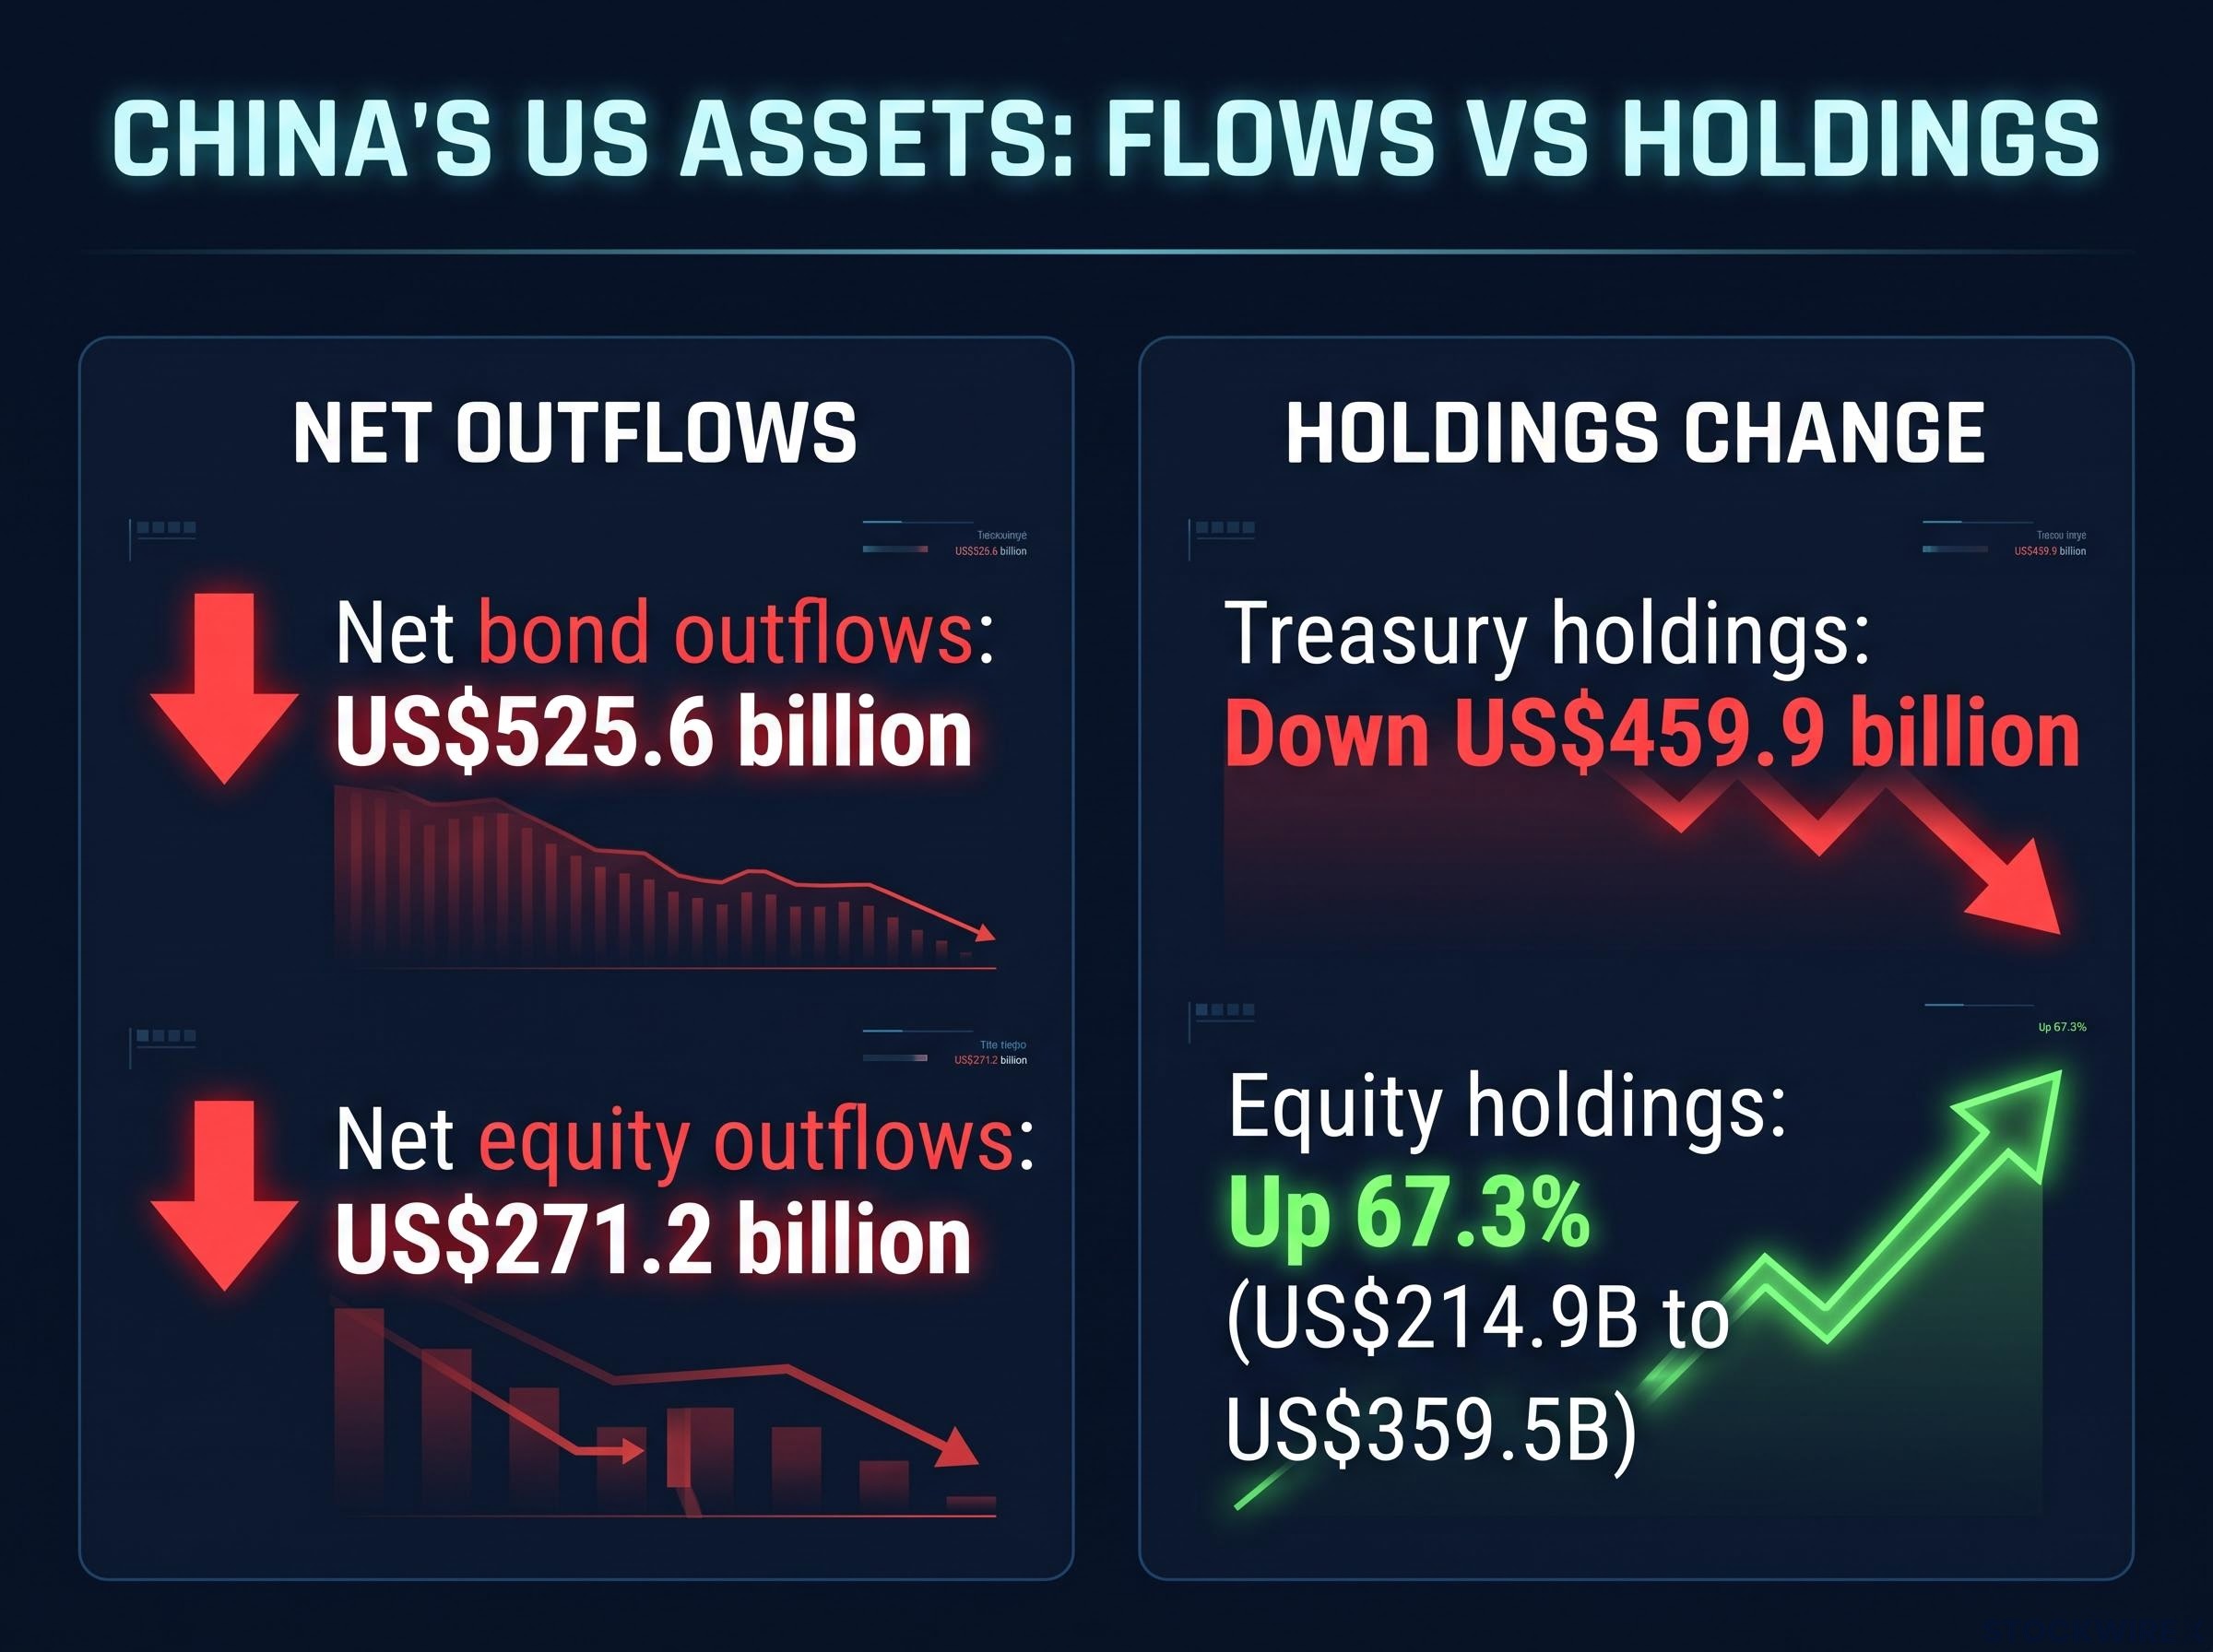
While China had net equity outflows of US$271.2 billion, its equity holdings were up 67.3% (US$214.9B to US$359.5B).
Flows versus holdings
TIC flows record transactions during a period: what was bought and sold. TIC holdings measure the market value of securities owned at a single point in time. The two rarely move together, and holdings can rise even while net selling continues because:
- share prices rise, lifting the value of what remains;
- bond yields fall, which pushes bond prices up;
- exchange-rate moves change the dollar value of some assets;
- maturing securities are replaced with different ones.
A decade of US equity gains did the rest. Context helps too: China’s Treasury holdings peaked above US$1.3 trillion in 2013, and Japan overtook it as the top holder in 2019. A Treasury survey as of 30 June 2025 put China’s total US securities at about US$1.279 trillion, including roughly US$344 billion of equities and US$670 billion of long-term debt.
For you, the lesson is simple: a holdings figure alone tells you little about whether a country is buying or selling. Check net flows first, which is exactly why DBS built its conclusion on them.
For readers wondering why equity holdings matter, our deep-dive into foreign ownership of US stocks shows how equities now make up 55% of foreign portfolios and amplify any reversal.
Is this a China story or a dollar story?
What the global data shows
If China’s selling reflected a worldwide exit from the dollar, global reserve data should show it. It does not. International Monetary Fund (IMF) figures put the dollar’s share of reported reserves at 56.77% in Q4 2025, barely changed from 56.93% in Q3. The renminbi held just 1.95%, while total allocated reserves sat near US$13.0 trillion in Q3 2025.
The gap between China’s reduction and a steady global picture points to a single large holder adjusting its mix.
Part of the long reserve share decline since 2000 reflects exchange-rate valuation effects rather than active selling, which helps explain why a single holder’s reallocation barely registers in the global aggregate.
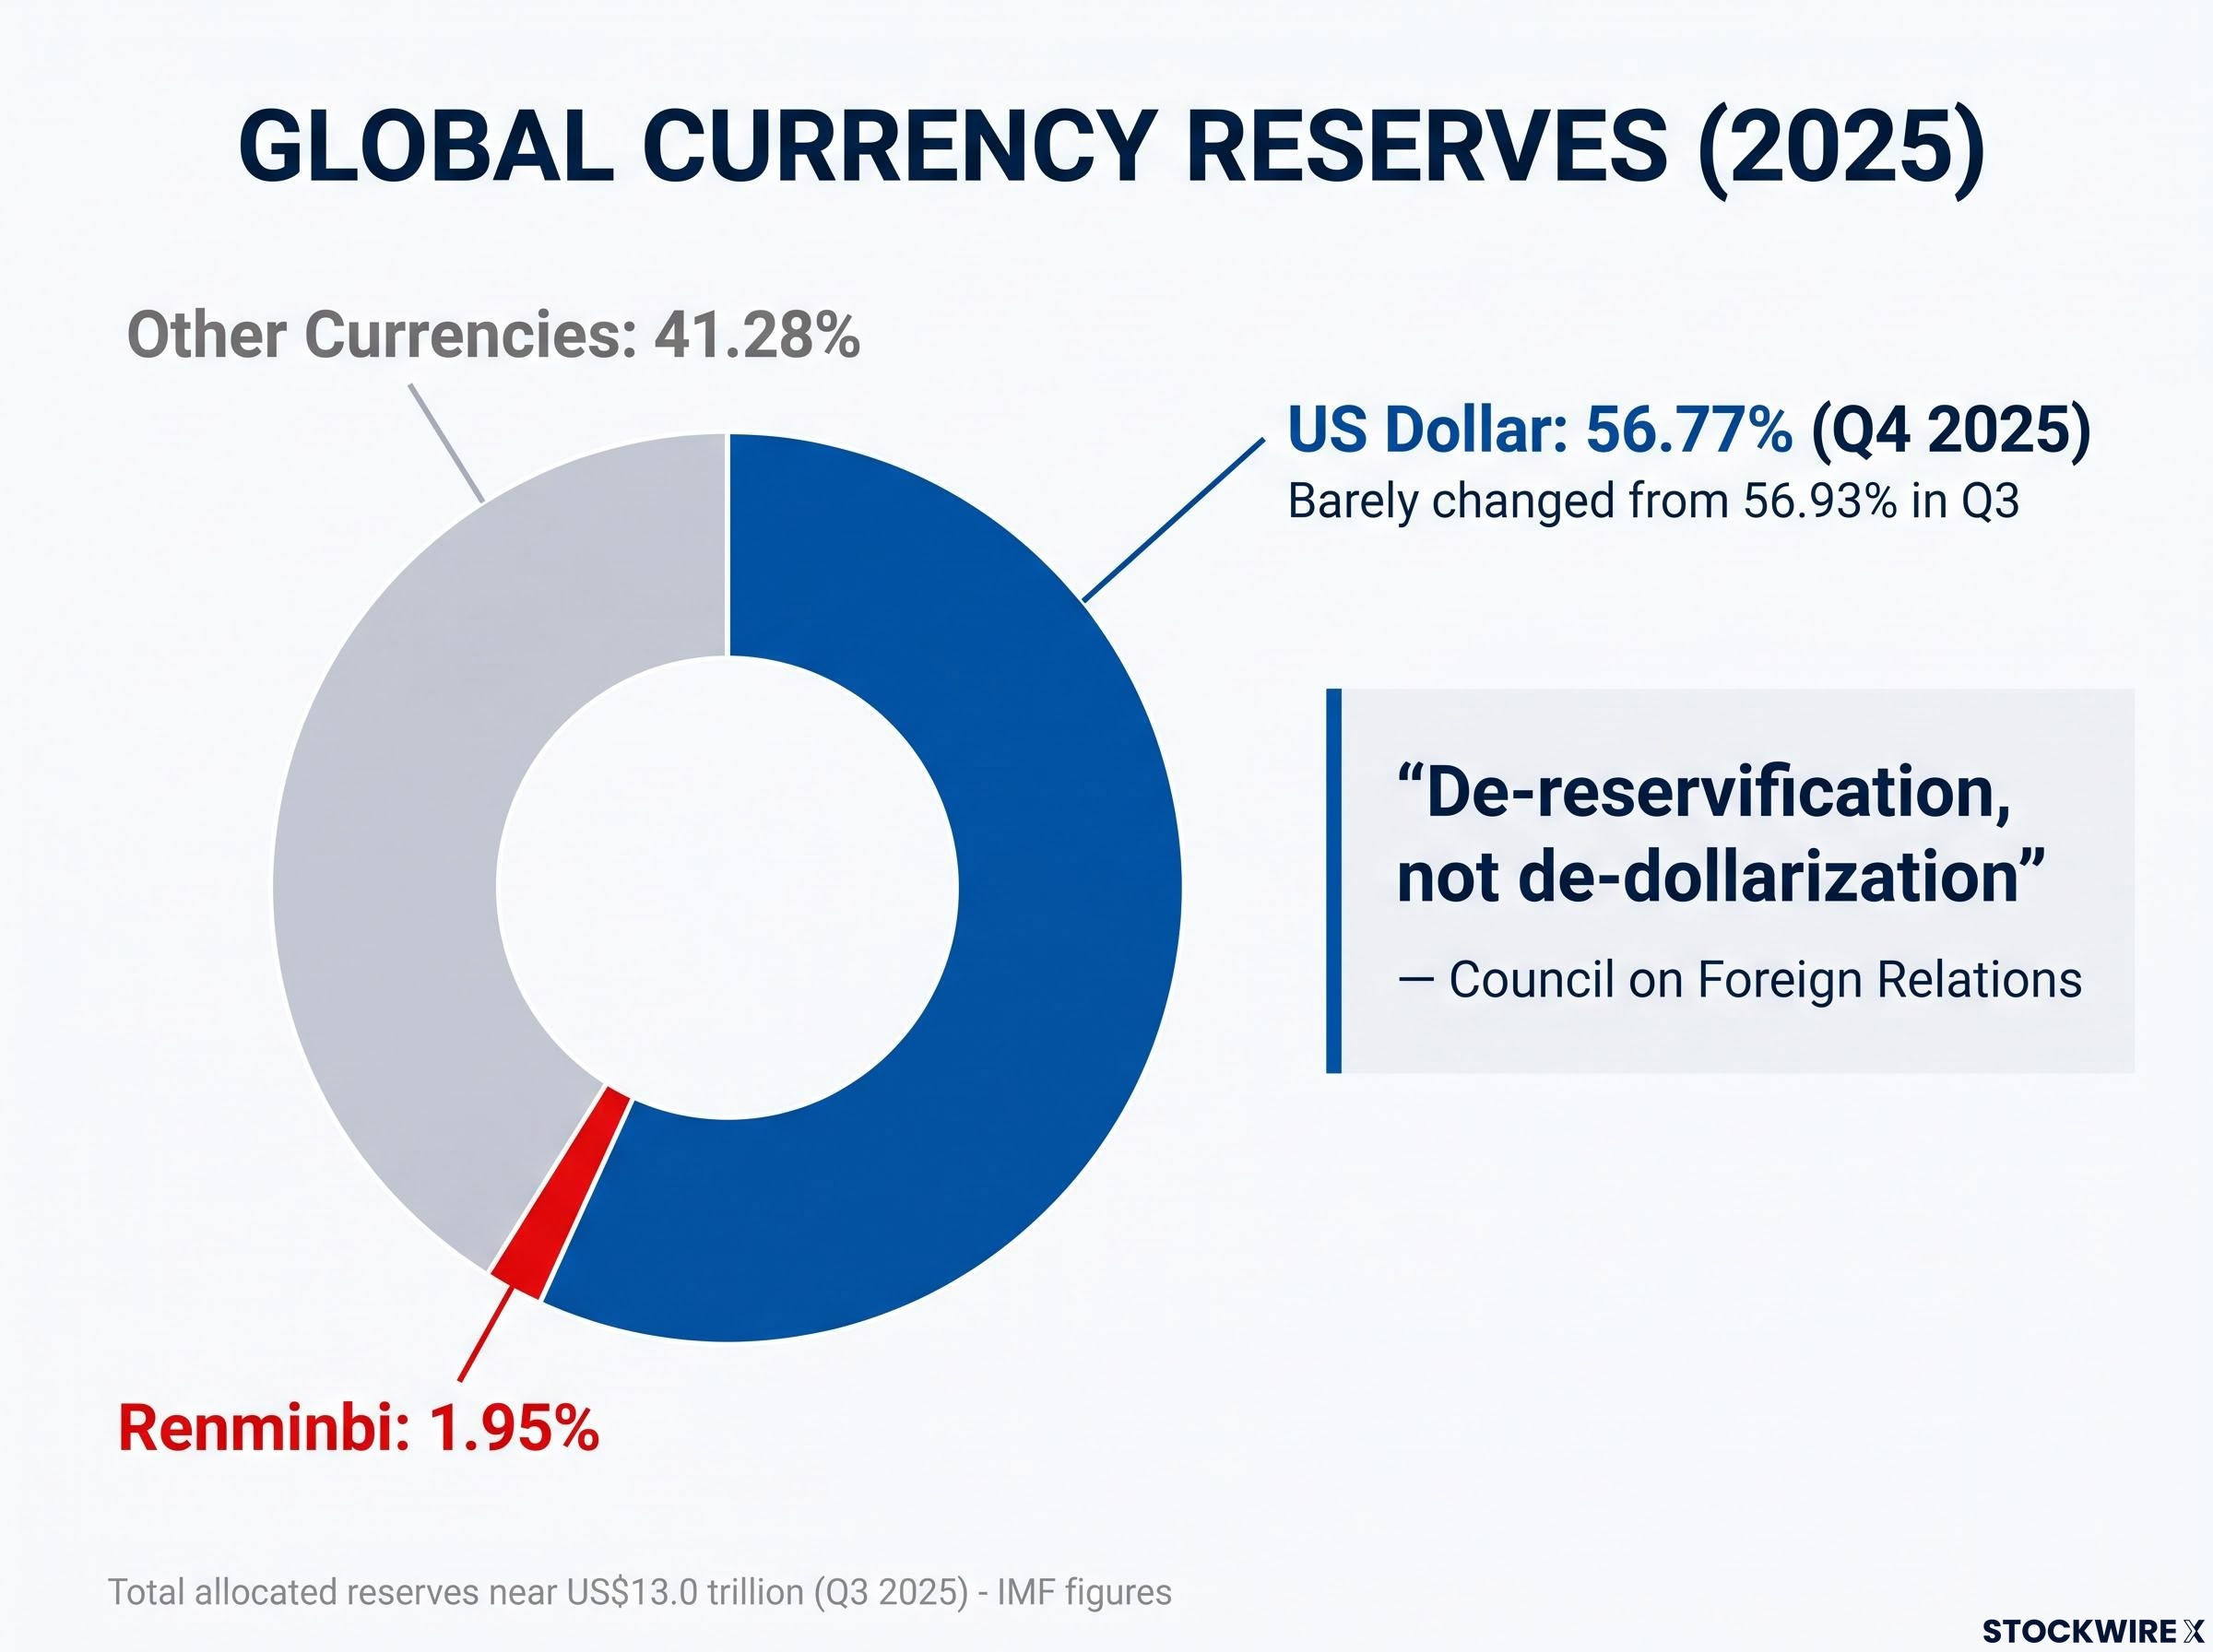
The US Dollar maintained a 56.77% share in Q4 2025, barely changed from 56.93% in Q3, while the Renminbi sat at 1.95%.
“De-reservification, not de-dollarization” The Council on Foreign Relations’ description of reserve managers trimming conventional currency assets or adding gold without dropping the dollar’s central role.
What is driving China
DBS and other observers link the shift to three forces:
- Sanctions risk. Reuters reported in September 2025 that Western sanctions froze about US$300 billion of Russia’s reserves after the 2022 invasion of Ukraine.
- Geopolitical tension. DBS frames China’s reduction as a portfolio response to rising strain with Washington.
- Gold. Reuters reported that China’s central bank has bought gold heavily since 2023.
State-sector investors led the net outflows, according to DBS. Even so, China is diversifying rather than rejecting the dollar. JPMorgan found the renminbi’s share of Chinese goods trade settlement rose to about 28% in 2025 from about 12% in 2018, but concluded no scalable alternative to the dollar exists.
What this tells you is that dollar assets are not being abandoned at scale. The diversification is concentrated in one very large holder, so global dollar exposure should not be assumed to be unwinding.
Reading the data with care, and what it means for capital flows
There is a catch: the mainland-China TIC line may understate what Chinese investors actually own. A Federal Reserve note from February 2026 calls this “custodial bias”, where securities held through third-country custodians get recorded under that country. The Council on Foreign Relations found in May 2026 that Treasuries held via European custodial centres have grown sharply since about 2020.
Bloomberg reporting in October raised the possibility that Beijing is moving bonds to custodians outside America, with Canada’s rapidly growing agency holdings drawing particular attention, though neither government has confirmed any link.
The data therefore cannot show:
- Chinese-owned securities booked in Belgium, Luxembourg, the UK, the Cayman Islands or Canada;
- exact ownership, which Treasury itself says custodian reports cannot fully pin down;
- every dollar asset held offshore, since direct investment sits outside TIC.
Gold also flatters the diversification story. The IMF said gold passed Treasuries in official reserves in 2025 largely because of rising prices, not mass selling of dollar assets.
Meanwhile, overall foreign appetite has held up. The latest TIC release, published on 16 October 2026, showed foreign net purchases of long-term US securities of US$279.2 billion in August, including US$90.9 billion of Treasury bonds and notes. The US market is deep enough to absorb official selling, and China still needs dollar liquidity for trade and funding. A slow reallocation could still nudge demand towards gold, euro and yuan assets, and non-US equities.
What to watch:
- the next TIC release, covering September data, due 18 November 2026;
- Treasury holdings recorded under European custodial centres;
- central bank gold reserve disclosures.
The takeaway: China’s Treasury demand is becoming less visible and probably gradually lower at the margin. Treat it as a slow-moving factor for the dollar, not a near-term trigger.
What this slow shift does and does not change for the dollar
The DBS finding describes a China-specific diversification, shaped by sanctions risk, that is gradual, selective and partly hidden by custodial routing. It does not describe a dollar in retreat; the currency still holds more than 56% of global reserves.
The scale of US dollar dominance is clearer in trading than in reserves: the currency sits on one side of roughly 89% of global FX trades, which is why modest central bank diversification has barely dented its operational grip.
Two developments would change that reading. The first is evidence of similar reductions among other large reserve holders. The second is custodial-centre data confirming that Treasuries are genuinely leaving Chinese hands rather than simply moving addresses.
Until either appears, the sensible call is to treat China’s moves as a long-run drag on marginal Treasury demand, not a reason to reprice your dollar exposure overnight.
This article is for informational purposes only and should not be considered financial advice. Investors should conduct their own research and consult with financial professionals before making investment decisions.