
A trading screen shows Advanced Micro Devices (AMD) options carrying 78% implied volatility. It is easy to read that as a warning that the stock could swing 78% before your November contract expires. Over the 17 days left on that option, though, the expected move works out to roughly 16.8%, about a fifth of the headline figure.
The gap comes from a timing mismatch. Platforms quote volatility as an annual number, but you probably hold positions for days or weeks. Until you translate that annual figure to your own window, it cannot tell you where to set a strike or how large a position should be.
The translation runs on the square root of time, and it takes about thirty seconds once you know the steps. Here is how options volatility converts to any horizon, why the square-root maths holds together, and how to turn the result into a price range you can use when choosing strikes.
Why do trading platforms quote volatility as an annual number?
Seeing 78% next to an option that expires in under three weeks feels wrong. The number looks like a forecast for your trade, and an alarming one. It is neither.
Annualised volatility is a shared yardstick. CME Group describes options volatility as an annualised number, where a one-year, one-standard-deviation move equals the stock price multiplied by volatility (S × σ). A standard deviation is a measure of how widely results spread around their average.
The core idea Quoted volatility describes a one-standard-deviation move over one full year. It says nothing directly about your holding period until you convert it.
The convention runs across the industry. Cboe describes the VIX, its widely watched volatility index, as the expected annualised standard deviation of the S&P 500. Charles Schwab describes implied volatility (IV), the market’s estimate of future price swings drawn from option prices, as an annualised percentage produced by an options-pricing model, usually Black-Scholes-Merton.
Because implied volatility is backed out of live option prices rather than historical data, it reflects what the market collectively expects, and it carries no directional signal. You can read a 78% figure as a measure of expected movement size only, never as a call on whether AMD rises or falls.
Consider what would happen without annualisation. A 30-day option would show a small number and a one-year option a large one, purely because of time. You could not tell whether volatility was genuinely high or low. Annualising puts everything on the same footing, so you can compare:
- Different stocks against each other
- A 30-day, three-month and one-year option on the same stock
- Implied volatility against historical volatility
- Strategies and assets across markets
The pricing model quietly converts the annual figure back to each option’s remaining life. You need to do the same. A high annual reading does not mean you should expect that move during your trade; it means one more calculation stands between you and a usable number.
When big ASX news breaks, our subscribers know first
How do you convert annual volatility to your trade horizon?
The conversion takes three steps:
- Divide days to expiration by 365. This gives the fraction of a year your trade covers.
- Take the square root of that fraction.
- Multiply the result by the annual volatility.
Run it on AMD. With 17 days to expiration, 17 divided by 365 is about 0.0466. The square root of that is roughly 0.2158. Multiply by 78% and you get about 16.83%.
That is your one-standard-deviation move for the life of the option. To turn it into dollars, use the expected move formula: stock price × IV × √(days / 365).
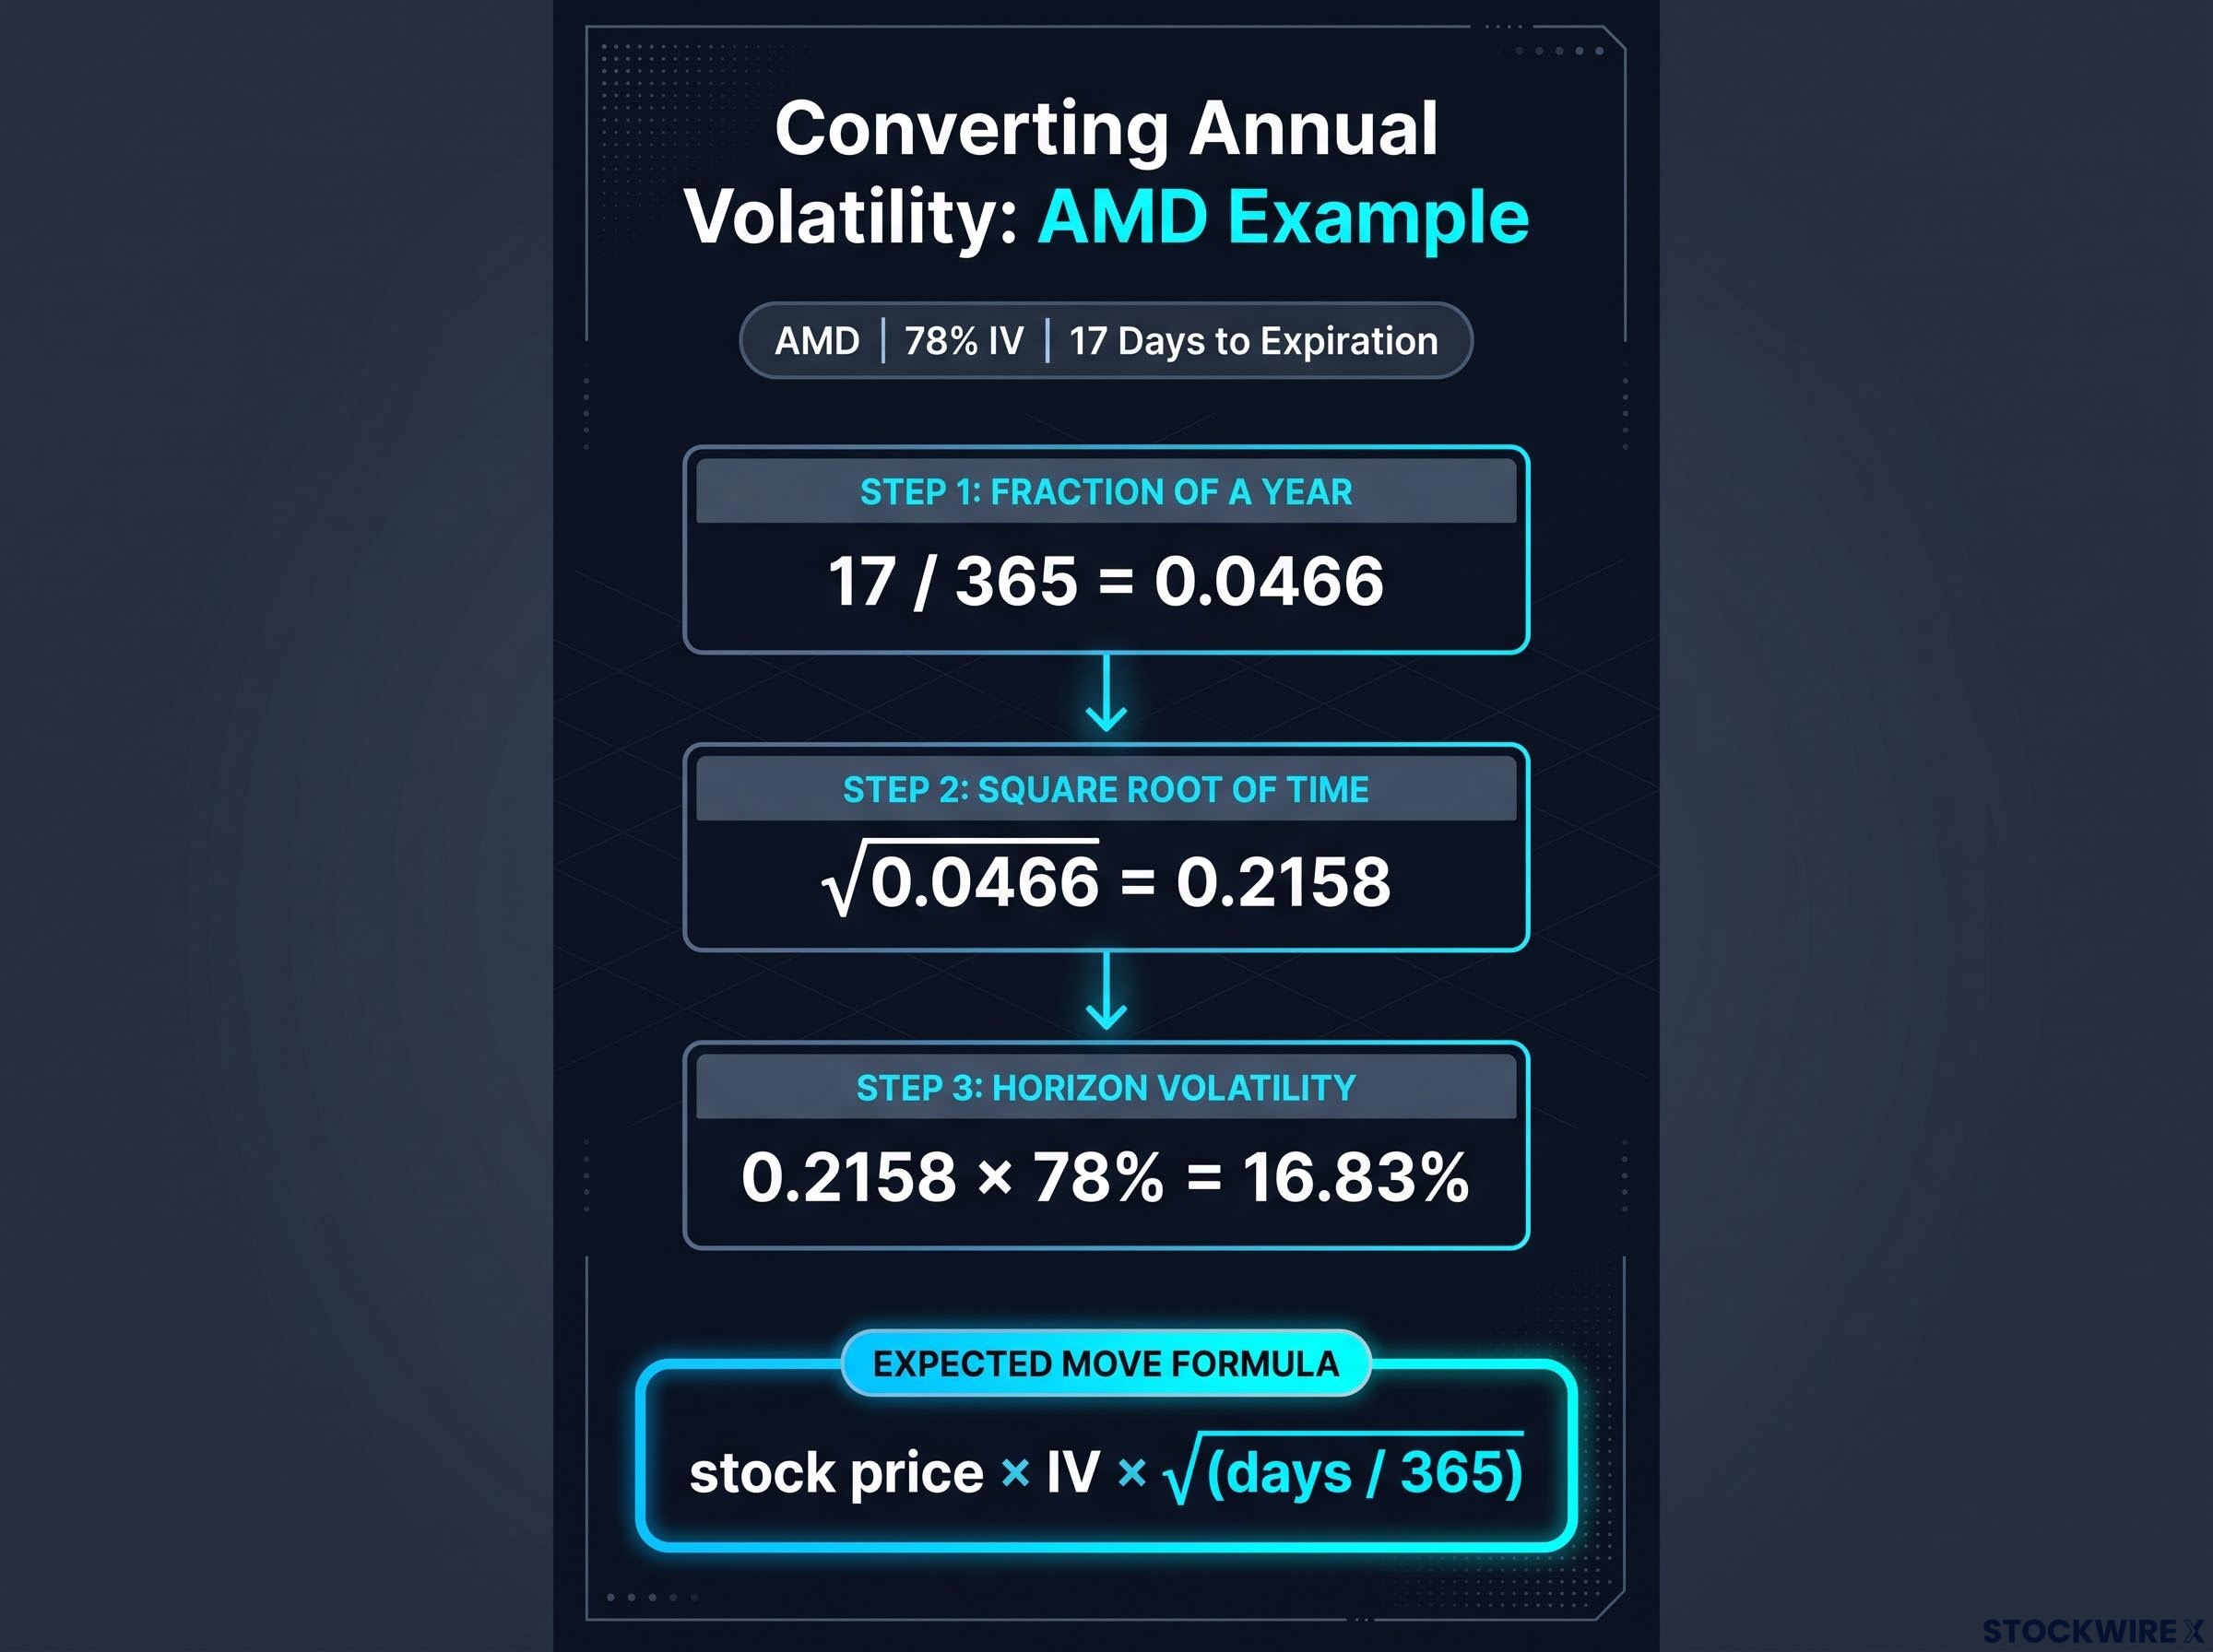
Using the square root of time, AMD’s 78% annual implied volatility converts to a 16.83% expected move over the remaining 17 days.
Options Matrix Pro offers a practitioner example: a $100 stock with 60% IV and 7 calendar days remaining gives an expected move of about $8.31. That puts the one-standard-deviation range at roughly $91.69 to $108.31. You can draw those two lines on a price chart today, and suddenly an abstract percentage becomes a concrete band for your strikes.
Handling daily, weekly and quarterly horizons
Swap the day count and the same method covers any window. The table below holds AMD’s 78% reading constant and changes only the horizon, including the 3 and 38 day windows used in the original worked example.
| Horizon | Fraction of year | Square root | Resulting move |
|---|---|---|---|
| 1 day | 1/365 | 0.0523 | 4.08% |
| 3 days | 3/365 | 0.0907 | 7.07% |
| 1 week | 7/365 | 0.1385 | 10.80% |
| 17 days | 17/365 | 0.2158 | 16.83% |
| 1 month (30 days) | 30/365 | 0.2867 | 22.36% |
| 38 days | 38/365 | 0.3227 | 25.17% |
| 1 quarter (91 days) | 91/365 | 0.4993 | 38.95% |
The logic is identical whether you hold for one day or one quarter. Remember, too, that IV is a point-in-time reading. Unusual Whales reported AMD IV of 79.9% on 7 November 2026, while Market Rebellion and OptionCharts each put 30-day IV at 70% and 74.0% on 6 November 2026. Different dates, expiries and measures produce different figures, so the readings are not contradictory. Always use the number tied to the option you are actually trading.
Why does volatility scale with the square root of time?
The square root can look like a trick to memorise. It is closer to the only answer the maths allows, and following the chain shows why:
- Work in percentage returns. Option models use percentage (log) returns rather than dollar changes, so a $20 stock and a $500 stock can be compared.
- Averaging fails. A move of +1% followed by -1% averages to zero, even for a jumpy stock.
- Square the returns. Squaring removes the minus signs: both become 1.
- Average the squares. That average is the variance, a measure of how much a price moves regardless of direction.
- Scale variance with time. Variance grows in proportion to time, so a variance of 4 over 10 days becomes 0.4 per day.
- Take the square root. Traders think in standard deviation, the square root of variance. A variance of 4 becomes a standard deviation of 2.
In compact form: across n independent periods, variance is nσ², so standard deviation is σ√n.
The rule in one line Variance scales with time; volatility scales with the square root of time.
That distinction has a practical payoff. Doubling your holding period lifts your expected move by about 41%, not 100%, because √2 is roughly 1.41. Time adds to variance, not to volatility itself. Columbia University lecture material describes the same pattern: under constant volatility, volatility grows with the square root of elapsed time.
The result depends on assumptions you should know by name. Returns in each period must be independent, their variance must be similar from one period to the next, and there must be no major jumps.
The 365 versus 252 question
You will see two clocks. 365 counts calendar days and suits option expirations, because time value decays over weekends and holidays too. 252 counts trading sessions and suits realised daily returns. The Options Industry Council’s “rule of 16” divides annual IV by √252, which is 15.87, rounded to 16.
The choice matters at short horizons. AMD’s 78% over 17 days gives 16.83% on the 365 clock and 20.26% on the 252 clock, about 3.43 points apart. That comparison is only fair if the 17 days mean 17 trading sessions in the 252 version.
The rule: use the convention that matches how the quoted volatility was built, and keep the clock consistent. For an option expiring in 17 calendar days, that means √(17/365).
How can you use the expected move to choose strikes and size trades?
The clean range is where the useful part of the work begins. Under a normal distribution, about 68.27% of outcomes land inside one standard deviation, leaving roughly 15.87% in each tail.
Picking strikes around the range
Traders selling credit spreads or iron condors (structures that collect premium and profit if the stock stays within a band) often place short strikes outside the range. One practitioner view, from The Option Premium, targets roughly 0.15 to 0.30 delta strikes beyond the one-standard-deviation boundary.
Delta measures how much an option’s price changes for a $1 move in the stock. Many traders treat it as the probability of expiring in the money, so a 20-delta option is read as about a 20% chance. That reading is an approximation rather than an exact probability, but it gives you a useful cross-check against your square-root estimate.
Earnings show the framing in action. CNBC reported on 3 November 2026 that AMD options implied about a 9% move through the report, against an average move of 8.4% over the last 10 earnings releases. Your view on that gap shapes the structure.
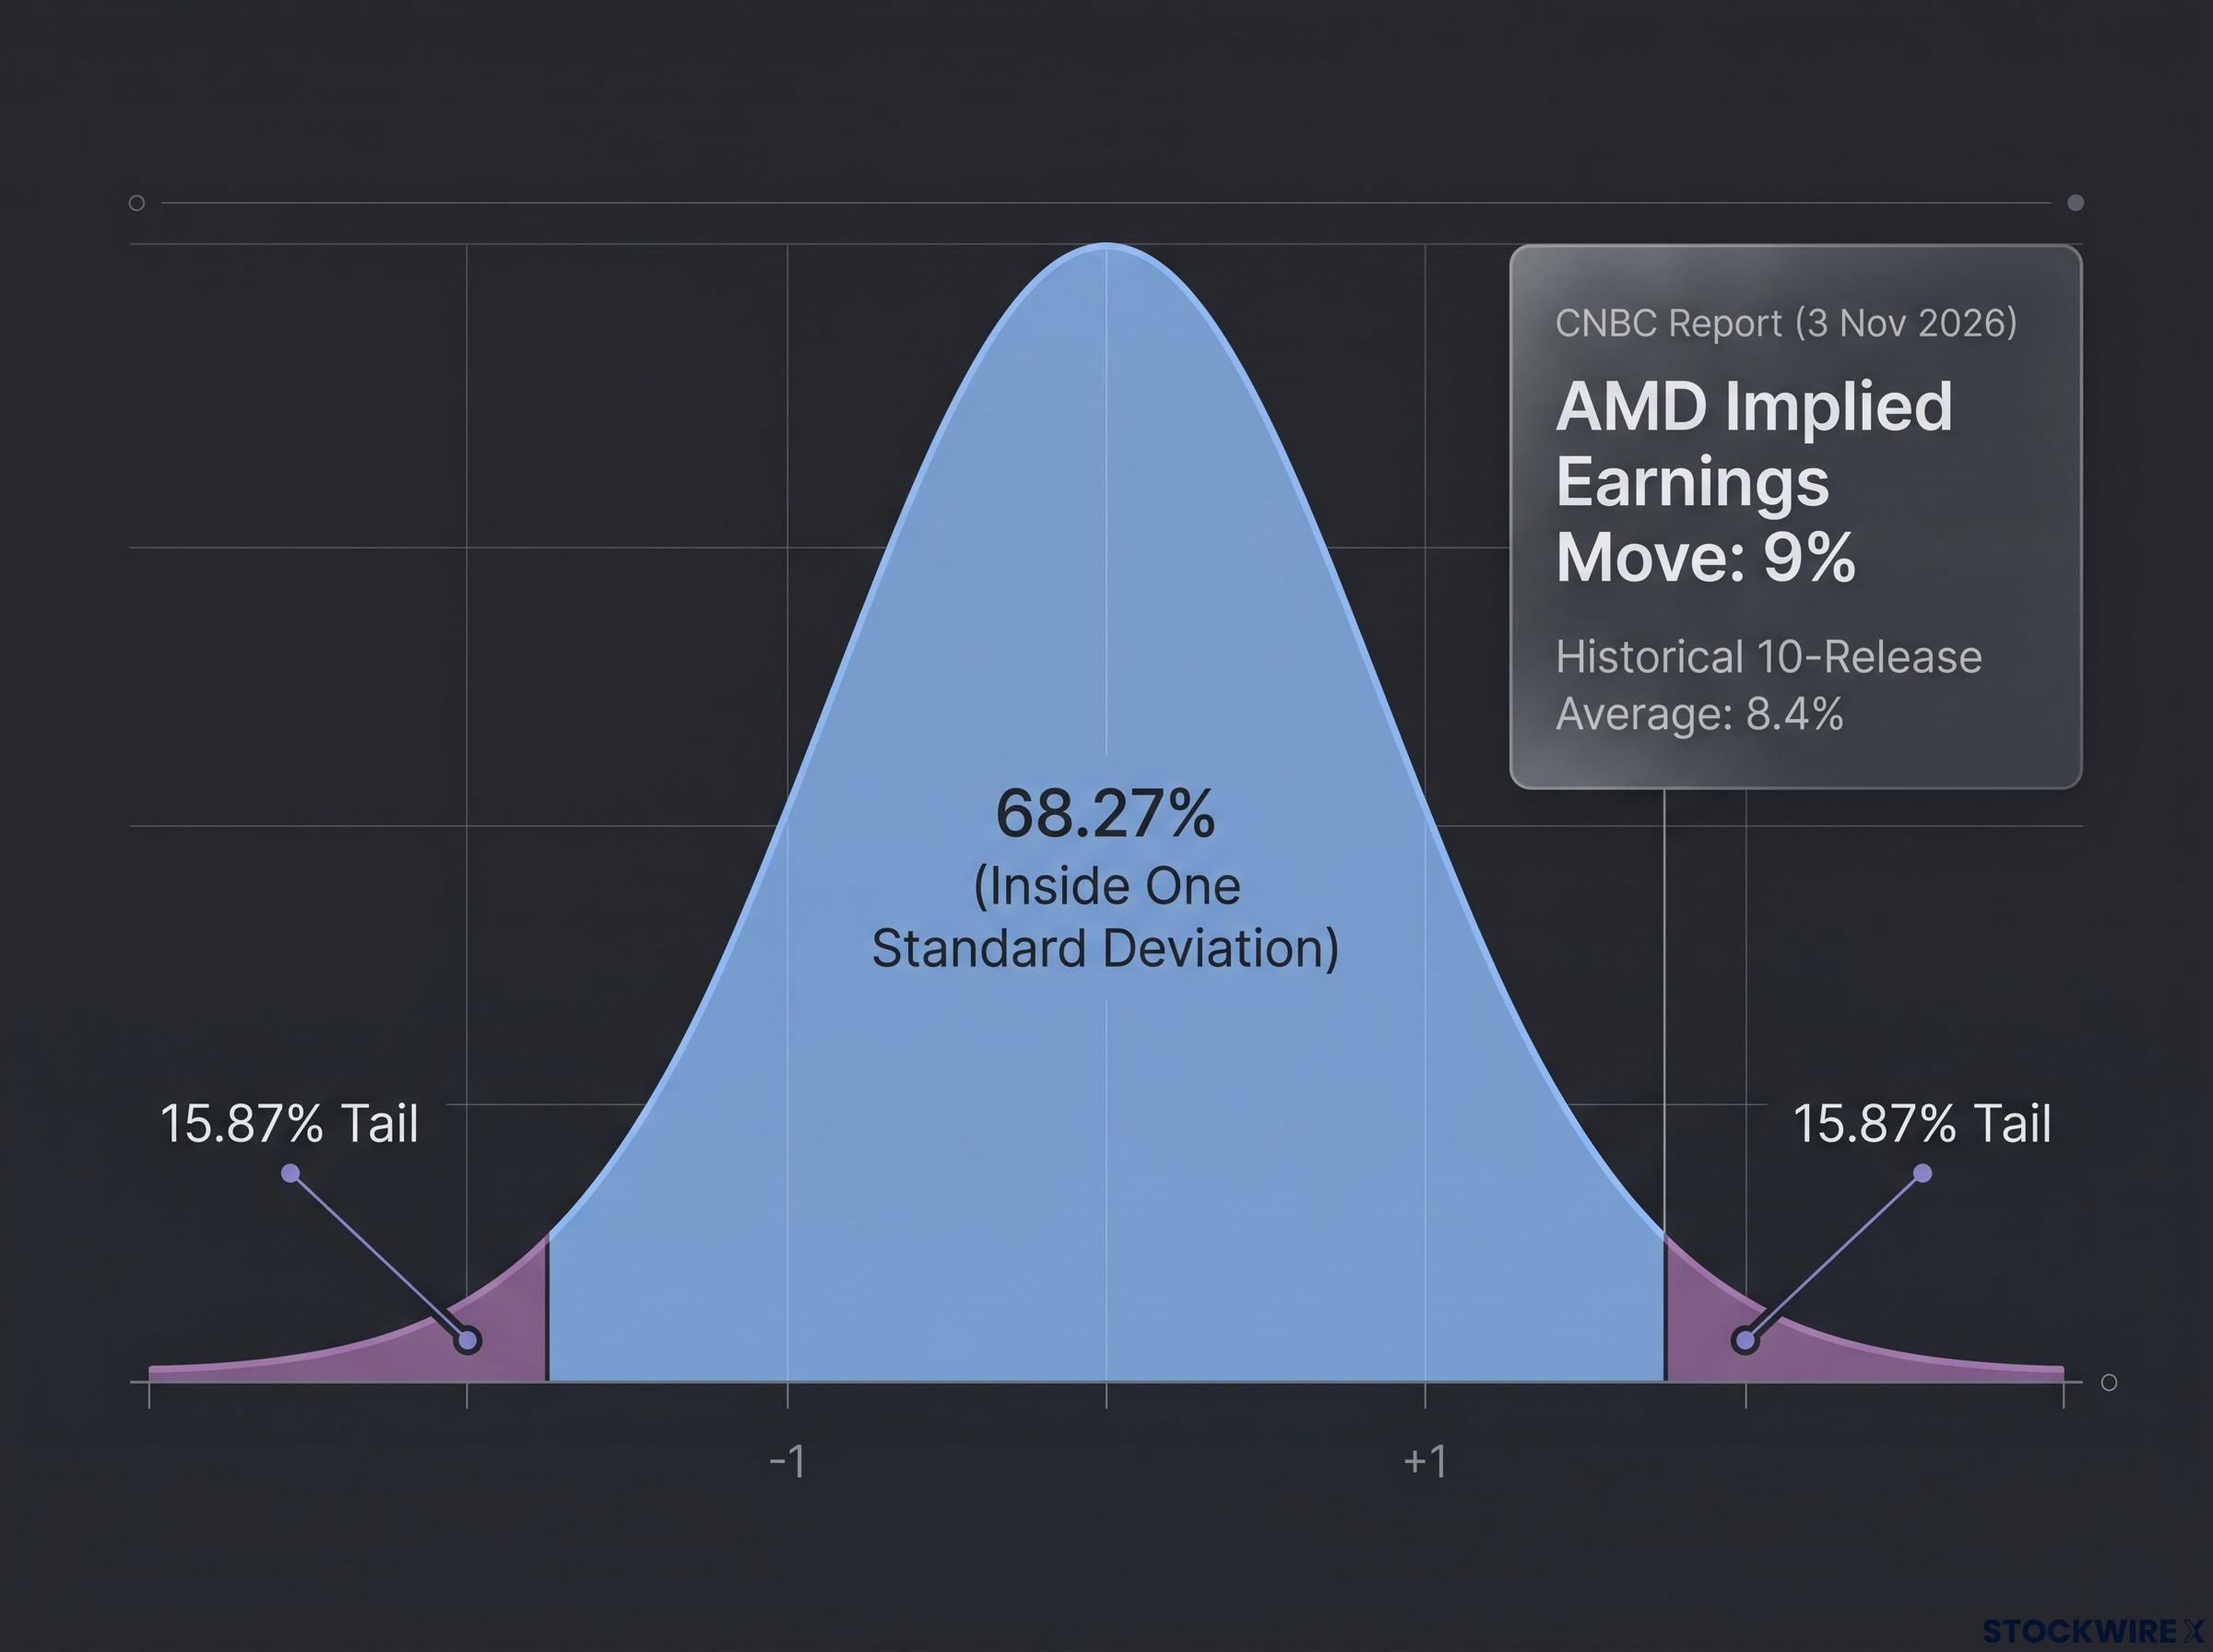
A CNBC report on 3 Nov 2026 showed AMD implied an earnings move of 9%, slightly above its 8.4% historical 10-release average.
| Scenario | Possible structure | Key risk |
|---|---|---|
| Expecting a move larger than implied | Straddle or strangle | Premium paid and IV crush after the event |
| Expecting a move smaller than implied | Defined-risk iron condor or credit spread | A gap through the short strike |
| Selling premium beyond the range | Short strikes outside one standard deviation | Tail moves; losses must be capped |
The expected move tells you where the band sits, not how much to risk. A practical sizing sequence:
- Compute the one-standard-deviation range.
- Stress-test a move to its edge.
- Stress-test a move beyond it, such as a two-standard-deviation move or a past earnings gap.
- Size the position so the stressed loss is one you can accept.
Where the rule bends
The square root assumes calm, independent days. Markets do not always oblige:
- Fat tails: extreme moves happen more often than a normal curve predicts. An LSE paper notes time-scaling assumes independent, identically distributed returns and that fat tails can bias results in either direction.
- Volatility clustering: large moves tend to follow large moves.
- Mean reversion: unusually high IV may fall and unusually low IV may rise, a path flat projections ignore.
- Earnings jumps and IV crush: a report is a single gap, and IV often collapses straight after it.
- Implied versus realised: IV is a price for uncertainty, and actual movement can land above or below it.
The biggest pitfall is treating 68% as safe. A 32% chance of finishing outside the range is substantial, and repeated short-premium trades can take losses in clusters. Treat the expected move as a first-order estimate that frames your risk, not as a safety margin.
Empirical tests of how often expected moves hold suggest the one-standard-deviation band contained one-day futures moves only about 71-82% of the time, with metals, energy and crypto breaching it most often.
This article is for informational purposes only and should not be considered financial advice. Investors should conduct their own research and consult with financial professionals before making investment decisions.
Putting the square root to work on your next trade
Three ideas carry the whole method. Annual volatility figures are a shared yardstick, not a forecast for your trade. The square root of time converts that yardstick to your actual horizon. The result is a one-standard-deviation estimate, useful for framing risk but only worth trusting once you have stress-tested what happens beyond it.
Test it this week. Pick one option you already follow and note its IV and calendar days to expiration. Divide the days by 365, take the square root, multiply by the IV, then apply the result to the share price.
Compare that range with the strikes you were considering. If a strike you thought was distant sits inside the band, you have learned something before risking a dollar.