
Sterling fell below 1.3400 against the US dollar on 6 November 2026, one day after the Bank of England raised interest rates. A rate hike is supposed to support a currency, so the move raises an obvious question about the GBP/USD outlook: why did the pound weaken right after its central bank tightened policy?
The trigger was the US October payrolls report. The US Bureau of Labor Statistics (BLS) reported 165,000 new jobs, well above a consensus of 59,000 to 65,000 depending on the source. GBP/USD dropped roughly 0.6% to around 1.3370, after failing to hold a push towards 1.3500.
The explanation comes down to two things: expectations about future interest rates, which matter more than where rates sit today, and a handful of chart levels where the pair has stalled before.
Once you see how those two forces connect, you have a working framework for reading the pair’s next move rather than reacting to each headline.
Why did strong US jobs data push the dollar higher against sterling?
Start with the size of the surprise. According to the BLS, nonfarm payrolls rose by 165,000 in October. FXStreet put the consensus at 65,000 and ABC News cited 59,000, so the miss was roughly 100,000 jobs on either measure.
The BLS also compared the gain with a prior-12-month average of just 48,000 jobs a month. Unemployment fell to 4.1% from 4.2%. Combined revisions to August and September were reported at +84,000, although that figure has not been independently confirmed.
Each of those details points the same way. The US labour market looked strong enough to cope with tighter policy, and perhaps strong enough to need it.
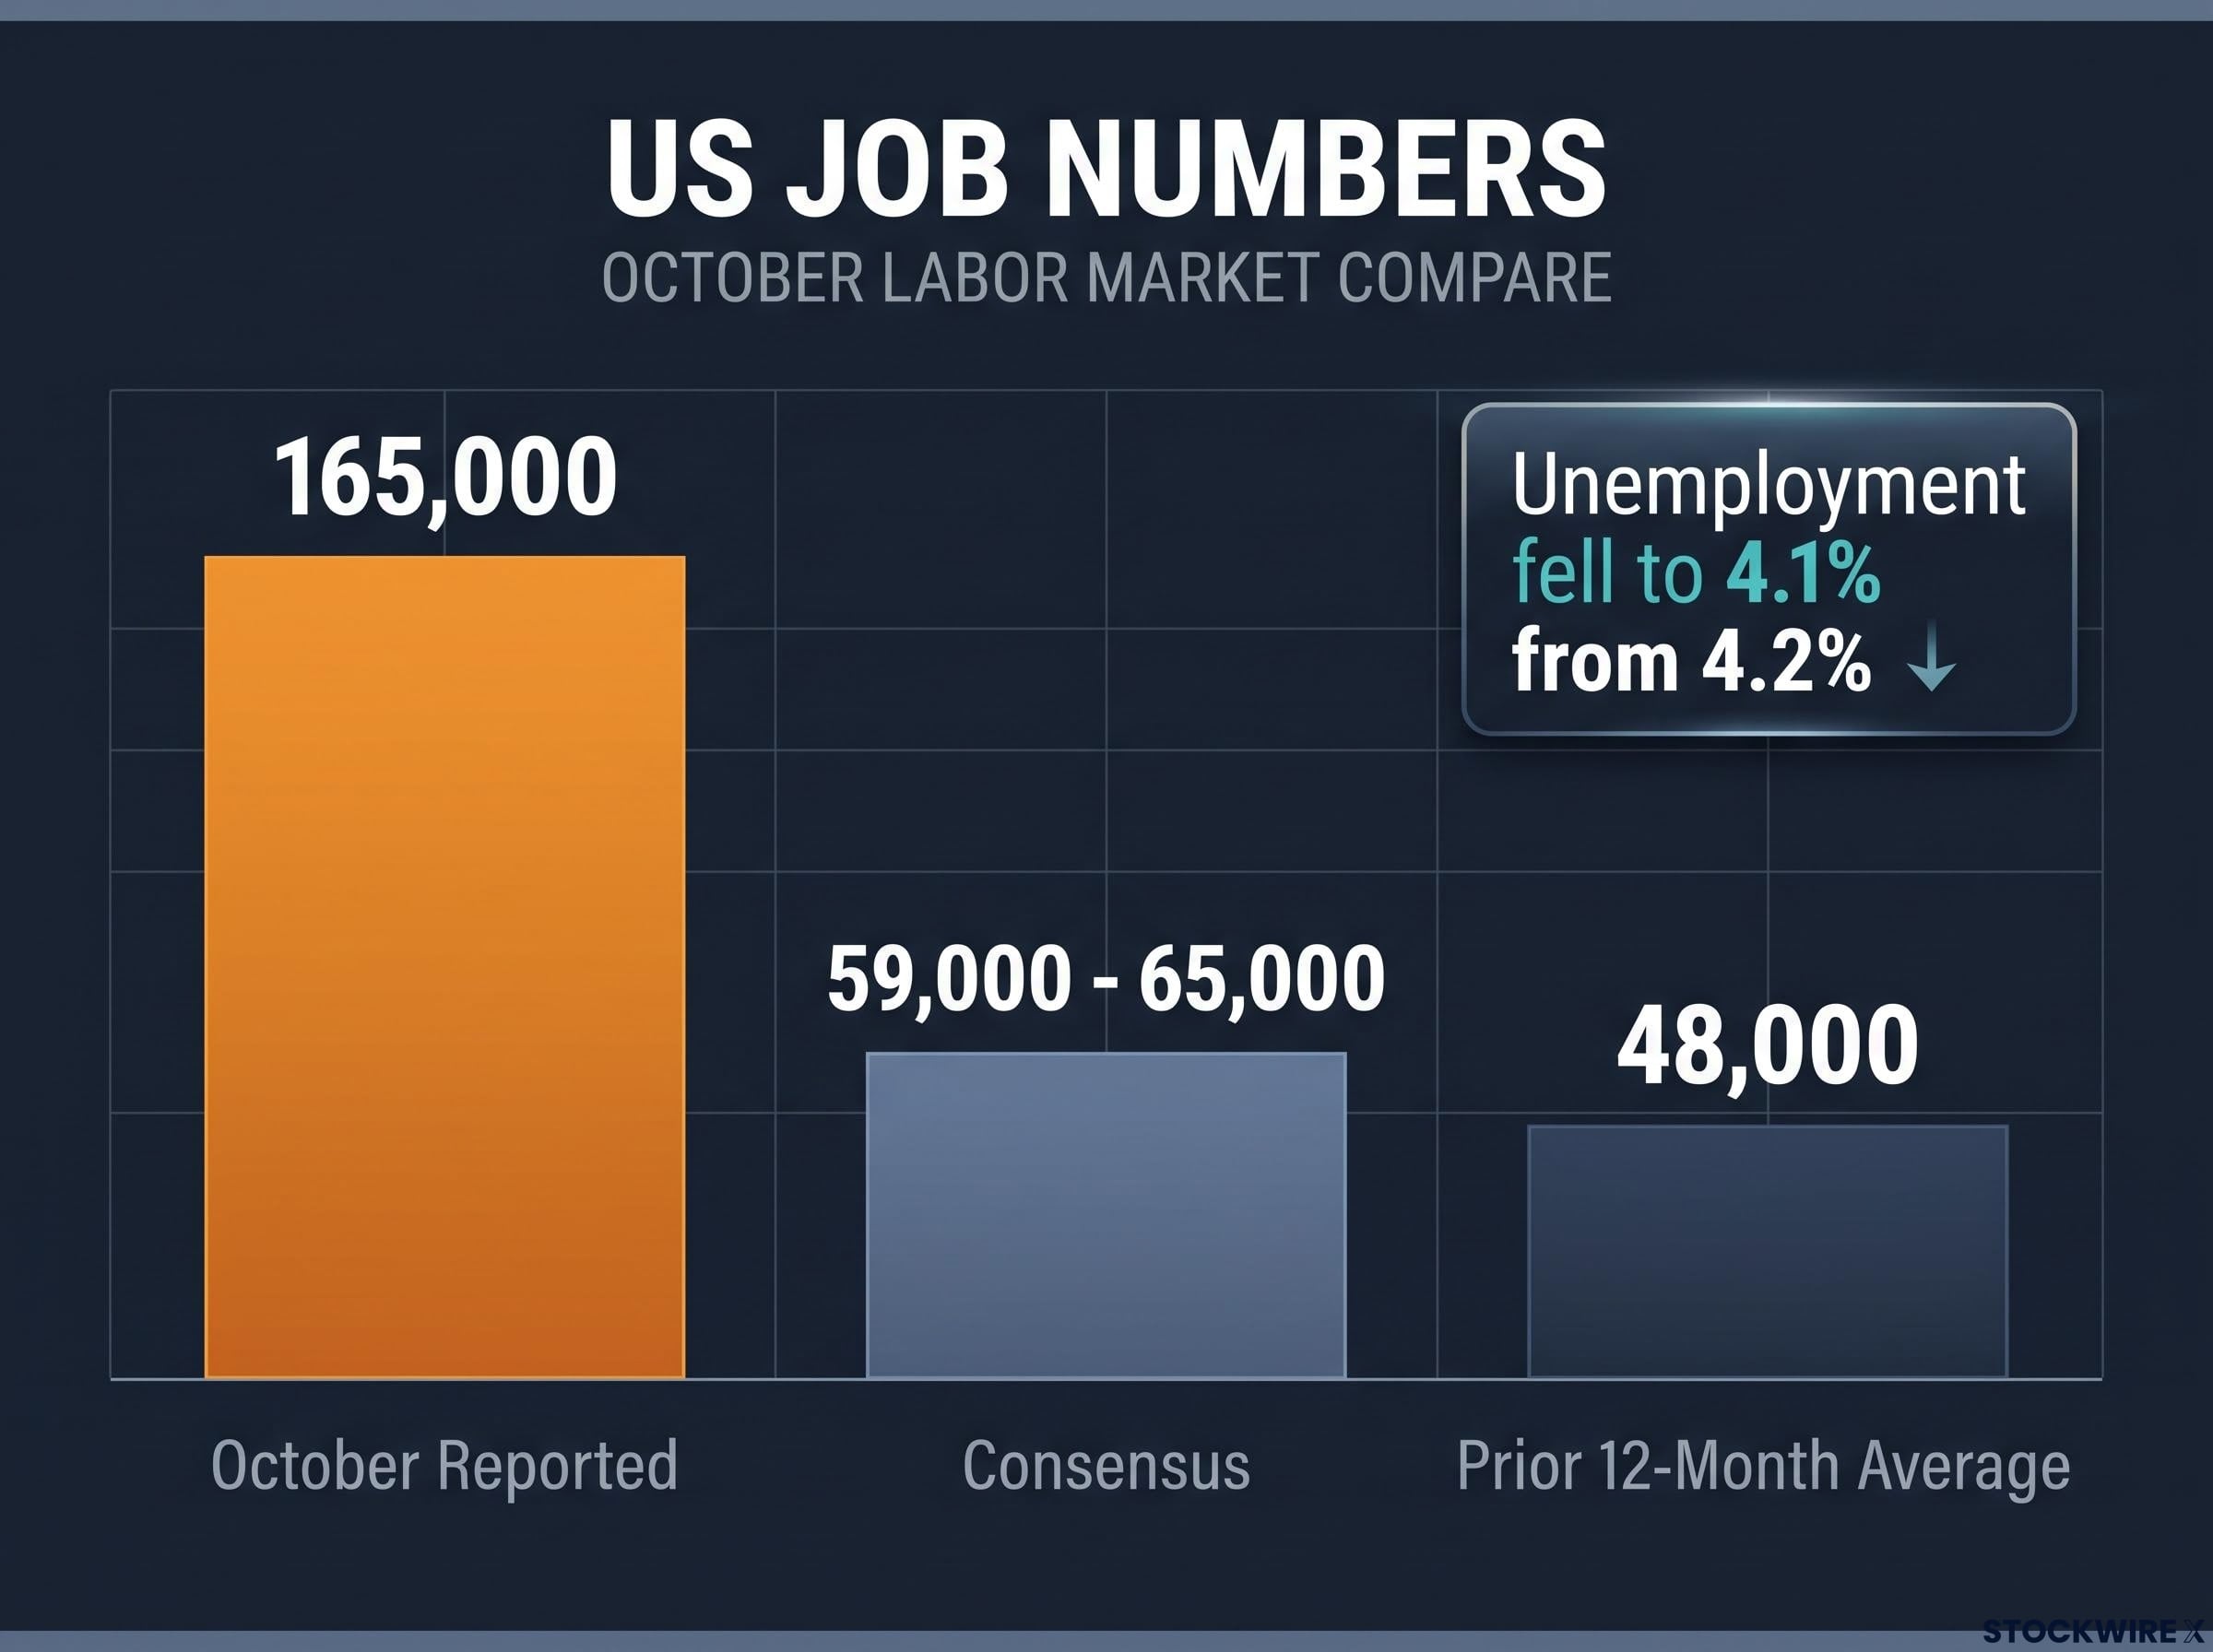
October’s 165,000 reported jobs massively outperformed the 59,000 – 65,000 consensus and the 48,000 prior 12-month average.
Markets moved accordingly. CME FedWatch data, reported by FXStreet, showed the probability of a December Federal Reserve hike rising from about 67% on 5 November to nearly 77% after the release.
CME FedWatch probabilities are derived from live 30-day Fed funds futures, which is why the dollar reprices continuously on data days rather than waiting for an FOMC meeting, and why a large payroll surprise can shift hike odds within a single session.
| Indicator | Reported figure | Prior or consensus | Source |
|---|---|---|---|
| Nonfarm payrolls (October) | +165,000 | Consensus 65,000 or 59,000 | BLS; FXStreet; ABC News |
| Unemployment rate | 4.1% | Prior 4.2% | BLS |
| August-September revisions | +84,000 combined | Not independently confirmed | As reported |
| December Fed hike probability | Nearly 77% | About 67% on 5 November | CME FedWatch via FXStreet |
The warning signs were there. FXStreet reported that MUFG had flagged firmer US labour demand in earlier JOLTS and ADP data, and a higher risk of further Fed tightening.
The key read for you is the ten-point jump in hike odds. That shift in pricing, not the 165,000 headline itself, is what moved the dollar.
How the Michigan survey and inflation expectations fit in
The same day brought a softer signal. Reports agree that University of Michigan consumer sentiment improved and that one-year inflation expectations eased; Reuters put sentiment at 51.0 from 48.0 and one-year expectations at 4.3% from 4.7%, though figures differ between reports.
Lower household inflation expectations would normally take some pressure off a central bank to keep hiking. On 6 November, the payroll shock simply carried more weight.
When big ASX news breaks, our subscribers know first
How do rate expectations turn into a falling GBP/USD?
Here is the puzzle. On 5 November the Bank of England lifted Bank Rate by 25 basis points (a basis point is one-hundredth of a percentage point) to 4.00% from 3.75%.
The vote was 8-1, and the lone dissenter, Catherine Mann, wanted a larger 50 basis point move. On paper that is a hawkish decision, meaning it leans towards tighter policy.
Sterling did respond, rising to about US$1.3477 from US$1.3453 according to reports that have not been independently confirmed. The pair had traded near 1.3463 but could not break 1.3500.
The gains stayed small because markets judged the overall tightening cycle to be modest. Reports also said the BoE linked possible further hikes to energy prices, but that signal has not been independently confirmed.
Bailey’s warning that inflation risks lean upwards and that the Bank Rate decision might not be the last if the conflict continues helps explain why the pound found only fleeting support, since a hike that markets had already priced in rarely moves a currency.
So why did a US jobs report undo a UK rate hike? The answer is the rate differential: the gap between the interest rates investors expect in the US and the UK. Money tends to flow towards the currency offering the better expected return.
The chain runs like this:
- A data beat shows the US economy running hotter than forecast.
- Fed hike odds rise as traders price more tightening.
- Treasury yields climb, since US government bond returns track expected policy rates.
- The US-UK differential widens in the dollar’s favour.
- GBP/USD falls, because each pound now buys fewer dollars.
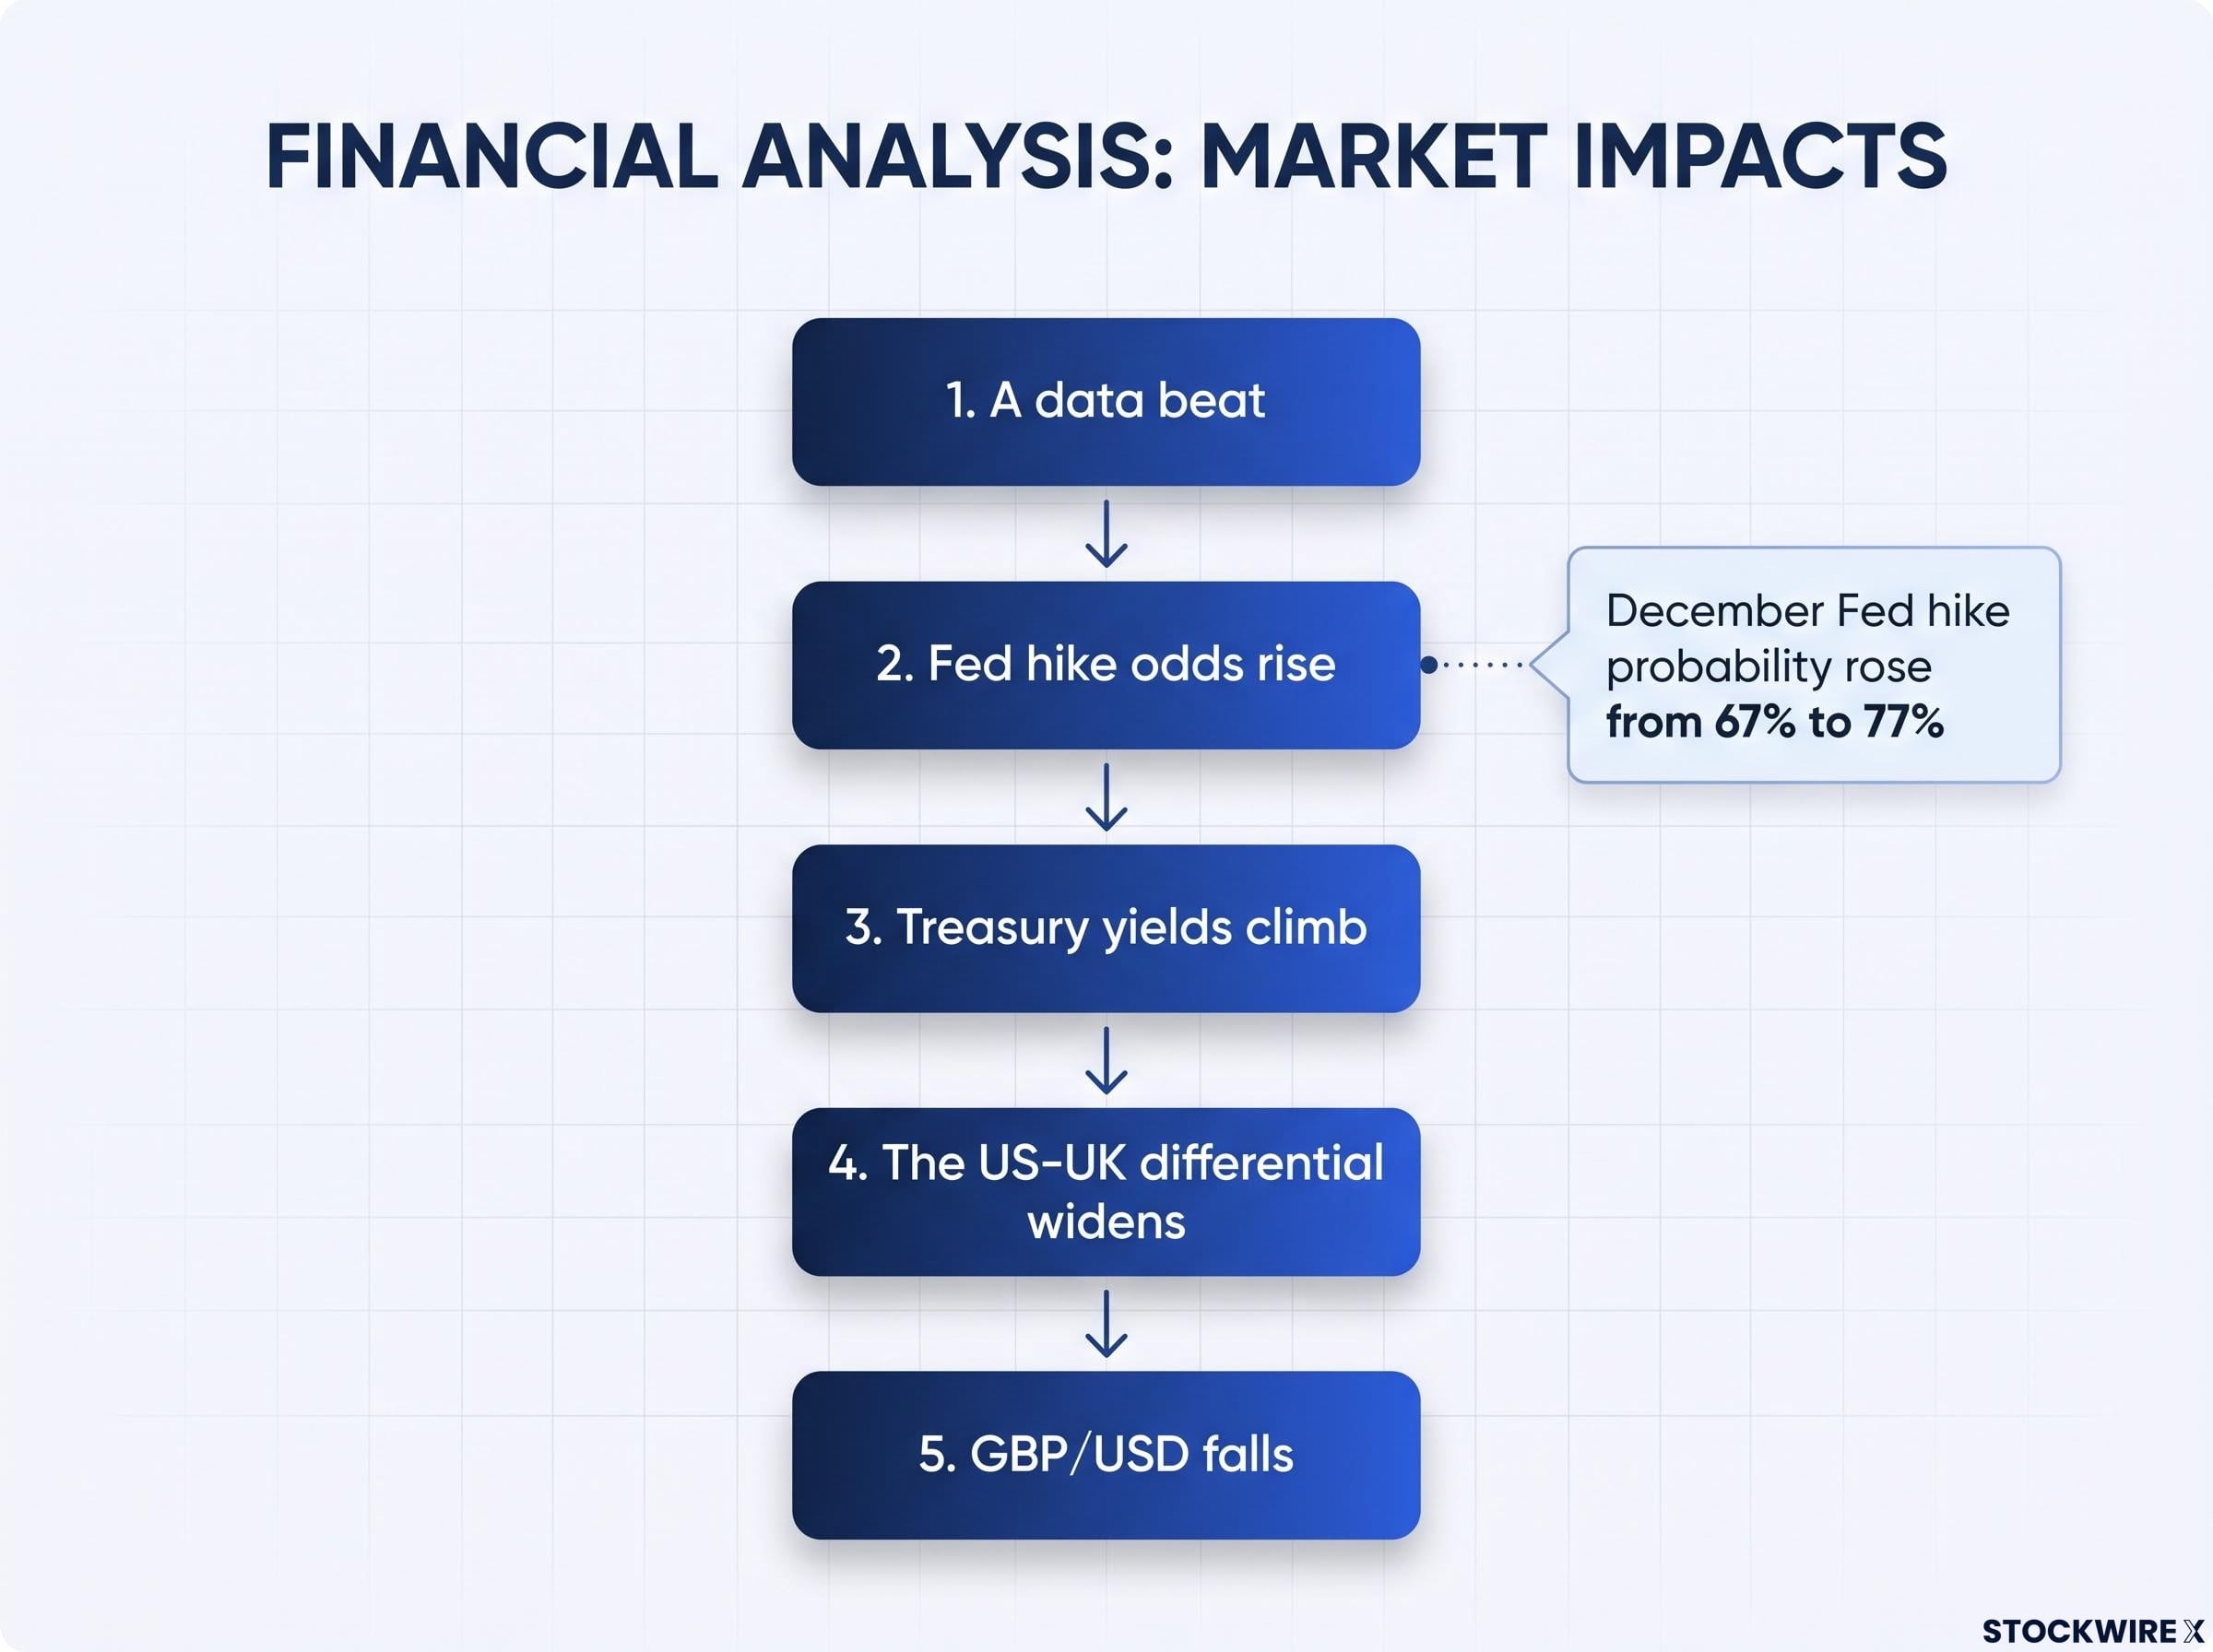
A data beat initiates a 5-step process that leads to GBP/USD falls, driven by December Fed hike probability rising from 67% to 77%.
A simple example makes it concrete. If expected US tightening rises faster than expected UK tightening, holding dollars becomes relatively more rewarding, and demand for dollars pushes the exchange rate lower.
Key point The market was reacting to the change in expected future policy, not the level of rates.
For you, the practical lesson is that a central bank hike only supports a currency when it exceeds what markets already expected. Watch the change in pricing, not the headline rate.
What does the wider currency picture and the US-Iran backdrop say about sterling?
If sterling were genuinely in trouble, it would have fallen across the board. It did not.
The FXStreet heat map shows the pound’s sharpest loss came against the dollar, with only modest moves elsewhere.
| Pair | Change | Read |
|---|---|---|
| GBP/USD | -0.64% | Weakest pair; dollar-driven |
| GBP/EUR | -0.02% | Essentially flat |
| GBP/JPY | -0.32% | Yen outperformed |
| GBP/CHF | -0.23% | Franc outperformed |
| GBP/CAD | +0.06% | Marginally firmer |
| GBP/AUD | +0.18% | Sterling gained |
| GBP/NZD | +0.25% | Sterling’s best pair |
Equivalent cross moves for 5 November were not found, so a direct before-and-after comparison is not possible. Even so, near-flat trading against the euro tells you this was a dollar story. A broad bearish view on sterling would not be supported by the day’s moves.
There is a precedent. On 5 June 2026, the pair also broke below 1.3400 after payrolls of 172,000 against an 85,000 forecast, according to FXStreet reporting that has not been independently confirmed. November’s surprise was larger once the upward revisions are counted.
The energy and geopolitical lens
US-Iran tension cuts both ways for the pound. Higher oil prices lift UK inflation and push the BoE towards tightening, which can support sterling, but they also weigh on UK growth and drive safe-haven demand for the dollar.
A diplomatic breakthrough would reverse that logic: lower oil, less inflation pressure and a weaker case for further BoE hikes. Reports of mediation progress circulating on 6 November remain unconfirmed, and no verified peace-process development was found.
Where are the key GBP/USD support and resistance levels?
Price now sits just above a key line. FXStreet put spot at 1.3368 and TMGM at 1.3371, with the 14-day Relative Strength Index (RSI, a momentum gauge running from 0 to 100) at 50.77, a neutral reading. FXStreet noted its technical commentary was produced with an AI tool.
Immediate support is 1.3362, where the 50-, 100- and 200-day simple moving averages (SMAs, the average closing price over that many days) converge. Above sits 1.3500, the breakout that failed.
| Level | Role | Note |
|---|---|---|
| 1.3855 | Resistance | Former rising support trend line |
| 1.3684 | Resistance | Former rising support trend line |
| 1.3500 | Resistance | Failed breakout |
| 1.3381 | Resistance | Initial hurdle |
| 1.3362 | Support | 50-, 100- and 200-day SMA cluster |
| 1.3345 | Support | Fibonacci level |
| 1.3267 | Support | Earlier retracement level |
| 1.3235 | Support | Prior resistance break |
The SMA cluster is where this move either stalls or speeds up. A hold suggests the payroll shock has been absorbed; a clean break opens the deeper levels.
Data will decide which happens, not the chart alone. The events to watch:
- BoE speeches
- UK GDP
- US CPI
- US jobless claims
- Fed commentary
Keep one caveat in mind. October’s gain sat far above the 48,000 monthly average, and a single month of payroll data can be noisy, so extrapolating the move would be risky.
A payroll release framework that weighs the wage component, Fed commentary and the next CPI print is more useful than the headline alone, because a firm wage reading can lift hike odds well beyond what the jobs number implies.
Making sense of the GBP/USD outlook as data and the BoE collide
The 6 November slide came from a jump in Fed-hike pricing that outweighed a fresh BoE hike, and the weakness was concentrated against the dollar.
Your framework is straightforward. US CPI and jobless claims will steer Fed odds. BoE speeches will clarify how far UK tightening runs. Oil and US-Iran headlines shape inflation risk on both sides, and 1.3362 and 1.3500 mark the chart’s decision points.
The bearish case rests on a strong US labour market and steady dollar demand. The stabilising case rests on a 4.00% Bank Rate and a policymaker who wanted a bigger hike. Which one prevails depends on the next round of data, not on the direction of a single day’s move.
This article is for informational purposes only and should not be considered financial advice. Investors should conduct their own research and consult with financial professionals before making investment decisions.