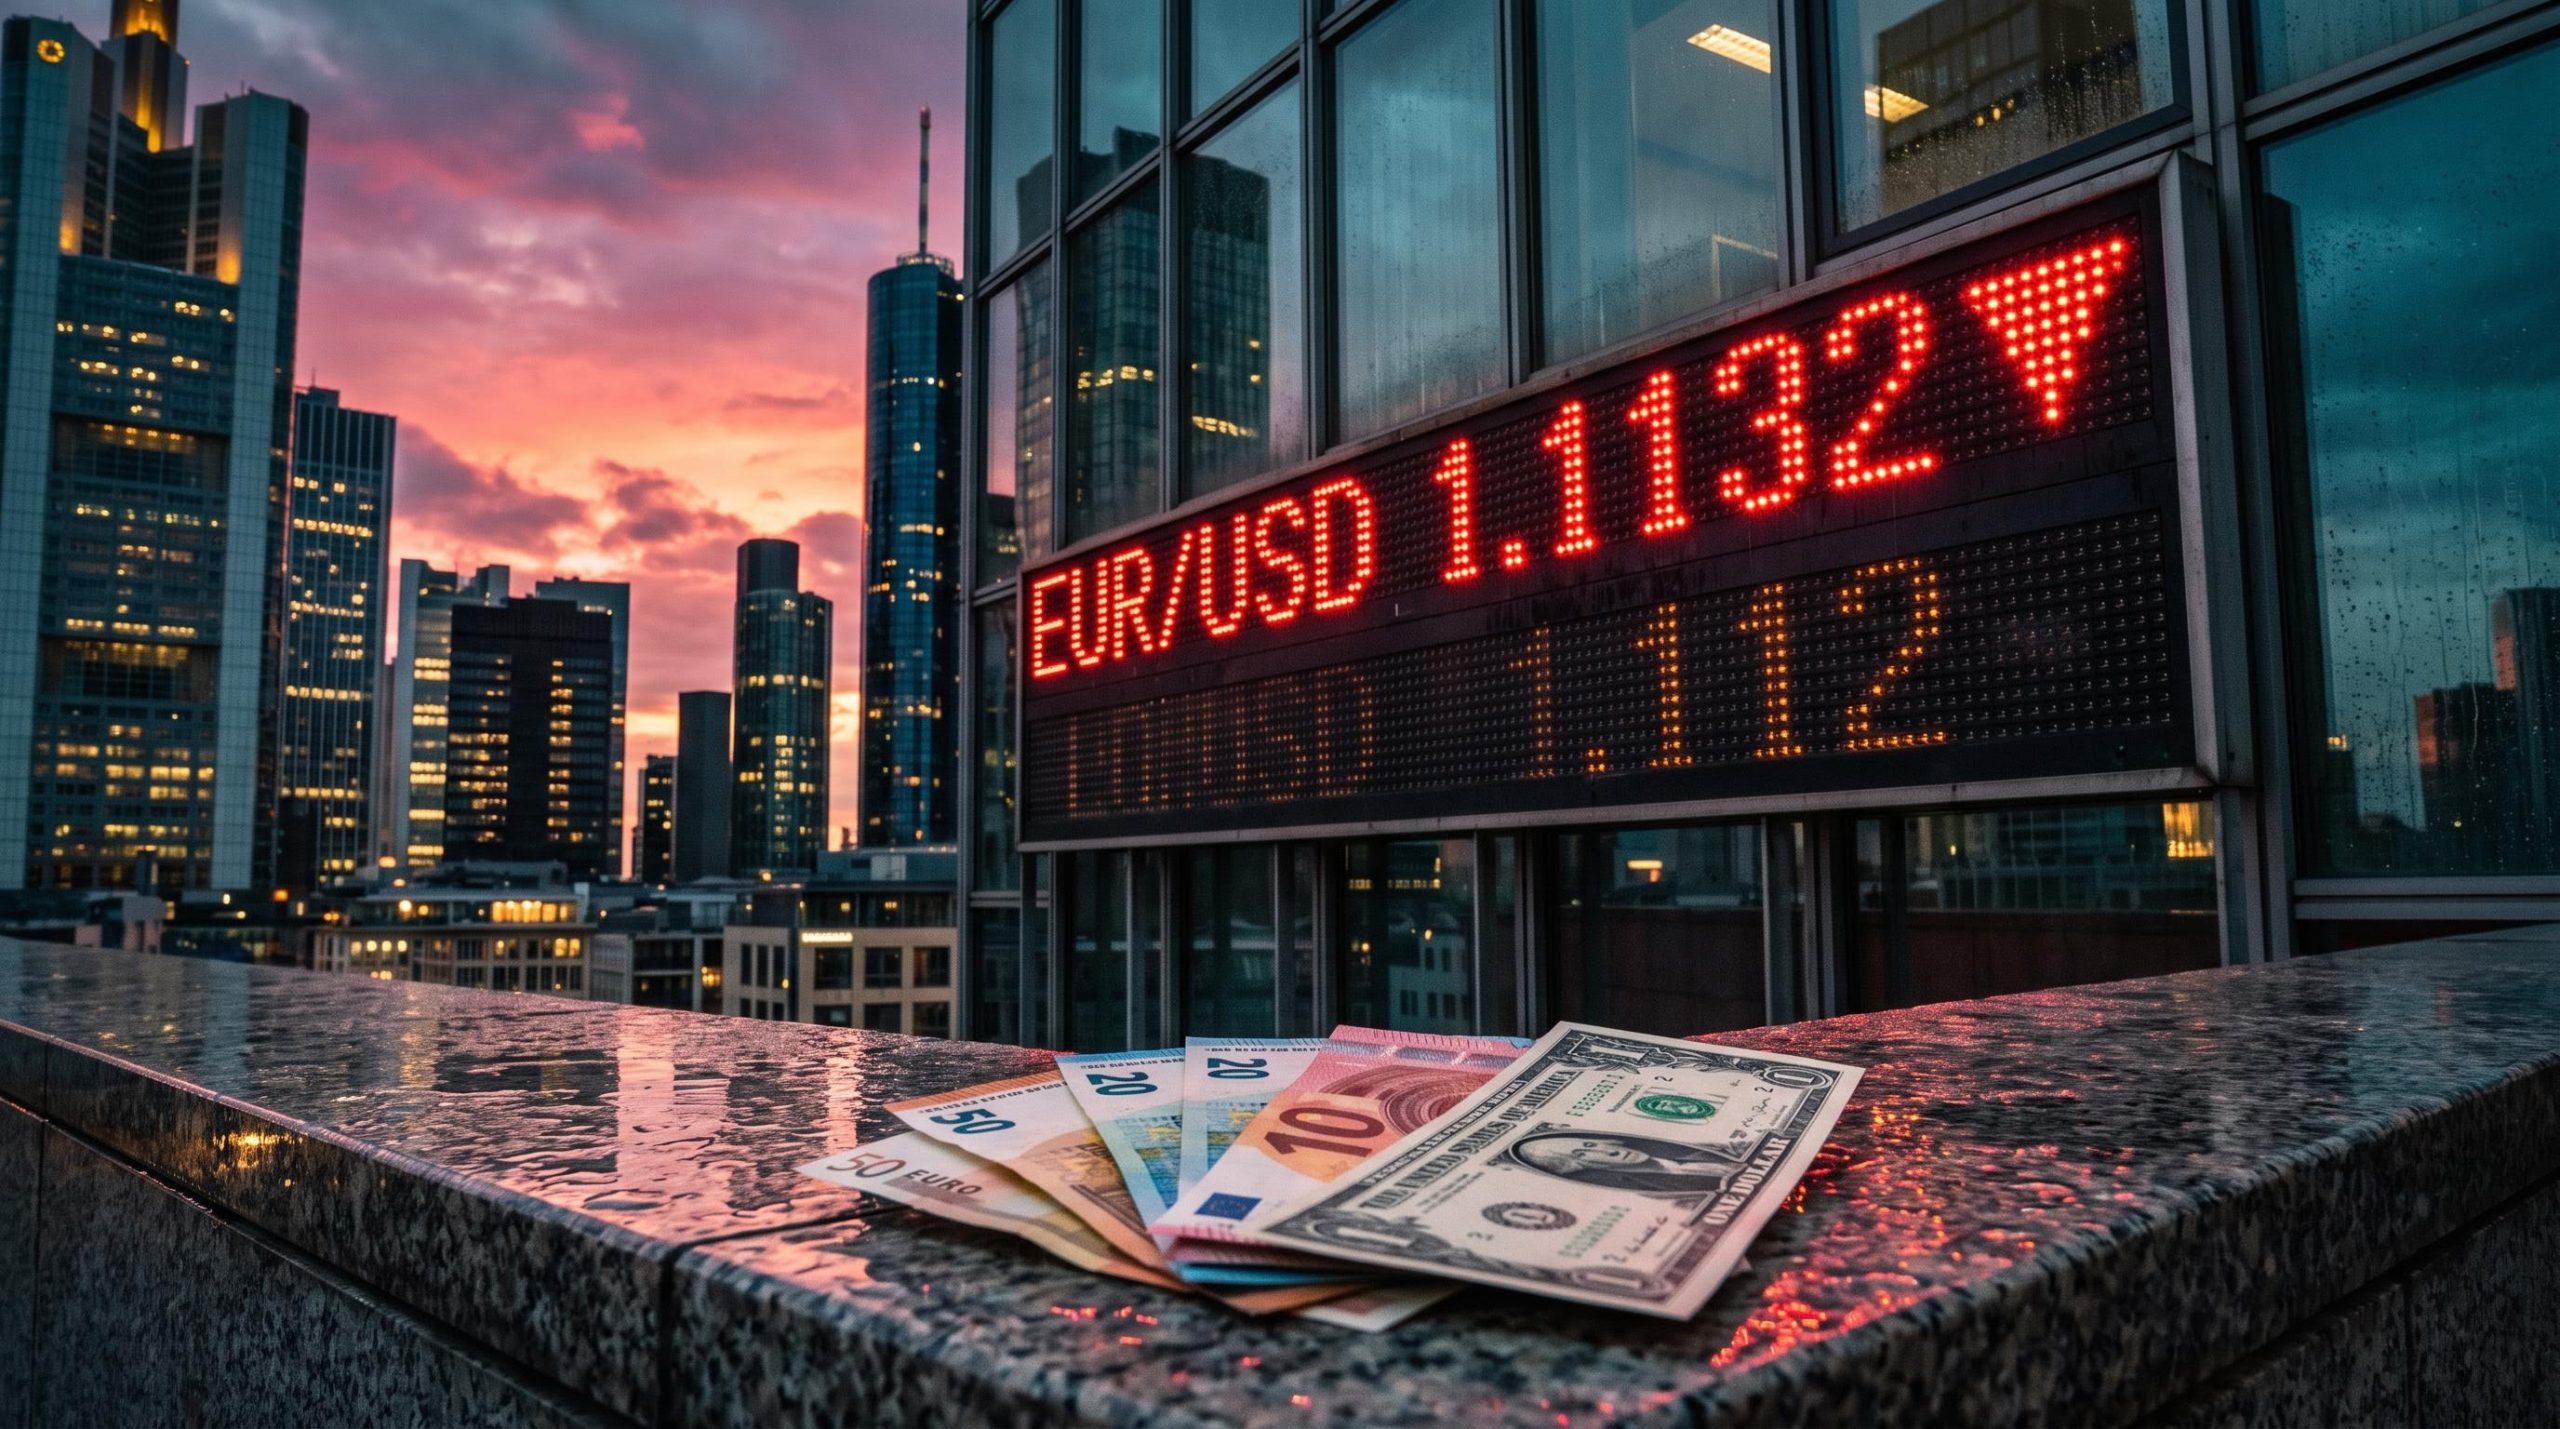
On 6 November 2026, the People’s Bank of China (PBOC) set the yuan’s daily midpoint at 6.7168 per dollar. That was 406 pips weaker than the 6.6762 level the market expected, even though the currency has gained roughly 4%-5% against the dollar this year. Many people will read that gap as daily noise. It is better read as a message about the yuan outlook for 2027.
The message is landing in a split market. Analysts at Societe Generale believe the renminbi is close to its peak and forecast USD/CNY bottoming at 6.60 in Q1 2027. UBS, Goldman Sachs and MUFG still expect the yuan to keep climbing.
Both camps are looking at the same data and reaching different conclusions. Working out which side is more persuasive comes down to how you read a central bank that manages its currency rather than letting it float.
This piece gives you a way to read those central bank signals. You can apply it to the yuan now and to any managed currency later.
What did the PBOC just do, and why does it matter for the yuan outlook 2027?
The clearest step so far came this week. The PBOC lifted the foreign exchange (FX) deposit reserve requirement ratio, or RRR, by 2 percentage points, from 4% to 6%. The FX RRR is the share of foreign-currency deposits that banks must park with the central bank instead of using.
The key dates and moves:
- 15 September 2023: FX RRR cut to 4%, where it stayed for more than three years
- 26 October 2026: midpoint set at 6.7162, the strongest since February 2023
- 3 November 2026: spot weakened to 6.6728 after the hike was reported, closing at 6.6765
- 4 November 2026: announcement reported by China’s State Council Information Office
- 6 November 2026: spot at 6.6690 at 02:55 GMT, after a five-week advance stalled
- 15 November 2026: the 6% ratio takes effect
Citic Securities estimates the hike ties up about US$24 billion of dollar liquidity. Banks with fewer spare dollars have less room to sell them for yuan, so appreciation slows. This is a liquidity tool. The PBOC is not selling yuan directly.
The hike also ended a 13-session winning streak for the yuan, its longest since 1996, and the 2 point step is smaller than the 2021 tightening, leaving Beijing room to escalate if appreciation resumes.
The 406 pip signal On 6 November the PBOC fixed USD/CNY at 6.7168, against a market estimate of 6.6762. A weaker-than-expected fixing tells traders the central bank wants slower gains.
For you, the distinction matters. A reserve requirement change works on how many dollars banks can supply, not on the exchange rate itself. It can take the speed out of a rally without setting any target level.
When big ASX news breaks, our subscribers know first
How does the daily fixing reveal what the PBOC wants, and how can that lean be measured?
The reserve hike is a tool the PBOC uses only occasionally. The fixing is a signal it sends every morning.
Reading the fixing
Each trading day, the PBOC publishes a midpoint. Onshore spot may then trade within about 2% either side of it. If the USD/CNY fixing comes in higher than expected, the PBOC is restraining the yuan. If it comes in lower, it is supporting it.
Using 6 November as the example:
- Expected level: models and market estimates put the fixing at 6.6762.
- Actual fixing: the PBOC published 6.7168.
- The gap: 406 pips, which is large by fixing standards.
- Direction of lean: higher USD/CNY, so the PBOC is leaning against further yuan strength.
The gap is hard to read without help because the formula is opaque. In 2017 the PBOC added a counter-cyclical factor to the fixing to weight fundamentals and discourage herd trading. It never disclosed how the factor worked, revised the method several times and suspended it in 2020. Traders now infer intent by comparing the actual fixing with model-implied levels.
The daily yuan fixing mechanism combines the previous onshore close, overnight basket moves and a discretionary counter-cyclical factor, which is why the gap against model estimates is treated as the closest real-time readout of Beijing’s policy priorities.
What the lean index measures
Societe Generale analysts Frank Benzimra, Michelle Lam and Kiyong Seong built a CNY Fixing Lean Index to put a number on that bias. It tracks the direction and strength of the fixing signal relative to what market-based models imply. The primary SocGen note was not publicly accessible, so these details come from related commentary by FXStreet and Reuters-syndicated reports.
What this tells you is simple. The headline rate shows where the yuan is now. The gap between the actual and expected fixing shows where the PBOC would like it to go.
Why do low Chinese yields limit the case for holding yuan?
If the PBOC is leaning against gains, the next question is whether foreign investors will push back. The yield numbers suggest they have little reason to.
| Indicator | Latest figure | Source and date |
|---|---|---|
| 10-year government bond yield | 1.58%-1.60% | Bloomberg via CNBC, 6 November 2026 |
| Main policy rate (overnight reverse repo) | 1.25%, replacing the 1.40% seven-day benchmark | Effective 2 November 2026 |
| Consumer price inflation | 0.9% year on year (September 2026) | NBS, released 14 October 2026 |
The reason these numbers matter is carry. Carry is the income you earn from holding a currency’s assets, mainly the interest or bond yield it pays. When a currency yields more than the dollar, that income can offset some of the risk that the currency falls. When it yields less, you are taking currency risk for very little reward.
A 1.60% bond yield offers a thin cushion. Societe Generale argues that ample liquidity and weak inflation let Chinese rates drift lower still, while low starting yields already limit the appeal to foreign investors. If investors expect the yuan’s gains to stall, there is little income to make waiting worthwhile.
That is the case for a peak. The other side argues the case barely depends on investors.
UBS, Goldman Sachs and MUFG point out that yuan demand comes mainly from trade. Export receipts, the surplus, companies converting dollars and restrictions on money leaving China all generate demand that has nothing to do with bond yields.
This tells you the yuan does not behave like a high-yielding emerging market currency. Its strength rests on trade flows, not on investors’ appetite for yield. That is why the same low-rate data supports both the peak view and the no-peak view.
Where does SocGen’s 6.60 floor sit against UBS, Goldman and MUFG?
Placed side by side, the forecasts show which house stands apart.
| Institution | USD/CNY forecast | Key reasoning |
|---|---|---|
| Societe Generale | 6.60 trough in Q1 2027 | Higher FX RRR, less accommodative fixings, low yields |
| UBS (Yu Song and colleagues) | 6.60 by December 2026, 6.50 by mid-2027 | Trade surplus, undervaluation, internationalisation, exporter conversion |
| Goldman Sachs | 6.40 at 12 months | Exceptionally large surplus and exporter conversion |
| MUFG | 6.65 end-2026, 6.50 in Q3 2027 | RRR hike slows rather than reverses appreciation |
Societe Generale is the only house that sees 6.60 as the end of the yuan’s run. Every other forecast in the table extends beyond it. SocGen also sketches a scenario, not announced policy, in which a further FX RRR hike to 8% paired with a higher fixing would send a strong signal against more appreciation.
Citic Securities and most analysts surveyed by Reuters sit closer to the other camp. They expect incremental measures to slow gains rather than change the surplus-driven direction. Their concern is friction with trading partners.
Trade-partner friction is already visible in the EU, where a goods deficit with China of 360.6 billion euros has pushed talks toward sectoral tools, and the yuan’s real exchange rate sits well below its 2022 peak.
That surplus is large. China’s goods surplus reached US$938.1 billion in January-September 2026, up from US$726.2 billion a year earlier. Each dollar of export earnings is a dollar that may eventually be converted into yuan.
The swing factors that could settle the debate:
- Exporter conversion: companies usually swap more foreign earnings into yuan towards year-end and before Lunar New Year, which UBS’s Yu Song flags as a near-term support
- Federal Reserve path: a more dovish Fed adds pressure for yuan gains, while a more hawkish Fed supports USD/CNY
- US jobs data: payrolls feed directly into Fed expectations
- Trade-partner friction: pushback on the surplus could cut either way
The range is best read as a debate over which force wins: policy friction or trade flows. The indicators above will show you which side is gaining ground.
Past performance does not guarantee future results. Financial projections are subject to market conditions and various risk factors.
Has the PBOC leaned against the yuan before, and how did it end?
The PBOC has used these tools before, and its record shows how it tends to use them.
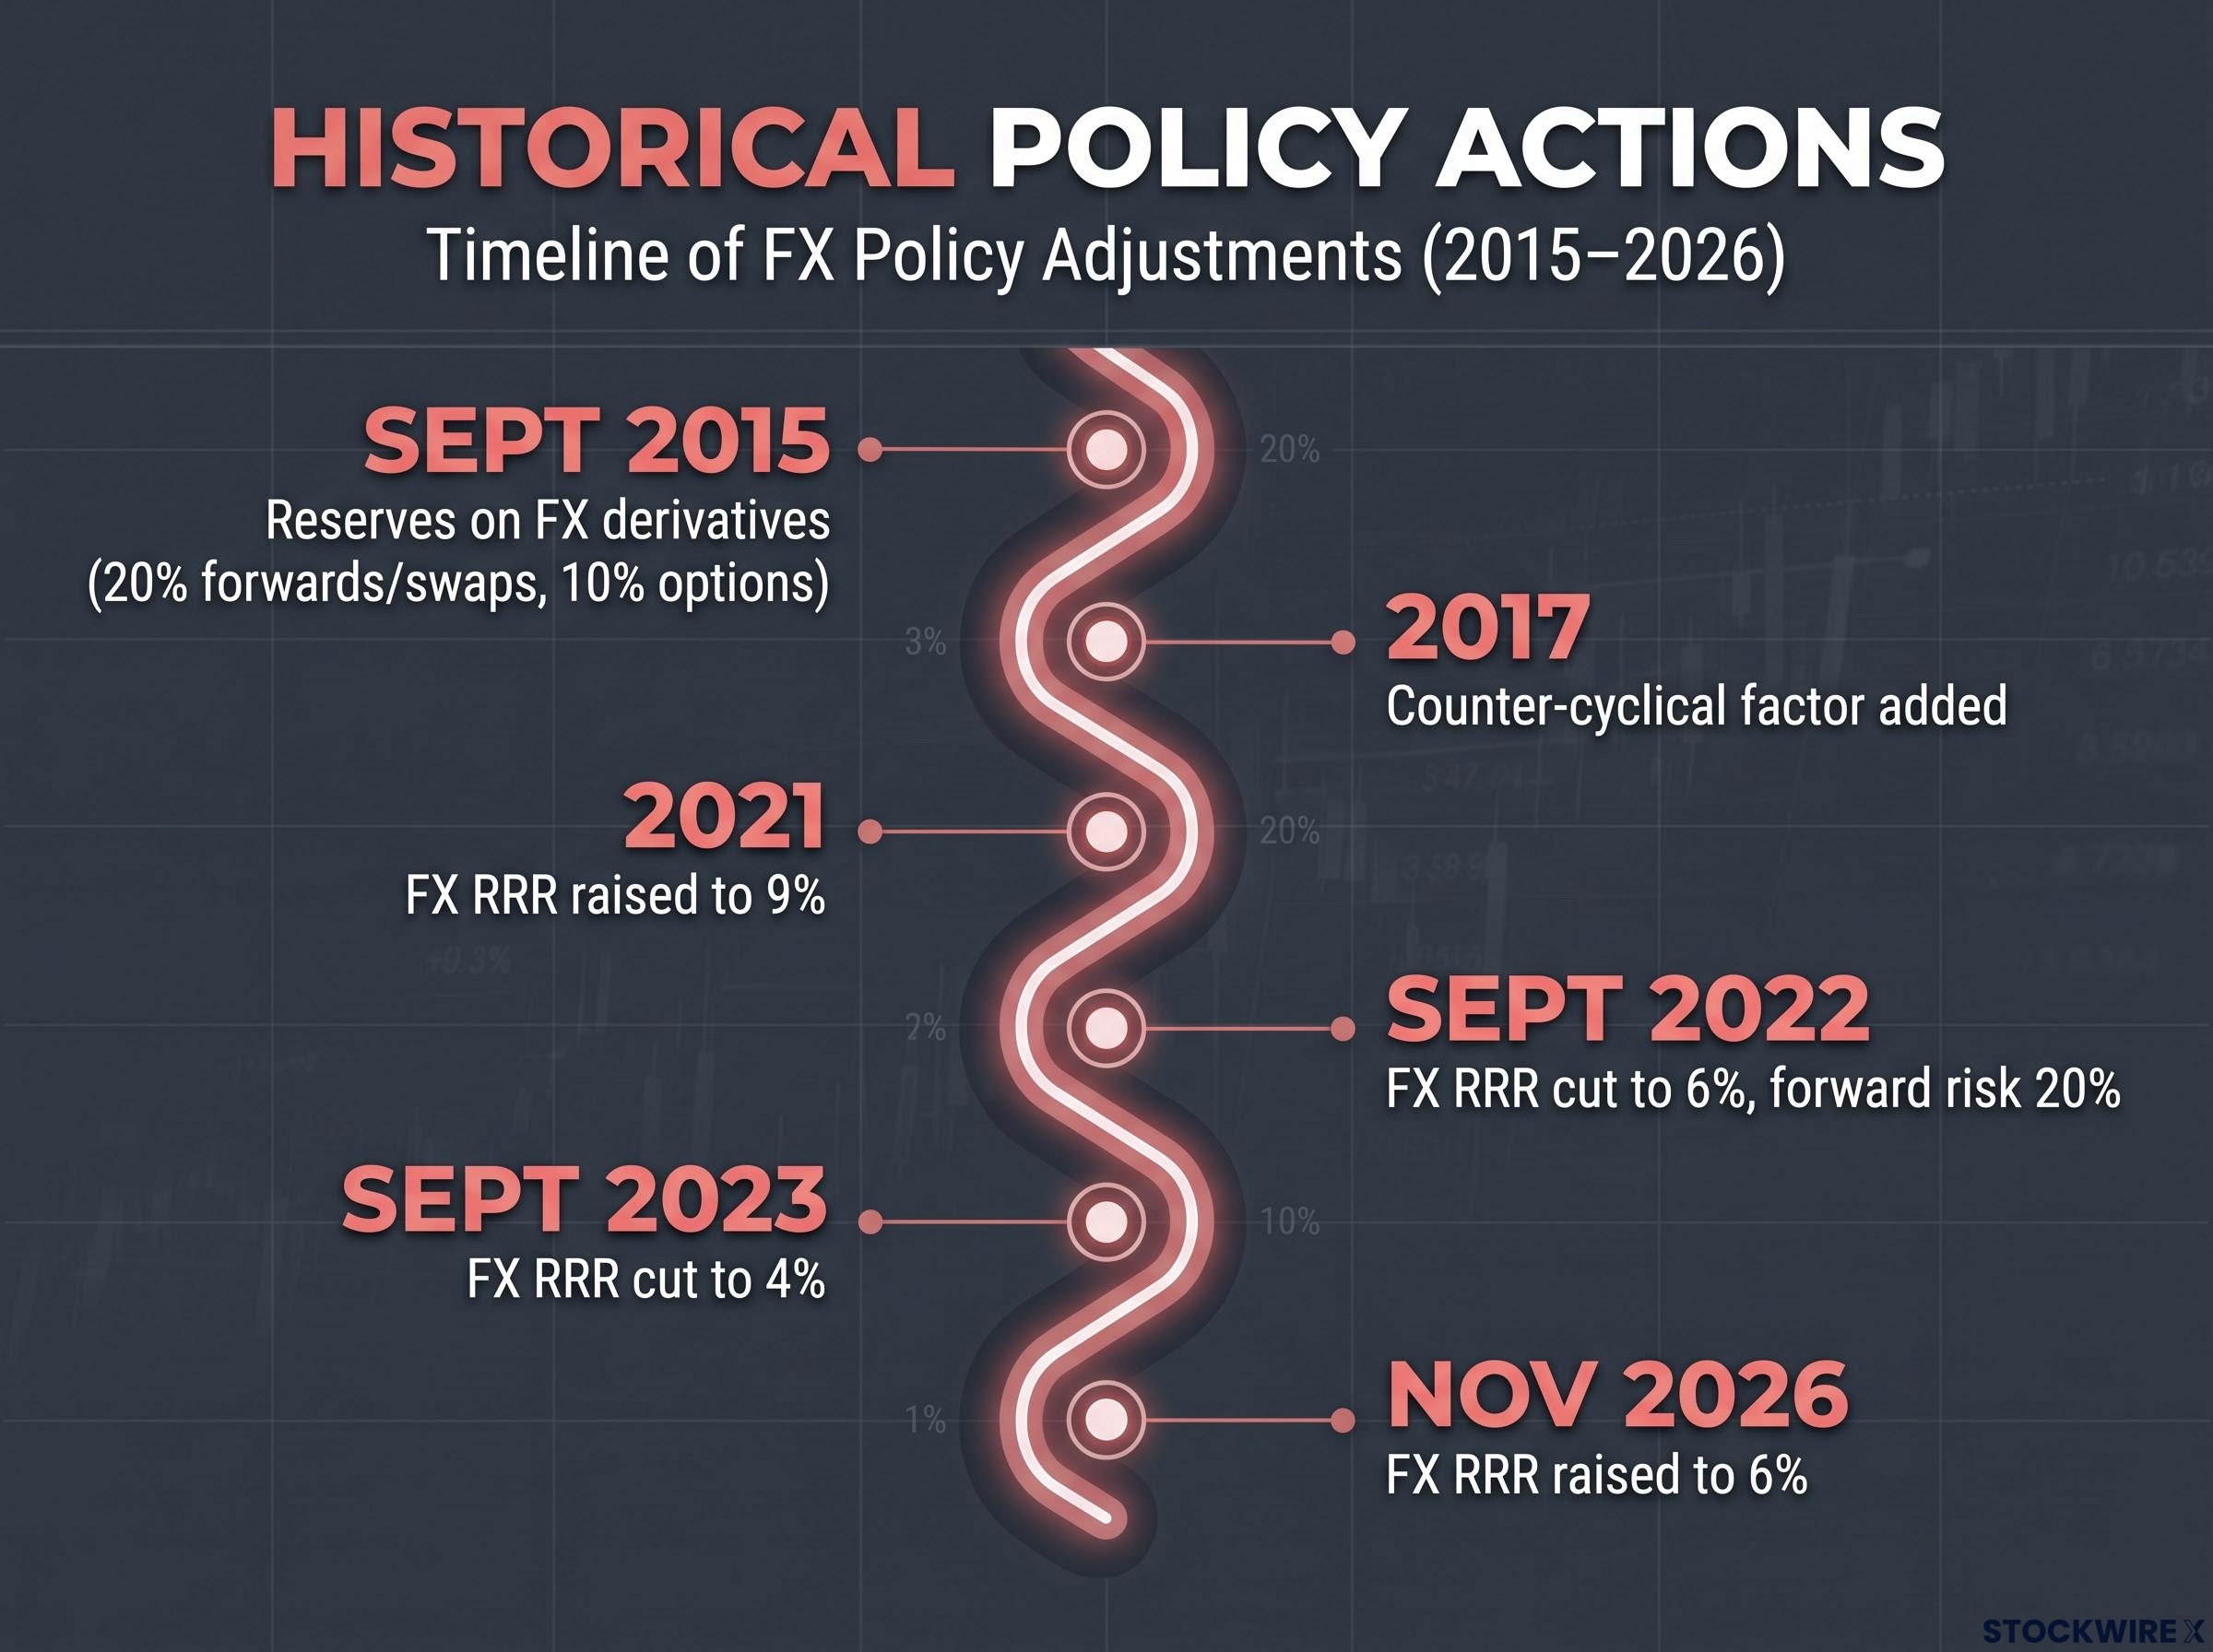
The PBOC has historically used policy tools to manage the yuan, such as raising the FX RRR to 9% in 2021 and adjusting it to 6% in Nov 2026.
| Period | Action | Purpose |
|---|---|---|
| September 2015 | Reserves on FX derivatives: 20% forwards and swaps, 10% options | Curb speculative activity under intense yuan pressure |
| 2017 | Counter-cyclical factor added to fixing | Reduce herd behaviour (suspended in 2020) |
| 2021 | FX RRR raised to 9% by December | Restrain rapid appreciation |
| September 2022 | FX RRR cut to 6%; forward risk reserve raised to 20% | Slow yuan weakness and outflows |
| September 2023 | FX RRR cut to 4% | Support dollar liquidity against weakness |
| November 2026 | FX RRR raised to 6% | Counter one-way gains |
The pattern runs in both directions. In 2021 the PBOC leaned against strength. In 2022 and 2023 it leaned against weakness, moderating a slide driven by Fed tightening, property troubles and a wide US-China yield gap rather than defending any fixed rate.
The motive is a policy tension. A stronger yuan lowers import costs and helps China’s push to internationalise the currency. It also squeezes exporters and invites complaints from trading partners.
The central bank’s no-devaluation pledge costs little while record surpluses already push the currency higher, so the fix and liquidity tools carry more information than official statements about intent.
This history tells you that a reserve ratio change has signalled an intent to smooth a move, not to reverse a trend. Even a move to 8% would fit that pattern.
What to watch before the yuan outlook for 2027 is settled
The evidence points to a central bank that resists fast, one-way gains while tolerating gradual ones. Surplus and conversion flows could still carry the yuan stronger, only more slowly.
Five indicators will show you which camp is right:
- The gap between the daily fixing and the market estimate
- Any move towards an 8% FX RRR
- Exporter conversion into year-end
- US jobs data and Fed signals
- The October CPI release scheduled for 9 November
Treat 6.60 as a line to test, not a certainty. If fixings keep leaning hard and the RRR climbs again, SocGen’s floor gains weight. If spot pushes through 6.60 despite them, the trade-flow camp has the stronger case.
This article is for informational purposes only and should not be considered financial advice. Investors should conduct their own research and consult with financial professionals before making investment decisions.