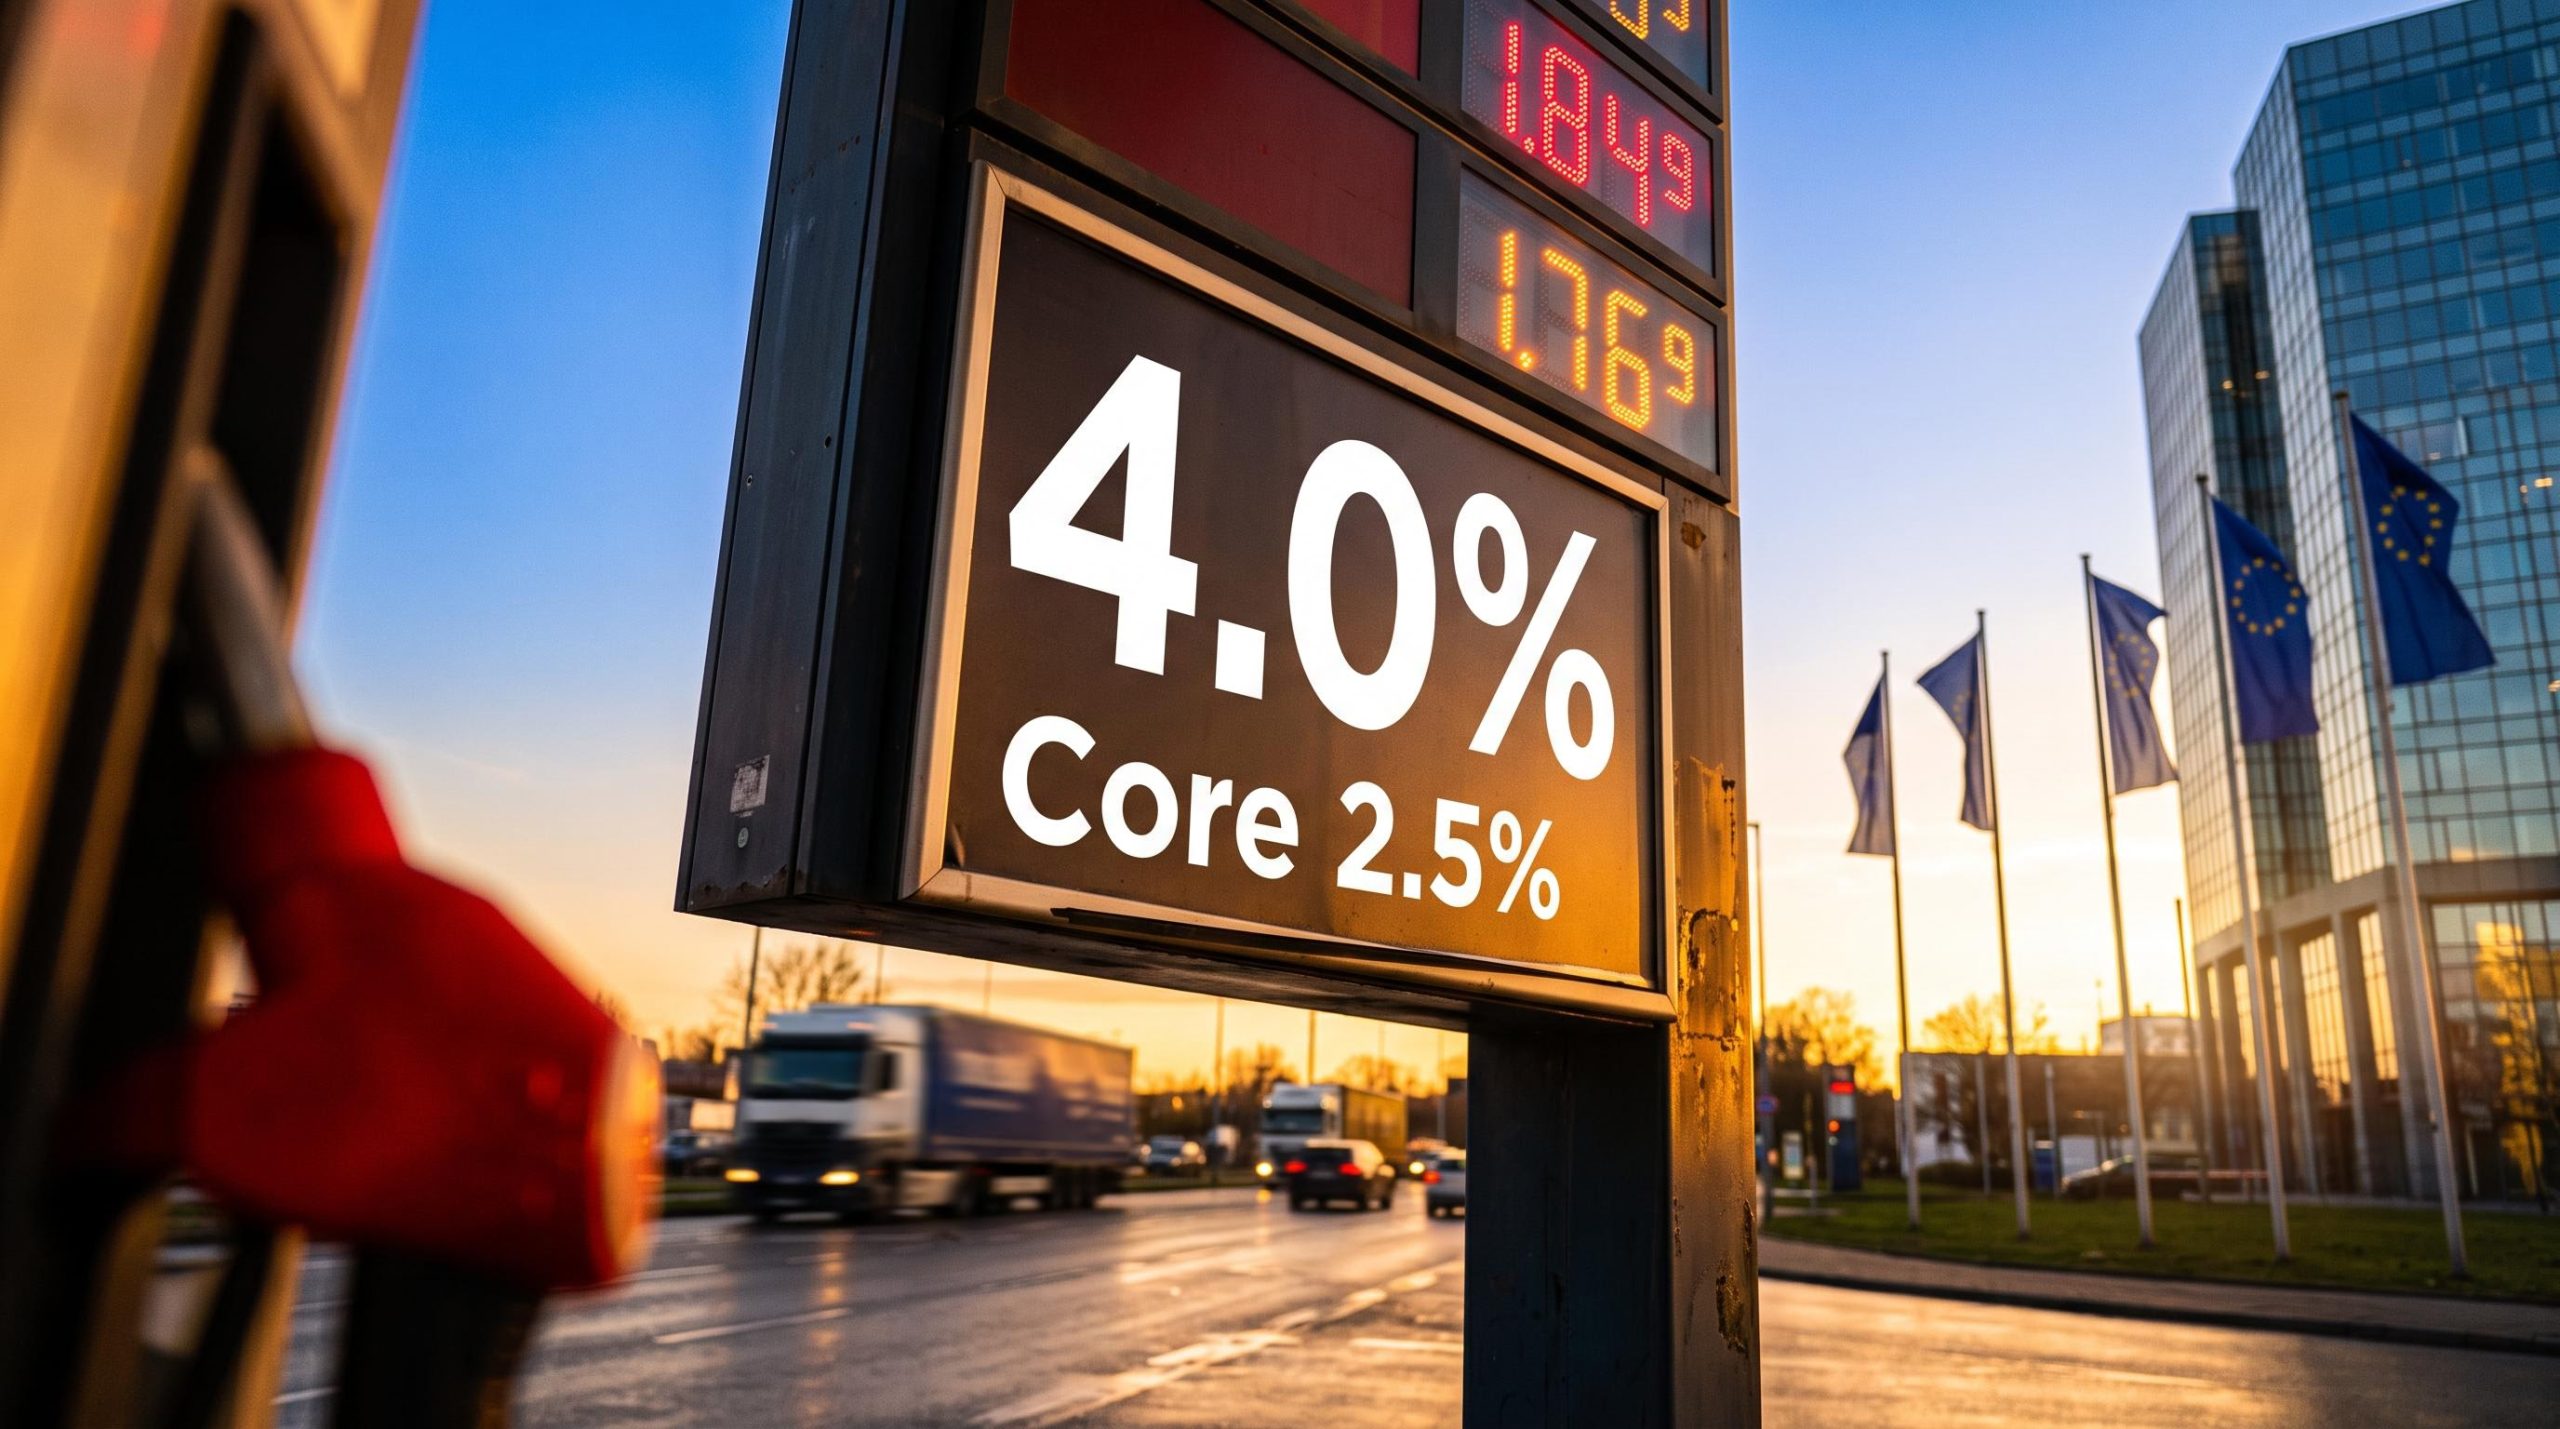
The headline says 4.0%. The core says 2.5%. That gap matters more than the number on the front page, because a three-year high in eurozone inflation does not automatically mean the 2022 surge is back.
Eurostat’s flash estimate for October, released on 4 November 2026, showed headline prices rising at their fastest pace since September 2023. Core inflation, which strips out the most volatile categories, did not move at all.
ABN AMRO responded on 5 November with a sober call. The Dutch bank expects inflation to keep climbing and stay high through 2027, but it also argues the tail of this episode should be shorter than the last one.
Here is how to tell energy noise apart from genuine persistence risk, and which indicators will decide what the European Central Bank (ECB) does next.
Why is eurozone inflation back at 4.0% when core is still 2.5%?
Start with the components, because they tell the story before anyone has to.
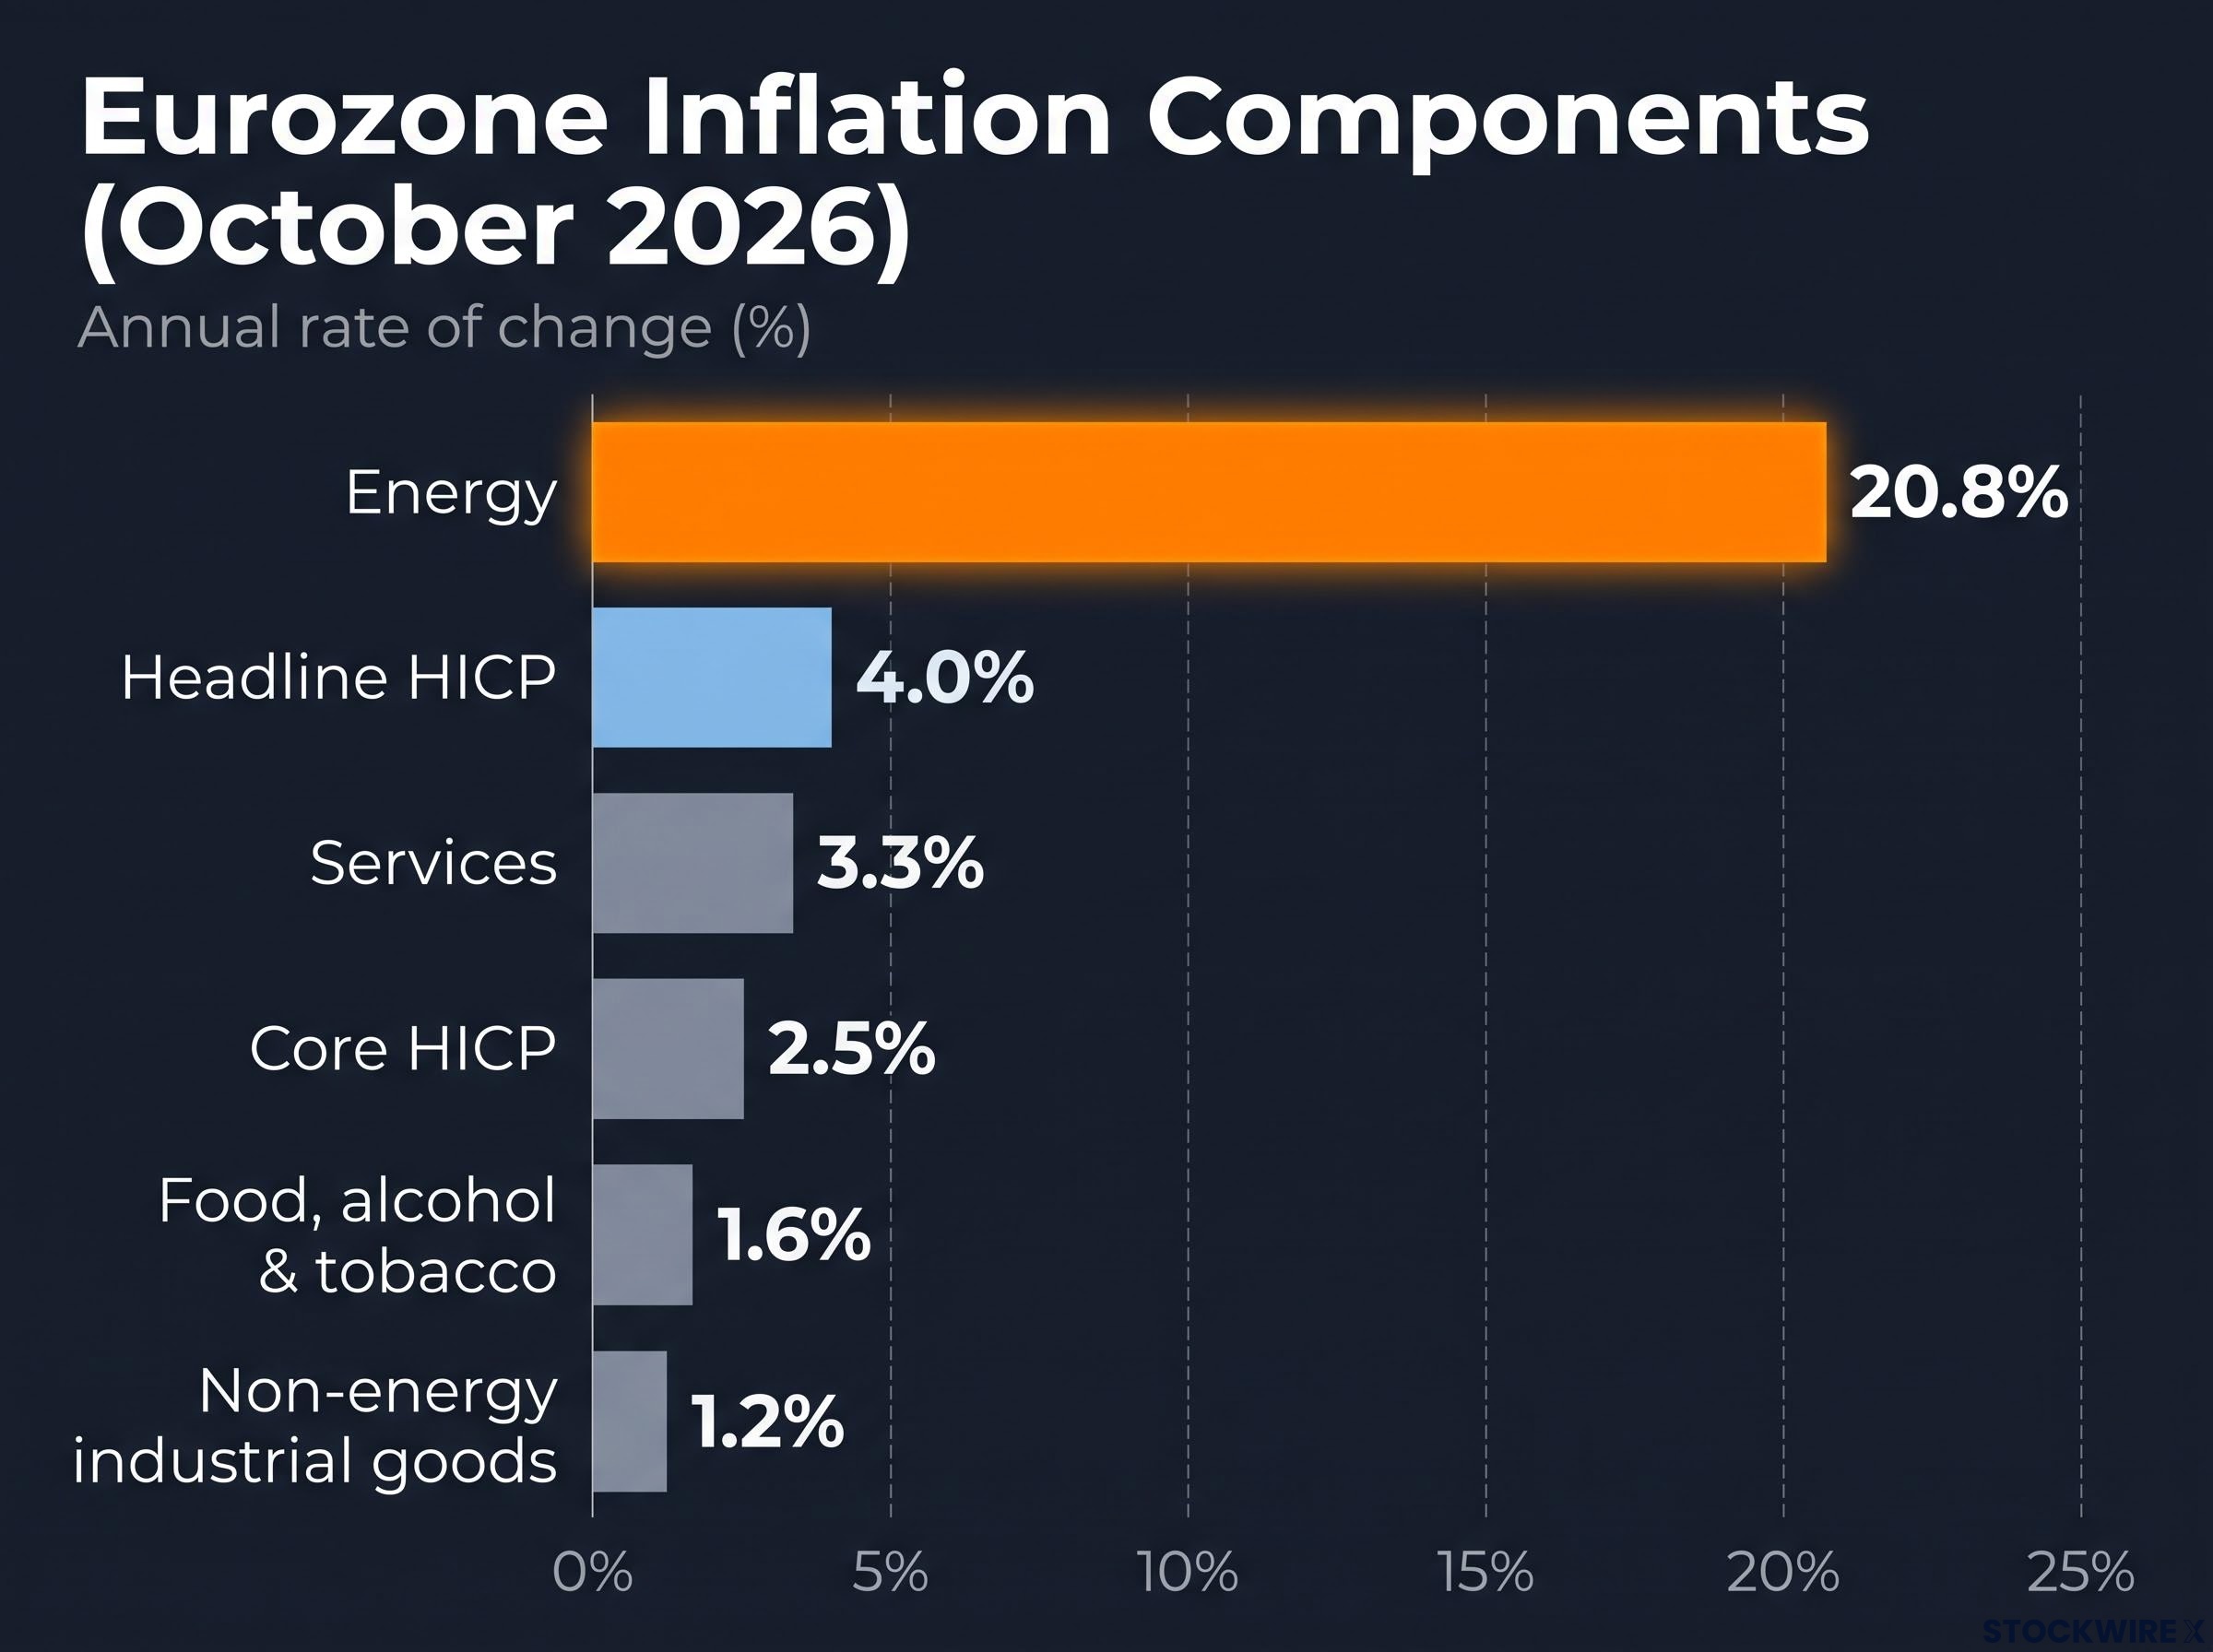
Energy prices surged 20.8% in October 2026, pulling Headline HICP to 4.0% while Core HICP remained at 2.5% and Services at 3.3%.
| Measure | October 2026 | September 2026 | Change |
|---|---|---|---|
| Headline HICP | 4.0% | 3.8% | +0.2 pts |
| Core HICP | 2.5% | 2.5% | Unchanged |
| Energy | 20.8% | 18.9% | +1.9 pts |
| Food, alcohol and tobacco | 1.6% | 1.3% | +0.3 pts |
| Services | 3.3% | 3.2% | +0.1 pts |
| Non-energy industrial goods | 1.2% | 1.1% | +0.1 pts |
One line stands apart. Energy prices are running at 20.8% a year, while every other category sits between 1.2% and 3.3%.
The arithmetic explains why a narrow category can drag the whole number upward. According to Euronews, energy carries a basket weight of roughly 9%, yet it contributed about 1.9 percentage points of the 4.0% headline. Strip that out and the picture looks far calmer.
Key statistic October’s 4.0% headline reading is the highest since September 2023, according to Eurostat’s flash estimate.
Reuters reported that both the headline and core figures matched its economist poll, so markets were not caught off guard. Eurostat itself flagged energy as the largest contributor by rate, while services remain the largest component of the basket.
That last point is why the small moves deserve attention. Services edging up to 3.3% and food rising to 1.6% are not proof of broadening, but they are the first places a spreading shock would show up.
For you, the takeaway is two-sided. If you hold euro-denominated assets or budget in euros, the headline overstates underlying price pressure today, yet it is the number that hits your energy and transport bills first.
When big ASX news breaks, our subscribers know first
Headline versus core inflation: what the gap tells you and how energy reaches everything else
Headline versus core in plain terms
Headline inflation, measured in Europe as the Harmonised Index of Consumer Prices (HICP), tracks the price change of everything in a typical household basket. Core inflation is the same measure excluding energy, food, alcohol and tobacco.
Central banks watch both for different reasons. Headline tells you what households are actually paying, while core shows the slower-moving pressure that interest rates can realistically influence.
When the two drift apart, as they have now, you are usually looking at a shock in the excluded categories. The real question is whether that gap closes because headline falls back, or because core catches up.
How an energy shock spreads into food and goods
Energy reaches the rest of the economy in stages:
- Energy costs rise. Households see it directly in utility, fuel and heating bills.
- Input costs follow. Energy-intensive agriculture, food processing, packaging, transport and logistics all become more expensive to run.
- Food and goods prices adjust. Firms pass those higher costs on to shoppers, often with a delay.
- Services and wages respond. If workers seek higher pay to keep up, the shock becomes embedded in domestic prices.
The ECB’s analysis of 2021-23 found that a strong demand recovery, combined with supply disruption, gave firms room to push input costs through to consumers. That combination turned an energy problem into a broad one.
The scale then was very different. Energy inflation hit 44.3% in March 2022, food reached 15.5% in March 2023, and headline peaked at 10.6% in October 2022.
Today’s episode starts from a much narrower gap: 4.0% against 2.5%. So when you see a headline spike, check the core line and the services line before assuming broad inflation, because those two tell you whether the shock is spreading.
A disciplined approach to reading eurozone inflation data starts with component weights and trend direction, so a single energy-driven print is judged against the core and services lines before it is treated as a regime change.
Will it last? ABN AMRO’s call on persistence, wages and expectations
ABN AMRO’s 5 November note puts a firm shape on the outlook. The bank expects inflation to rise above 4%, peak in early 2027 and stay high through that year, as food inflation and pipeline pressures partly offset a fading energy contribution.
Its earlier September scenario pencilled in 3.0% average inflation for 2026 and 2.7% for 2027, with no return to the 2% target before Q4 2027.
Forecasters do not agree on the peak: the forecast gap between Rabobank and the ECB is driven almost entirely by gas price assumptions, which shows how sensitive the 2027 path is to energy rather than to core demand.
So why does the same bank expect a shorter tail than in 2022-23? Its answer rests on a looser labour market and high interest rates, which together should keep inflation expectations anchored.
The data broadly supports that reading.
| Indicator | Latest figure | Source and date |
|---|---|---|
| Unemployment, September | 6.5% (6.3% a year earlier) | Eurostat, 30 Oct 2026 |
| Consumer expectations, 1 year ahead | 3.1% (from 3.0%) | ECB Consumer Expectations Survey, 23 Oct 2026 |
| Forecasters’ HICP view, 2026 / 2027 / 2028 | 3.0% / 2.6% / 2.0% | ECB Survey of Professional Forecasters, 30 Oct 2026 |
| Negotiated wage growth, 2026 | 2.3% (tracker); 2.8% (September table) | ECB, 4 Nov 2026 |
The wage numbers need a caution. The ECB’s own tracker shows 2.3% for 2026, its September table shows 2.8%, and the International Monetary Fund (IMF) expects about 2.6%. The figures disagree, but all of them sit well short of a spiral.
The major institutions line up closely on the present and split mainly on timing:
- ECB: Its 20 October assessment to the IMF’s steering committee said wages had not yet materially responded to the energy shock.
- Bank for International Settlements (BIS): It sees little evidence of second-round effects (price rises that feed into wages and then back into prices) but warns collective bargaining can delay wage responses by several quarters, into 2027 and beyond.
- IMF: It reports no signs of second-round effects so far and says long-term expectations remain anchored.
- ABN AMRO: It worries more about duration than an immediate wage-price spiral.
The wage and expectations lines are the ones that decide whether this stays an energy story. Track them over any single monthly headline.
What does 4% inflation mean for the ECB, bonds, equities and savers?
The ECB’s dilemma
On 29 October the ECB held its deposit rate at 2.50%, the main refinancing rate at 2.65% and the marginal lending rate at 2.90%. President Christine Lagarde said the Governing Council discussed a hike but unanimously judged that holding was the measured course.
The bind is real. Higher rates cannot create more energy or food supply, and tightening too hard risks hurting demand and jobs, yet waiting too long risks the shock seeping into wages, rents and services.
ABN AMRO sits on the hawkish side of that debate. It expects further tightening, though its October analysis suggested that rising bond yields and limited second-round evidence could slow the pace to roughly quarterly hikes.
Currency markets showed the euro reaction to the hold was driven by guidance rather than the rate itself, as Lagarde kept the bank meeting-by-meeting and left the December hike debate open.
Who gains and who is squeezed
| Asset or group | Likely effect | Why |
|---|---|---|
| Short and medium-term bonds | Yields up, prices down | Higher inflation and possible ECB hikes |
| Energy producers, cost pass-through firms | May outperform | Pricing power in a cost shock |
| Energy-intensive manufacturers, transport | Margin pressure | Input costs rise faster than prices |
| Long-duration growth stocks | Valuation pressure | Higher discount rates |
| Euro | Ambiguous | Hawkish ECB supports it; energy imports weaken terms of trade |
Savers face the bluntest maths. With inflation at 4% and the deposit rate at 2.50%, cash earns a negative real return unless rates climb above inflation.
Borrowers on variable rates face higher refinancing costs if the ECB moves, while fixed-rate borrowers are better shielded. Whether your exposure is a bond fund, an equity portfolio or a fixed-rate mortgage determines which side of this shock you sit on.
What to watch next as energy feeds through to wages and services
October’s 4.0% is an energy-led headline shock, not yet a broad core resurgence. The open question is whether wages and expectations stay contained as energy works into food, goods and services.
Five indicators will settle it:
- Services inflation, the cleanest read on domestic pressure.
- Negotiated wages, especially as new bargaining rounds land in 2027.
- Consumer expectations, now 3.1% one year ahead.
- Food inflation, the main channel ABN AMRO expects to keep headline elevated.
- ECB meeting signals, particularly any shift from holding to hiking.
Precedent cuts both ways. In 2022-23 headline fell faster than underlying pressure, while the 1970s show how a supply shock can propagate, without implying de-anchoring has occurred. If services and wages stay flat, the headline is likely to fade; if they start rising, the ECB’s hand is forced.
Data in this article is as of 6 November 2026. Past performance does not guarantee future results. Financial projections are subject to market conditions and various risk factors.
This article is for informational purposes only and should not be considered financial advice. Investors should conduct their own research and consult with financial professionals before making investment decisions.