
The New Zealand dollar edged higher on Wednesday 4 November 2026, even though the country’s unemployment rate had just climbed to 5.7%, its highest level in 11 years. The lift had little to do with New Zealand. A broad selloff in the US Dollar pushed the greenback to a one-month low, and the kiwi rose with it.
The bounce looks fragile. It followed a three-session slide that took NZD/USD down to near 0.5580 after the Reserve Bank of New Zealand (RBNZ) surprised markets by holding rates last week. Buyers showed little appetite to push the recovery further.
That leaves the near-term NZD/USD forecast pulled between a weakening dollar and a soft domestic economy. Here is what is lifting the pair, what is holding it back, and which US releases this week are most likely to decide its next move.
Why is the US Dollar falling while New Zealand’s jobs data disappoints?
On paper, Tuesday’s labour figures should have sunk the kiwi. Every major measure missed expectations.
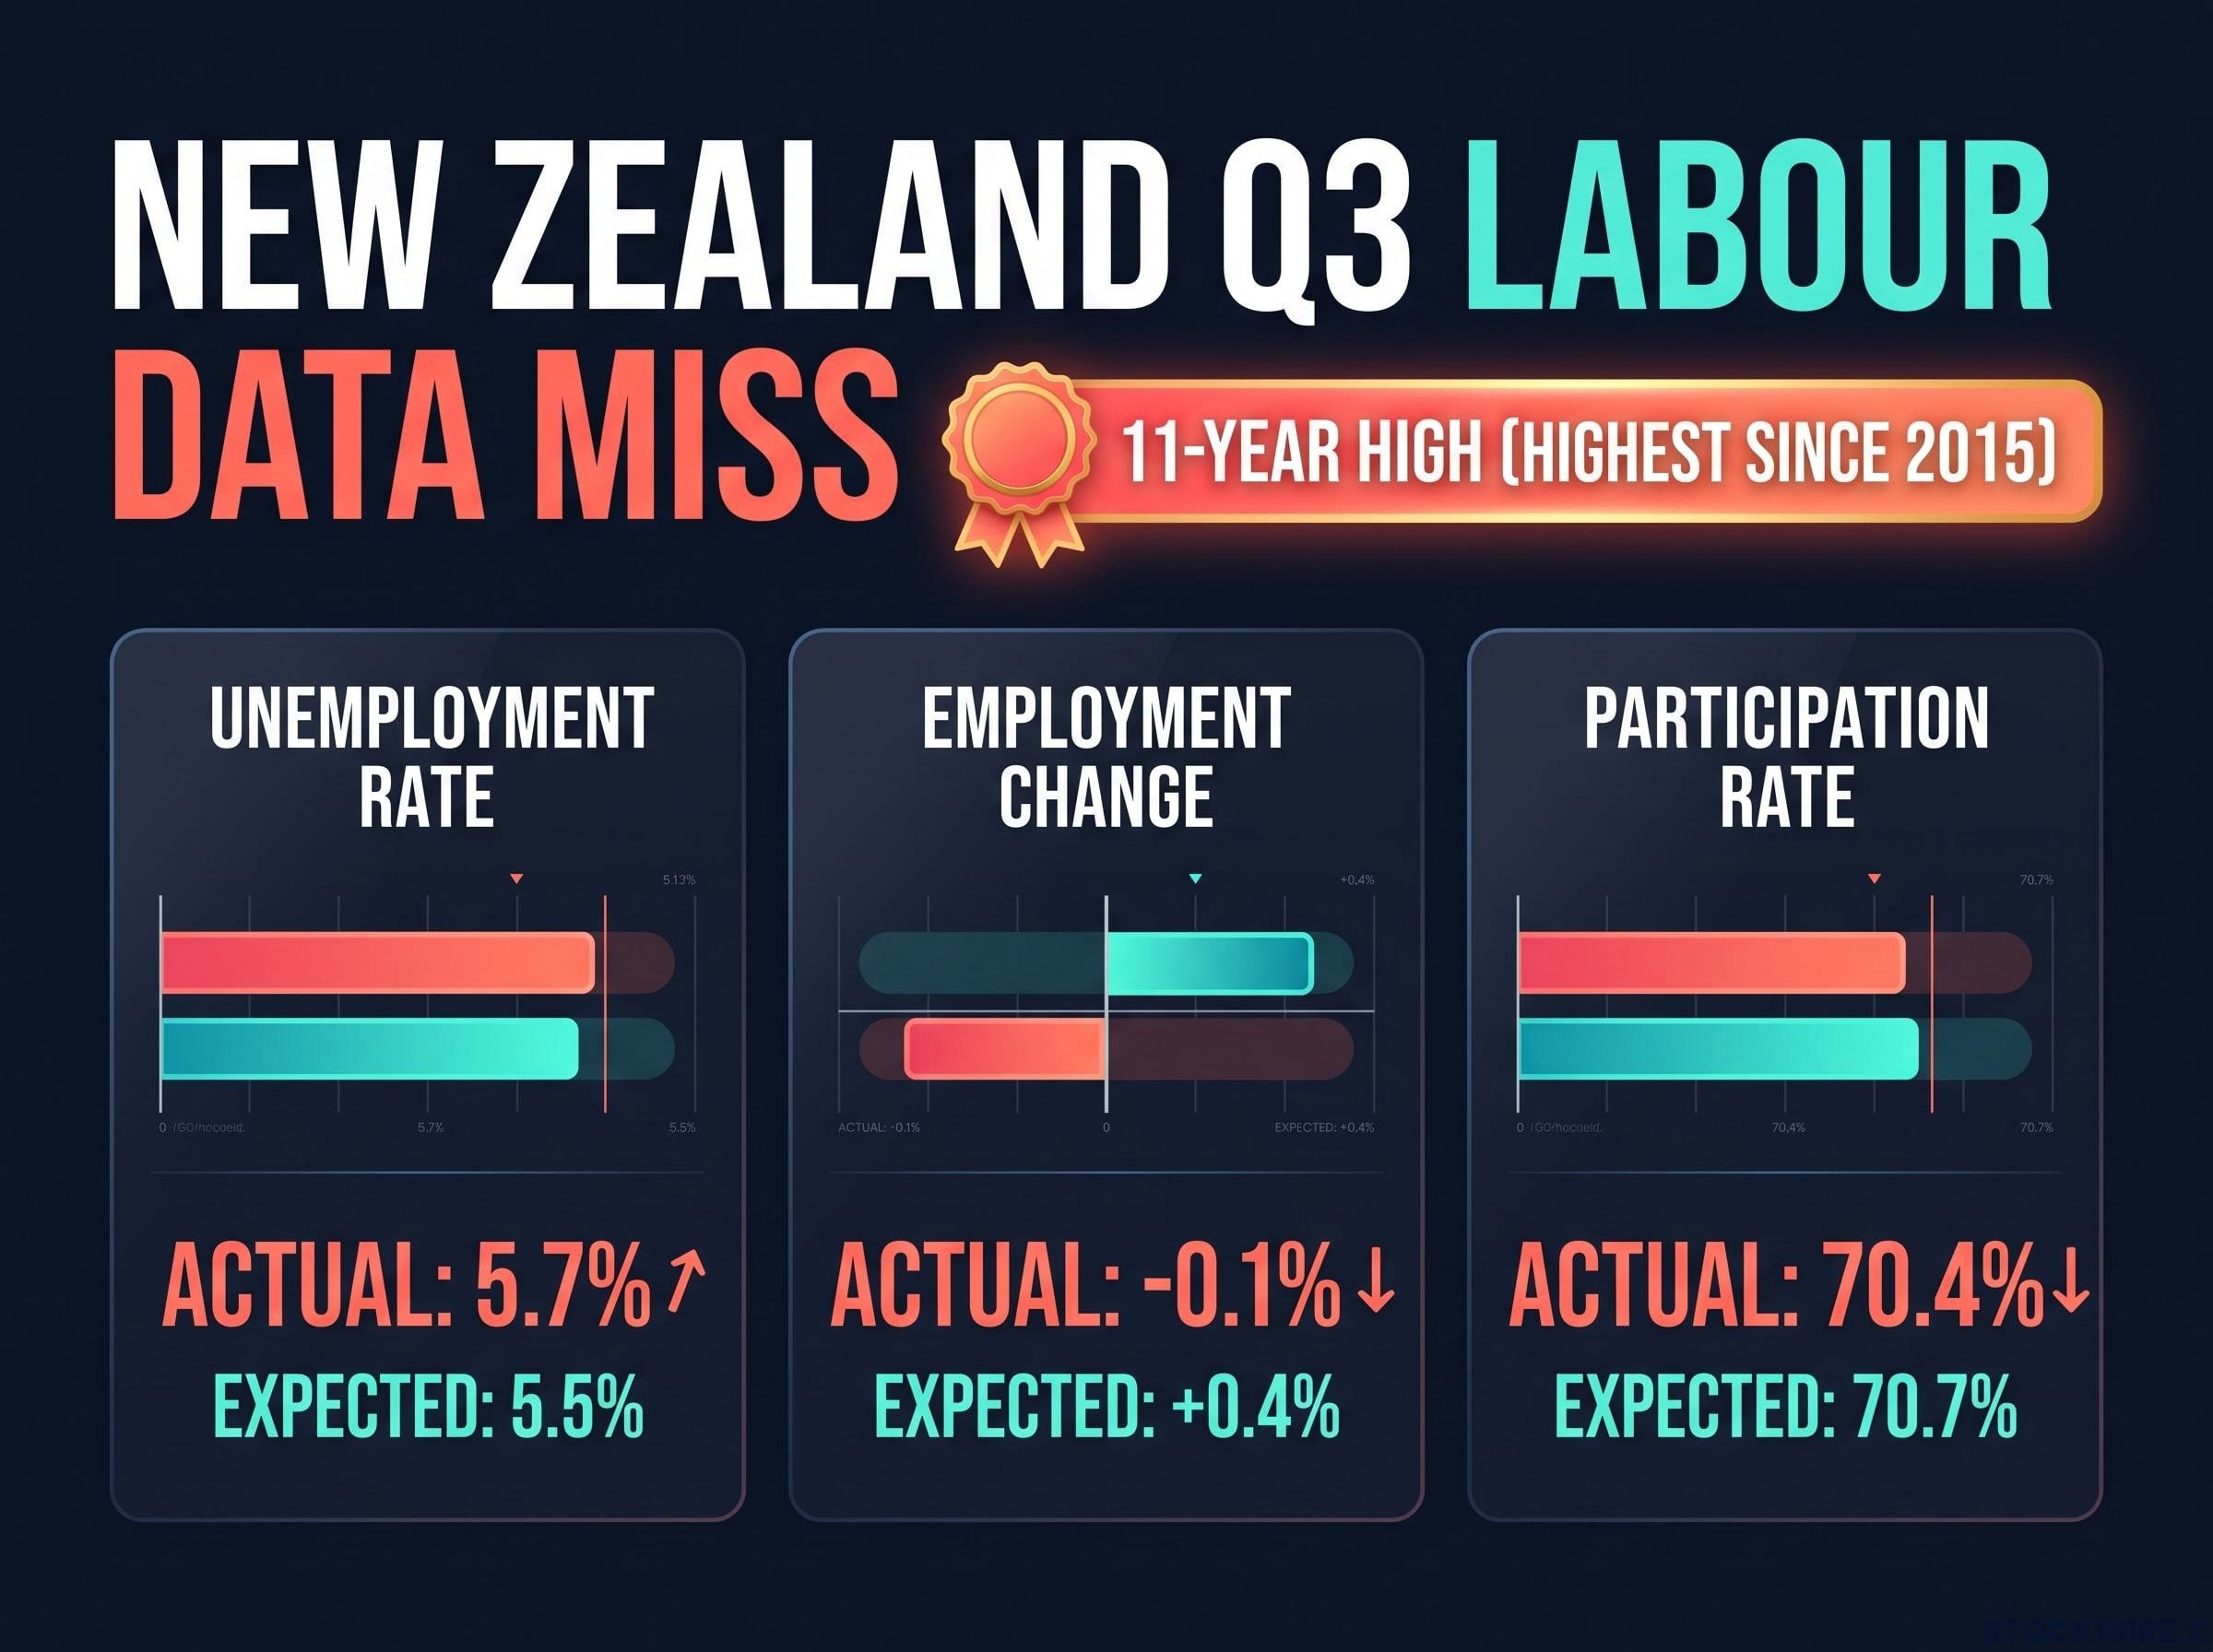
| Measure | Latest | Expected | Previous |
|---|---|---|---|
| Unemployment rate | 5.7% | 5.5% | 5.6% |
| Employment change (q/q) | -0.1% | +0.4% | +0.3% (revised) |
| Participation rate | 70.4% | 70.7% | 70.6% |
| Private labour costs excl. overtime | +0.4% q/q, +2.0% y/y | +0.5% q/q | 2.1% y/y |
11-year high New Zealand’s unemployment rate of 5.7% in Q3 is the highest since 2015, according to Statistics New Zealand.
The Stats NZ labour market statistics draw on the Household Labour Force Survey and the Labour Cost Index, the two datasets behind the unemployment and wage readings that the Reserve Bank of New Zealand weighs when judging how much slack the economy carries.
The dollar did the heavy lifting instead. The Dollar Index (DXY), which tracks the greenback against a basket of major currencies, fell to its lowest in more than a month, according to FXStreet’s Haresh Menghani. Three forces drove the selling:
- Midterm gridlock: Early vote tallies pointed to rising odds of a divided US government, which could restrict fiscal policy and erode the dollar’s yield premium.
- Lower Treasury yields: Gridlock fears sent money into US Treasuries, pushing yields down and making dollar assets less attractive.
- Iran diplomacy: Hopes for US-Iran talks reduced demand for the dollar as a safe haven and dragged oil prices lower.
A rally built on dollar weakness rather than kiwi strength can unwind as quickly as it formed. If those drivers fade, so does the support, so treat this move as a pause rather than a change of trend.
The chart sets a clear ceiling. FXStreet identifies resistance at the 50-day EMA (exponential moving average, a trend line weighted towards recent prices) near 0.5700, with the 200-day average just below 0.5800. Sellers are expected to appear on further gains.
Why do the RBNZ hold and China’s slowing services sector cap kiwi gains?
The first layer is policy. On 28 October, the RBNZ held its Official Cash Rate (OCR) at 2.75% by a 4-3 vote, even though markets had priced roughly a 93% chance of a hike to 3.00%. The Bank pointed to an “increasingly fragile” global economy.
The split inside the committee came down to whether a projected fuel-driven jump in fourth-quarter CPI is temporary or will spread into wages, and the 4-3 vote showed three members unwilling to wait to find out.
Yet the committee agreed tighter policy would probably be needed eventually. Markets still price December hike odds at roughly 75-80%, and New Zealand’s big banks read the decision as a postponement.
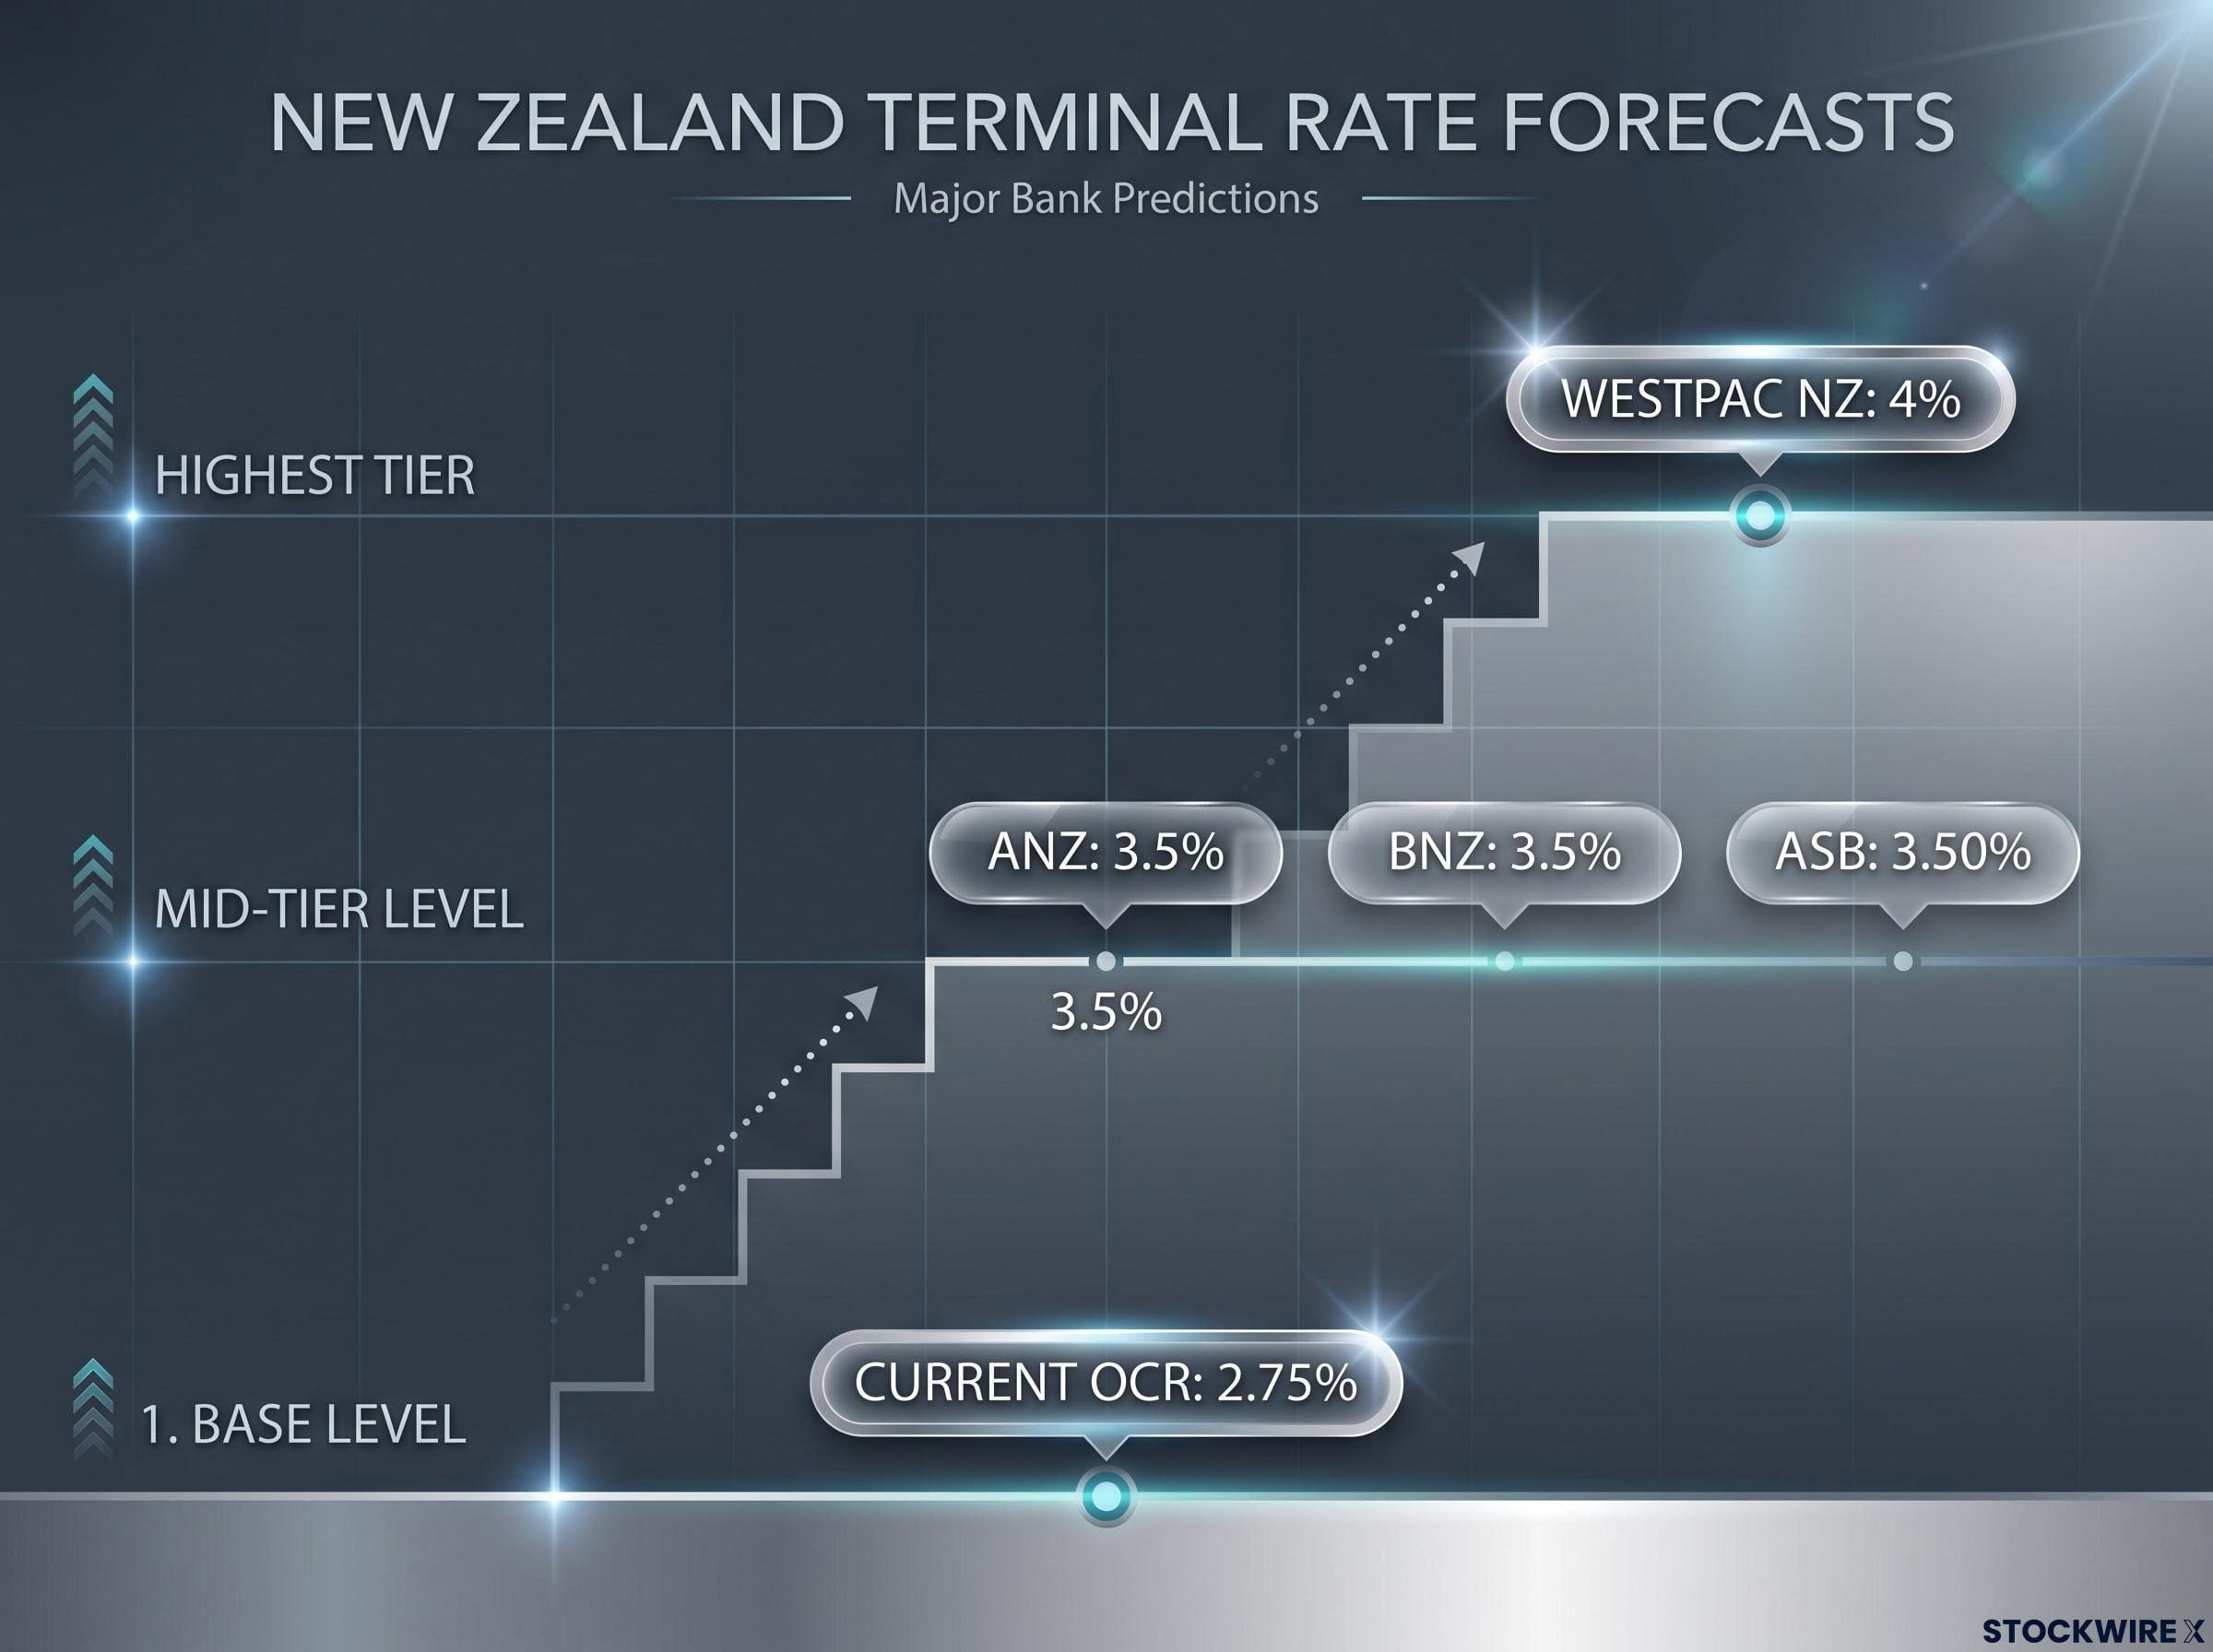
| Institution | Expected path | Terminal rate |
|---|---|---|
| ANZ (Sharon Zollner) | Hikes in December, February and March | 3.5% |
| BNZ (Stephen Toplis) | Consecutive hikes in December, February and March | 3.5% |
| ASB | Three 25bp increases, starting December | 3.50% |
| Westpac NZ (Kelly Eckhold) | Data-dependent December hike | 4% by September 2027 |
| Kiwibank | 25bp before year-end | Not specified |
The second layer is the Federal Reserve, which markets expect to hike in December because of energy-driven inflation risks. A Fed hike lifts US yields and pressures NZD/USD, while a priced RBNZ hike that fails to arrive weakens the kiwi. Last week delivered the second.
For you, the key point is that the debate is about speed, not direction. The kiwi’s fate depends on whether December data and fuel prices push the RBNZ towards the faster path.
What China’s services PMI adds to the picture
China, a major buyer of New Zealand exports, added a third layer. The RatingDog/S&P Global services PMI fell to 50.8 in October from 51.6, below the 51.7 forecast. The survey showed:
- The weakest reading since July
- Input prices rising at the fastest pace in five months
- Selling prices cut for a second straight month
- Weaker business confidence
Softer Chinese demand clouds the outlook for New Zealand’s exports, which caps the kiwi even on days when the dollar is falling.
Which US data releases could move NZD/USD next?
The week’s US baseline is already set. September’s JOLTS report, released on 3 November, beat expectations comfortably:
- Job openings: 7.523 million (consensus 7.15 million)
- Hires: 5.402 million
- Quits: 3.365 million
- Layoffs and discharges: 1.6 million
Reuters described the report as a sign that labour demand stayed firm despite weak job growth. Three more releases follow.
| Release | Timing | Consensus | What it measures |
|---|---|---|---|
| ADP employment (October) | Later Wednesday | +65,000 | Private-sector jobs estimate |
| ISM Services PMI (October) | Later Wednesday | 55.0 (some previews 54.8) | US services activity |
| Nonfarm payrolls (October) | Friday | +65,000 | Official US jobs count |
How to read the indicators
JOLTS (the Job Openings and Labor Turnover Survey) counts job openings, hires and departures to measure how much employers want workers. ADP estimates private-sector employment from its own client payroll data; it is a private indicator, not the official government report.
The ISM Services PMI and China’s services PMI are monthly business surveys. A reading above 50 signals expansion and below 50 signals contraction.
Strong US numbers would likely lift yields and the dollar, pressuring the pair, while weak numbers would support NZD/USD. The size of any reaction depends on how much of a December Fed hike is already priced. Check payrolls first: a clear beat would test the dollar’s slide, while a miss would give the kiwi room towards 0.5700.
For readers wanting to see why data reactions are so sharp, our full explainer on trading Fed hikes without forward guidance shows how inflation prints now drive rate expectations.
Reading the next move: levels and releases to watch
The kiwi’s bounce is a dollar story. Weak New Zealand labour data, softer Chinese demand and a widening gap between the Fed and the RBNZ continue to cap it.
The levels that matter are 0.5580 support, the 0.5700 50-day EMA and the 200-day average just below 0.5800. ADP and ISM Services arrive later today, with Friday’s payrolls the main test, followed by the RBNZ and Fed decisions in December.
Two risks cut across this setup. The dollar’s decline could reverse if geopolitical tension returns or US data outperform. Energy prices could also push the RBNZ either way, forcing a hike or deepening the slowdown. How the kiwi trades into December will hinge on which of those forces the data favours first.
This article is for informational purposes only and should not be considered financial advice. Investors should conduct their own research and consult with financial professionals before making investment decisions.