
An options-implied expected move looks like a fence on your trading screen, and plenty of range sellers treat it as one the market rarely climbs over. The data tells a messier story. According to the original source study’s reported findings, most futures contracts stayed inside their one-day expected range only about 71-82% of the time, which is a long way from near-certainty.
That gap matters because the number gets used every day. Traders who sell premium through strangles and iron condors often place short strikes at or near the expected move, so any error about how reliable it is flows straight into strike selection and risk.
The error also differs by market. Equity index futures behaved close to theory in the study. Metals, energy and crypto did not.
Here is what the evidence suggests about when the range holds, when it breaks, and how you can adjust the width for each asset before you sell your next strangle.
What does the study actually measure, and how is the expected range built?
Start with the figure your platform shows beside an options chain: a plus-or-minus dollar amount for the next expiry. Most traders read it as the market’s forecast. In practice it is a calculation, and the way it is built shapes how often prices land inside it.
Because every expected move is derived from implied volatility, extracted from live option prices rather than historical data, any shift in that input rescales the range your platform displays, which is why the same chain can show very different bands on consecutive days.
The study, which covered equity index, rates, metals, energy, FX and crypto futures, ran two tests. The first was containment, meaning the share of actual price moves that stayed inside the expected range. The second was share of range used, meaning how much of that expected move the market actually delivered.
Every result is judged against one benchmark. A one-standard-deviation range, which is one unit of typical price variation, should contain about 68% of outcomes under a normal distribution (the bell-curve model of returns).
The study’s range came from a rough approximation based on an implied volatility index, scaled to each horizon with the square-root-of-time rule. Under that rule, a VIX of 16 reads as a ±16% annualised one-sigma range, a weekly range is roughly VIX divided by √52, and a daily range is roughly VIX divided by √365 under Cboe’s calendar-day convention. Subsequent research could not trace the study to a named public publication.
| Method | How it is calculated | Typical use |
|---|---|---|
| VIX | Annualised 30-day expected standard deviation from a wide range of S&P 500 option prices | Equity index volatility gauge |
| Straddle | Price of an at-the-money call plus put with the same expiry | Platform expected-move displays |
| CME CVOL | Variance from the full implied volatility curve on futures options, time-weighted, annualised | Commodity volatility (crude 30 days, gold 60 days) |
| Study approximation | Implied volatility index scaled by square root of time | Cross-asset containment testing |
Why a straddle range and an index-based range differ
A straddle is a call and a put at the same strike and expiry, so it reflects pricing at one point on the chain. VIX and CVOL aggregate a broad strip of strikes. Both are annualised and scaled the same way, but they need not agree.
That is why you should treat the study’s percentages as directional evidence. Check your own platform’s straddle-based range before you copy any multiple from it.
When big ASX news breaks, our subscribers know first
How often do prices stay inside the range, and how much of it do they use?
With the measuring stick defined, the results build asset by asset. According to the source study, E-mini S&P 500 (ES) futures stayed inside the one-day range about 82% of the time, the highest among traditional contracts. Equity index futures as a group came in near 77%.
Rates and FX were generally favourable. Metals deviated the most. Bitcoin futures stood out at about 91% containment, which the study linked to implied volatility running hot.
Crude showed close to 100% containment, which looks like a data quality problem rather than a real result, and the study excluded it from the range-usage analysis.
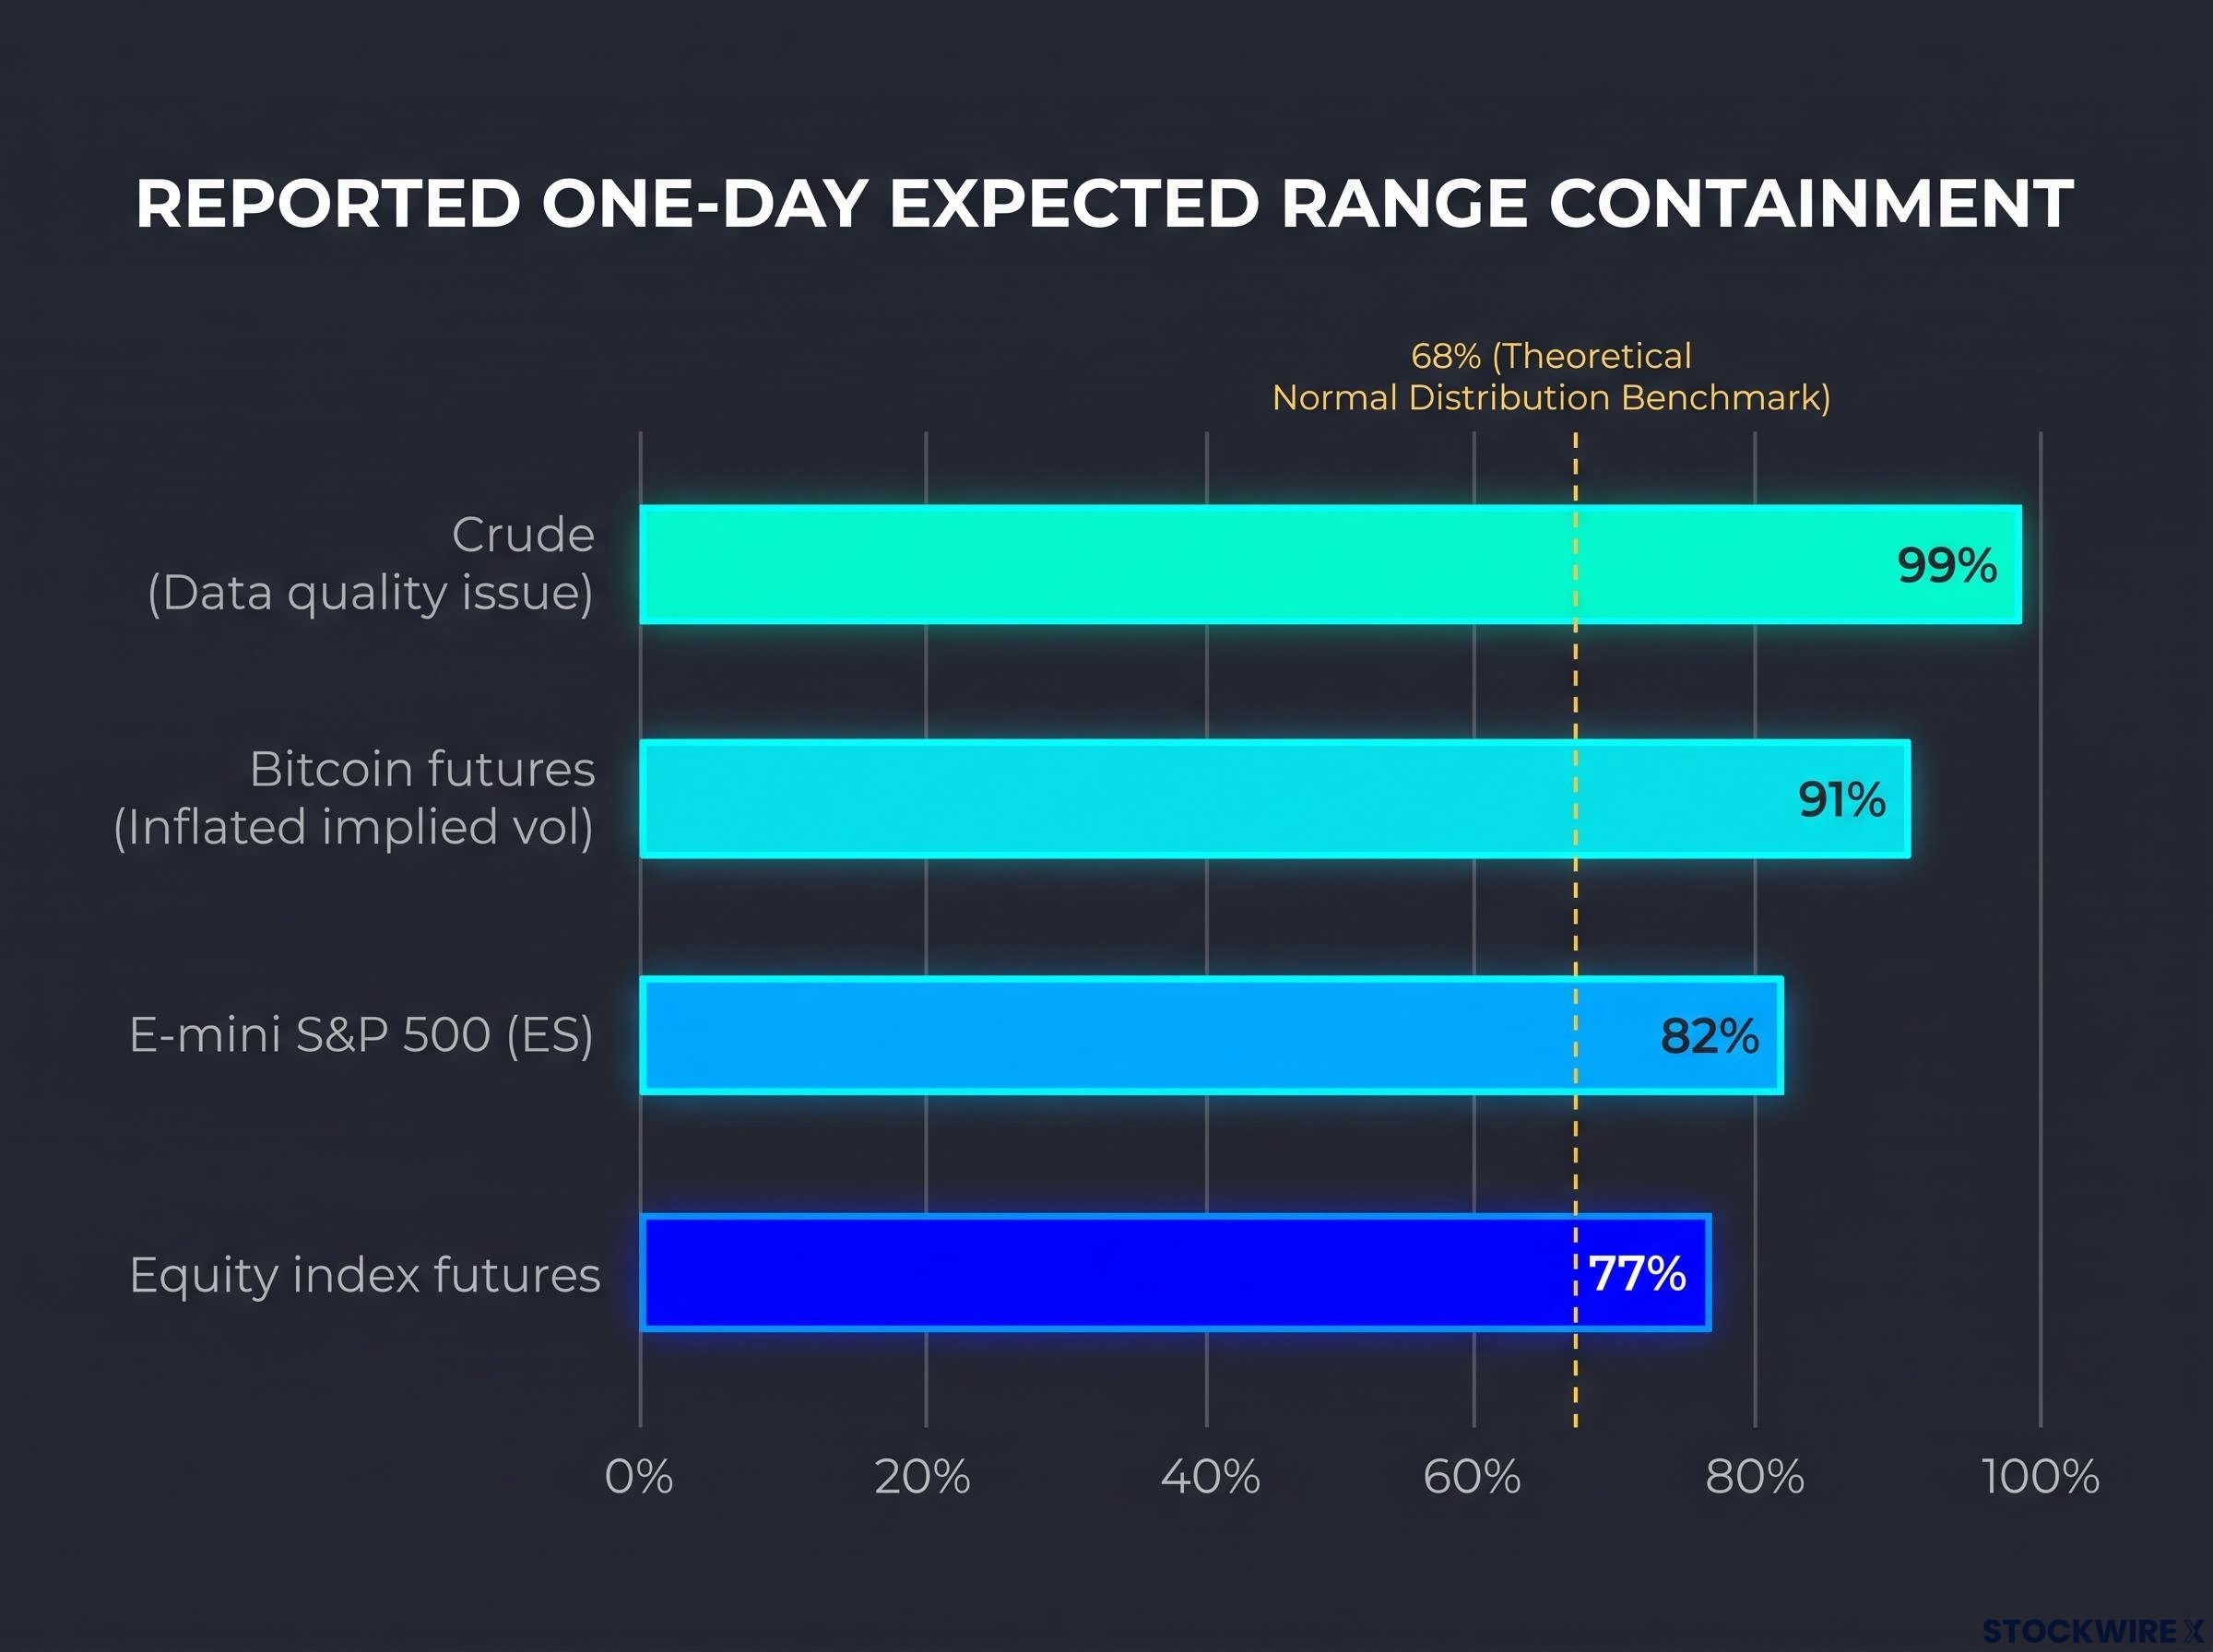
| Asset class | Reported one-day containment | Note |
|---|---|---|
| ES (S&P 500 futures) | ~82% | Highest among traditional contracts |
| Equity index futures | ~77% | Close to theoretical behaviour |
| Rates and FX | Not reported | Generally favourable |
| Metals | Not reported | Largest deviation |
| Bitcoin futures | ~91% | Possibly inflated implied volatility |
| Crude | Near 100% | Data quality issue, excluded from usage test |
Then comes the surprise. Markets did not just stay inside the range; they barely used it.
Realized moves averaged about 50-60% of the implied move (source study).
That fits independent evidence. Cboe states that S&P 500 implied volatility generally trades at a premium to subsequent realised volatility, and CME says the same of gold, partly because gold’s index uses a longer horizon.
For you, a range that over-contains and is under-used means short strikes at the expected move usually carry a cushion. The catch is that the cushion is already priced in, so the premium you collect is payment for risk, not free money.
Why does implied volatility usually overshoot, and where does that logic break?
The cushion has a name: the variance risk premium. This is the gap between the volatility options imply and the volatility that actually arrives. Sellers demand payment for jump, liquidity and adverse-selection risk, while buyers pay up for insurance that pays out when portfolios are under stress.
That premium is real, but it is not constant. It varies across four drivers:
- Asset class: equity indices price expensive downside insurance, commodities price shocks in both directions, FX reflects policy and funding risk, and crypto carries jump and liquidity risk.
- Regime: implied volatility usually rises faster than realised in fear episodes, but realised can overtake implied after an unexpected shock.
- Maturity: a mismatched horizon distorts any comparison.
- Tail exposure: skew and kurtosis (how lopsided and fat-tailed returns are) make a one-sigma range less informative than a normal model suggests.
The evidence is uneven too. A 2024 American Economic Association conference paper, which could not be independently confirmed, found significant premiums for most assets from 2006 to 2020, yet found the realised S&P 500 premium not statistically different from zero under its method.
Remember also that the expected move is a risk-neutral price that embeds skew and insurance demand, not a pure physical forecast. CME’s analysis found crude CVOL had a 0.429 correlation with next-day WTI move size, which tells you something about how big a move might be but nothing about its direction. Comparing a 30-day implied measure with one-day realised volatility is only valid when the two are horizon-matched.
What happened when the cushion disappeared in August 2024
On 5 August 2024, the VIX hit about 65 intraday and closed at 38.57, according to Reuters, as leveraged yen-funded carry trades unwound. Michael Purves of Tallbacken Capital Advisors pointed to forced covering by short-volatility traders.
The Bank for International Settlements (BIS) judged the spike larger than the usual S&P 500 and VIX relationship would imply, citing deleveraging, margin calls and forced options purchases. Crypto and other speculative assets were hit in the same episode.
The August 2024 episode also shows why VIX regimes matter: the spike was widely read as a liquidity and carry-trade event rather than a genuine macro repricing, and that distinction changes how any implied range should be trusted.
The lesson for you is direct. The cushion shrinks or vanishes in shock regimes, so a static expected-move assumption is weakest exactly when losses are largest.
How wide must the range be to capture 90% of moves, and why do metals, energy and crypto need more?
If the one-sigma range catches roughly three-quarters of moves, how far out must you go to catch nine in ten? According to the source study, the answer was about 1.3-1.8× the expected move, with ES needing about 1.3× and metals about 1.7-1.8×.
Longer horizons helped, but gains from one to five days were modest, particularly in ES and Russell 2000. At five days implied volatility still dominates; at 90 days the results would likely differ.
Breaches were mostly balanced, with a maximum gap of about 4 percentage points between upside and downside rates. Metals broke the pattern, with gold and silver breaching more often to the upside.

| Asset group | Reported multiple for ~90% capture | Main driver of tail width |
|---|---|---|
| ES (equity index) | ~1.3× | Deep liquidity, closest to theory |
| Overall range | 1.3-1.8× | Varies by contract |
| Metals | ~1.7-1.8× | Upside jumps, safe-haven demand |
The reason is tails, not averages. Commodity and crypto returns break from the bell curve in several ways:
- Fat tails: extreme moves arrive more often than a normal model predicts.
- Two-sided risk: oil can jump on supply disruption or fall on demand destruction.
- Jumps: overnight or event-driven gaps that continuous estimates understate.
- Geopolitical gaps: prices can lurch when a scenario resolves.
- Liquidation cascades: forced selling in leveraged futures and crypto.
Several of these research findings could not be independently confirmed. Bitcoin’s 91% containment looks like a contradiction, but it reflects inflated implied volatility, a separate issue from how wide its tails run.
No universal multiple has been verified. If you trade metals or energy with an equity index multiple, you risk placing short strikes where roughly one in five moves or more can land, so re-estimate it for each contract, horizon and regime.
What does this change for choosing strikes in range-selling trades?
The supporting view has merit. tastylive describes targeting one standard deviation for strangles and building iron condors that collect roughly one-third of strike width, with long wings capping the loss (both unconfirmed). It also notes that wider strikes raise the probability of profit but lower return on capital.
A simple credit-to-width calculation gives a quick estimate of probability of profit on a defined-risk spread, though it ignores how often short strikes are tested before expiry, which is where model benchmarks and real outcomes diverge.
The criticisms are just as concrete. A 68% figure is a model benchmark, not a guarantee; tail losses can outweigh many small winners; annualisation and scaling mistakes are common; and event risk arrives in jumps. SpotGamma’s point, also unconfirmed, sums it up: a condor fails when a short strike sits inside the range the market actually travels.
| Asset class | Suggested adjustment | Reason |
|---|---|---|
| Equity indices | Use range as baseline, cut size around events | Closest to theory |
| Energy | Wider wings, smaller size | Inventory, OPEC, war and weather jumps |
| Metals | Avoid symmetric strikes | Upside breaches more frequent |
| Crypto | More distance, defined risk | Jumps and liquidation cascades |
| Single stocks | Use earnings-implied moves and historical gaps | Idiosyncratic event risk |
Structure matters as much as width. Condors cap the loss but collect less premium; strangles collect more and have wider breakevens, but carry large theoretical losses unless hedged.
A four-step process ties it together:
- Choose your method: know whether your range comes from a straddle, VIX or CVOL.
- Apply an asset-specific multiple: start near 1.3× for liquid indices and widen for metals, energy and crypto.
- Check the event calendar: central bank meetings, inventory reports and earnings can turn a quiet range into a gap.
- Size to maximum loss: decide how much tail loss you can absorb, then choose between a condor and a strangle.
What the expected move tells you, and what to verify before relying on it
The weight of evidence points one way. Expected ranges usually contain most moves and are under-used, but containment shifts with asset, horizon and regime, and the tails, not the averages, decide your losses.
Before your next range trade, run through four checks:
- Which method produced your range?
- Does the horizon match your trade?
- Have you applied a multiple suited to the contract?
- What events sit inside the expiry window?
Keep the source in view. The cross-asset percentages and multipliers come from one study that could not be traced to a named publication, so test them against your own data before you build on them.
This article is for informational purposes only and should not be considered financial advice. Investors should conduct their own research and consult with financial professionals before making investment decisions.