EUR/USD is trading near 1.11-1.12, and OCBC thinks it could slip below 1.10 in the first half of 2027. The same bank also expects the dollar support behind that dip to fade in the second half. A headline that reads as “dollar strength ahead” is really a forecast with two legs, and the second leg points the other way.
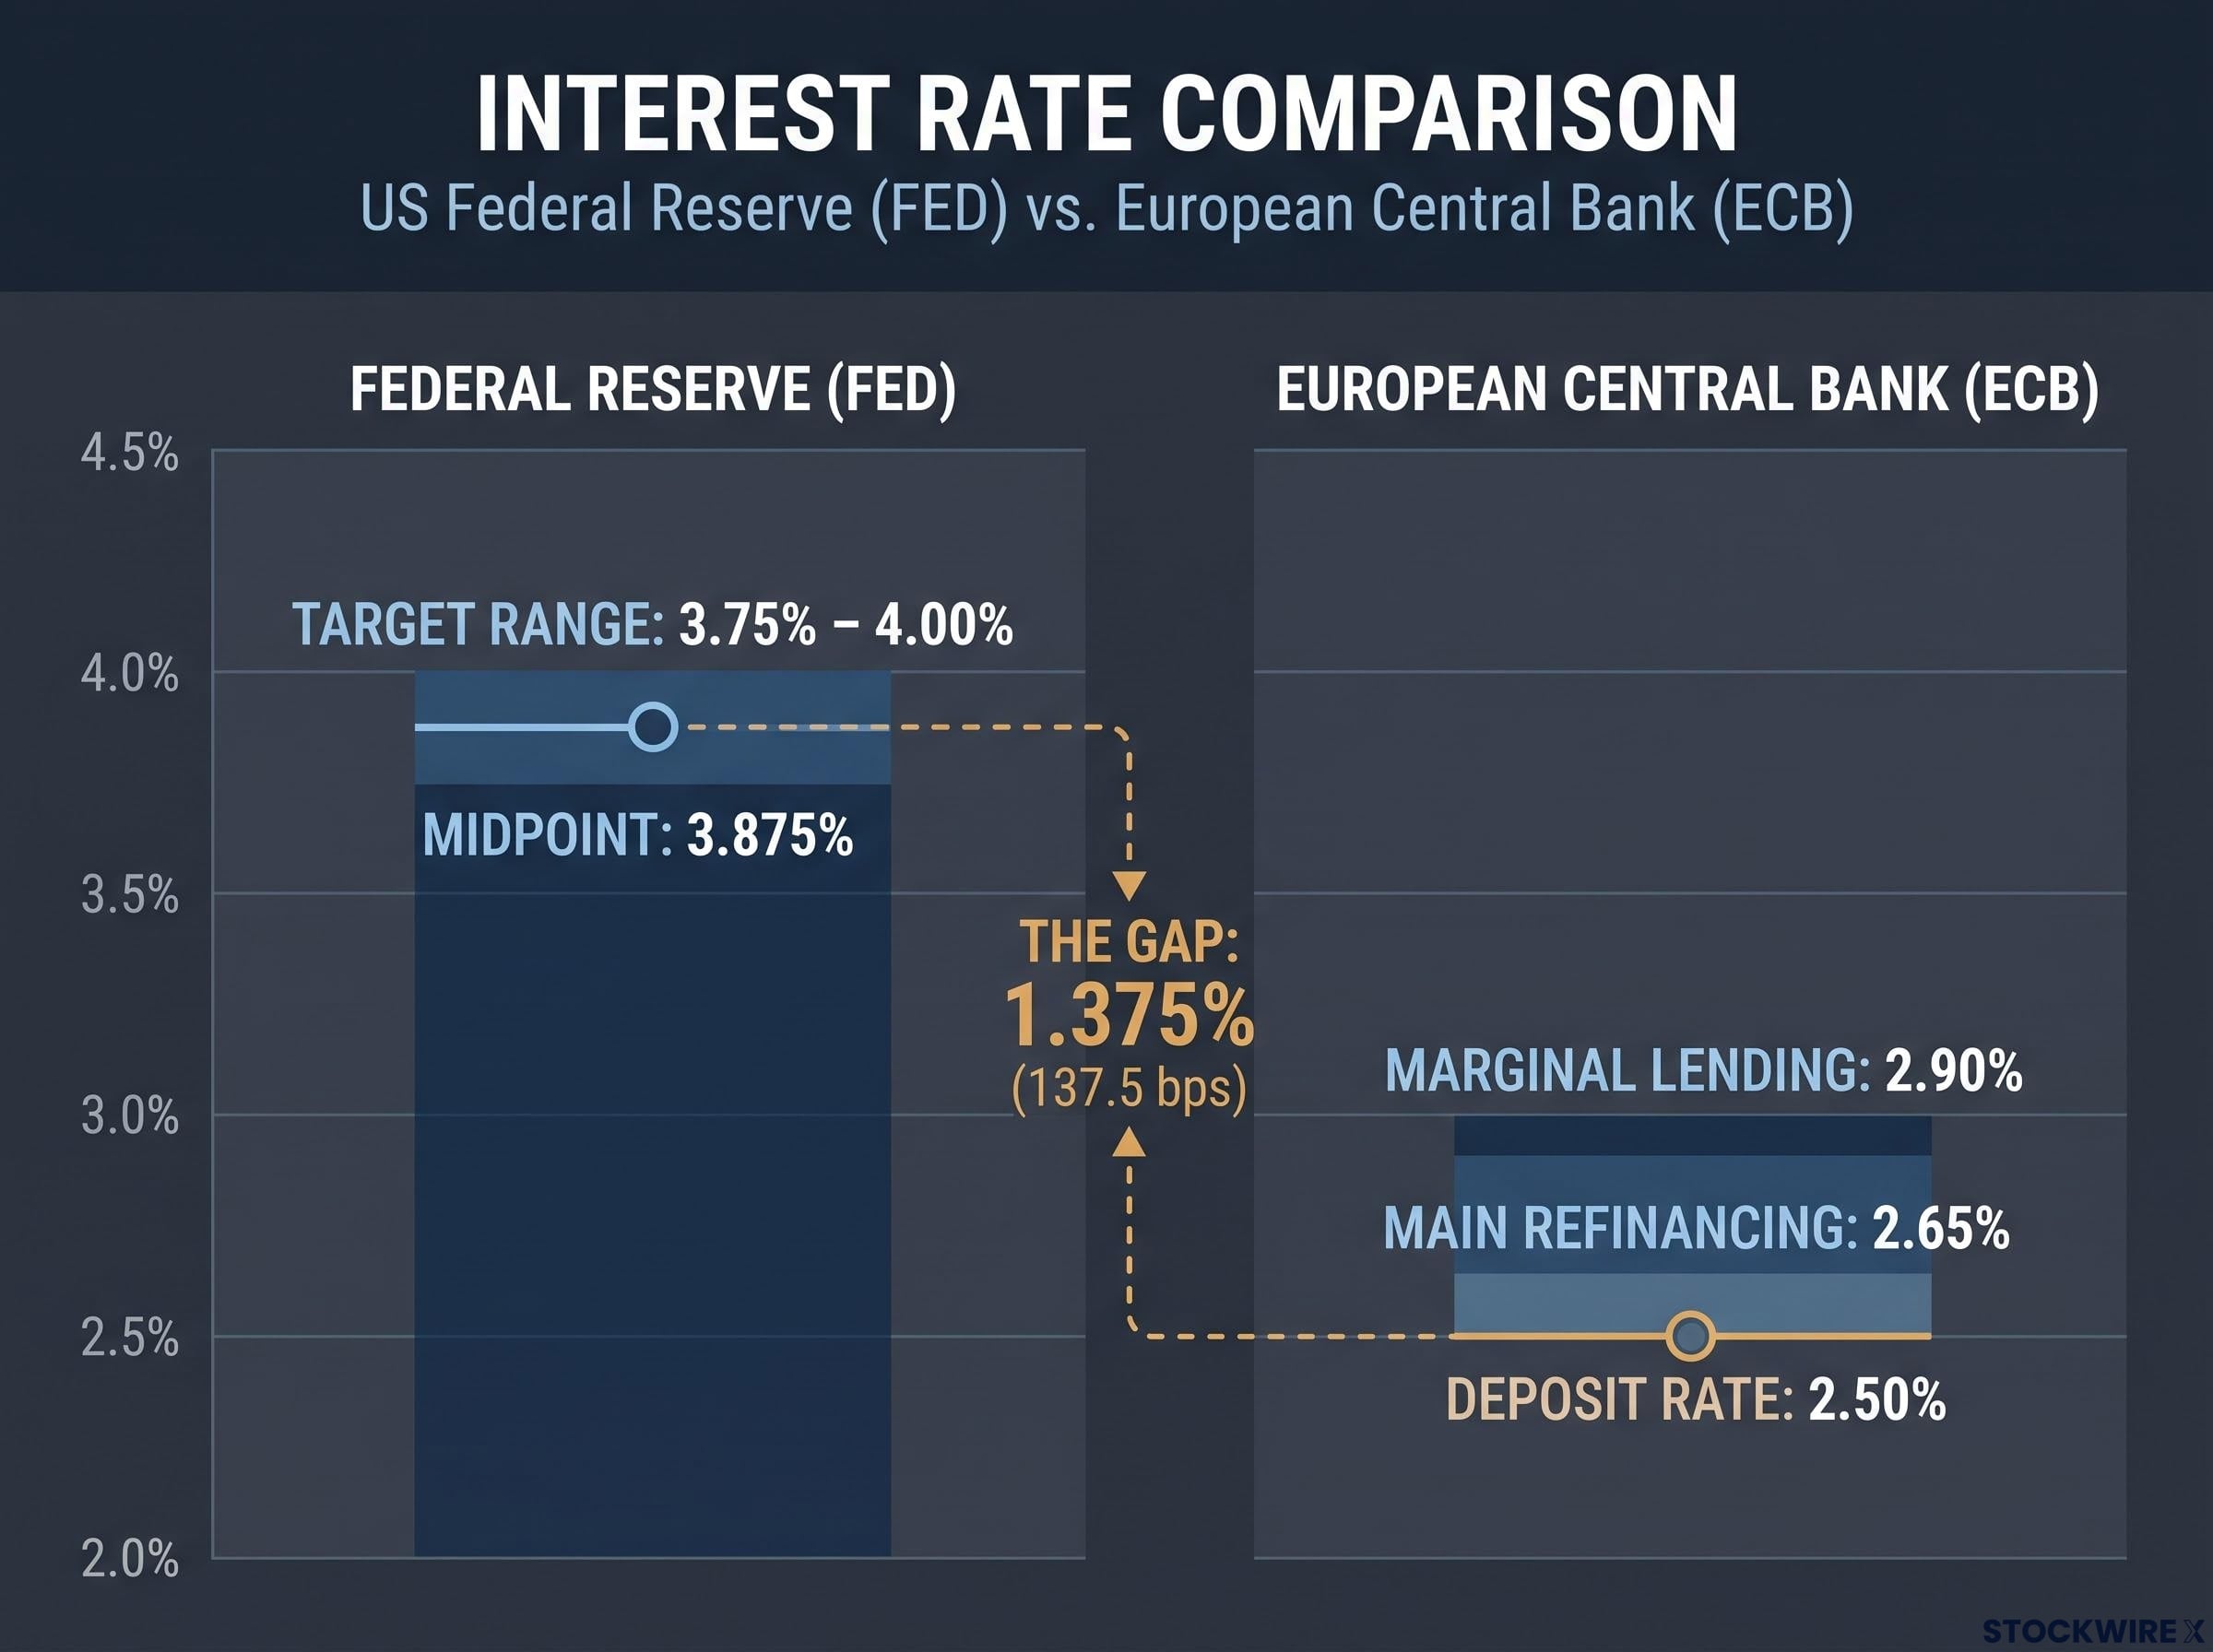
That split matters now because both central banks are at a decision point. The US Federal Reserve (Fed) held its target range at 3.75%-4.00% on 28 October, with two officials voting for a hike. The European Central Bank (ECB) kept its deposit rate at 2.50%, and markets are weighing December moves from both.
OCBC strategists Sim Moh Siong and Christopher Wong set out the view in an FXStreet report on 29 October 2026. They describe a U-shaped path: a drop first, then a recovery.
Here is a framework for reading that path through 2027: what is holding the dollar up, what is capping it, and which signals would turn the euro higher.
Why is the dollar stuck in a range despite strong support?
On 2 November, EUR/USD sat around 1.1120 and the US Dollar Index (DXY), which measures the dollar against a basket of major currencies, stood near 102.43, according to Upside. Neither figure suggests a currency in free fall or one breaking out.
OCBC’s core call is that the dollar stays generally well supported through 1H27, EUR/USD may dip below 1.10, and a rebound follows in 2H27. The bank’s full numerical forecast table has not appeared in accessible reporting, so the shape of the call is clearer than its exact levels.
The range exists because two strong forces pull in opposite directions. It reflects a tug of war, not a lack of conviction.
The AI channel
Artificial intelligence works on the dollar through two routes:
- Supportive: AI capital spending lifts US growth expectations, reduces hopes of Fed rate cuts, pushes up Treasury yields and draws capital into US tech shares and dollar assets.
- Opposing: A valuation shock in tech stocks would hit wealth and investment, prompting markets to price weaker growth and earlier Fed easing. Yields would fall and the dollar would lose part of its yield edge.
OCBC’s judgment AI is no longer a one-directional supportive trade for the dollar, yet betting on lasting USD weakness remains premature.
MUFG has also warned that a sharp deterioration in AI sentiment could hurt the dollar. There is a catch: a global liquidity crisis could first send investors rushing into dollar cash and Treasuries. For you, AI uncertainty means volatility rather than a trend, so a single tech-stock headline can push EUR/USD either way.
The energy channel
Costlier energy lifts US inflation and supports higher-for-longer rates, which favours the dollar. In the import-dependent euro area, it drags on the trade balance, spending power and growth.
That leaves the ECB with an awkward December choice. A hike would help the euro through higher yields but could deepen recession fears.
The ECB’s guidance, not the 2.50% rate itself, drove the euro to around 1.11 after the October meeting, because Lagarde kept the bank meeting-by-meeting and left the December hike debate open.
When big ASX news breaks, our subscribers know first
How do rate gaps and Fed doubts shape the path below 1.10?
The rate gap looks comfortable for the dollar. The Fed’s midpoint of 3.875% sits well above the ECB deposit rate of 2.50%, which gives dollar holders a carry advantage. Carry is the extra return earned by holding a currency with higher interest rates.
The interest rate differential between the Fed and the ECB matters less for where rates sit today than for where markets expect them to go next, which is why a single inflation surprise can move EUR/USD more than a decision already priced in.
| Central bank | Key rate setting | October decision | December focus |
|---|---|---|---|
| Fed | 3.75%-4.00% target range | Hold, two dissents for a 25 bp hike | About 80% priced for a hike (Reuters) |
| ECB | Deposit 2.50%, main refinancing 2.65%, marginal lending 2.90% | Hold, flagged energy-driven inflation risk | Possible hike under discussion |
The October Fed meeting was a hawkish pause. Lisa Cook and Beth Hammack dissented in favour of a 25 basis point hike (a basis point is one hundredth of a percentage point), and Reuters reported about 80% market pricing for a December hike.
The inflation data explains why. US September CPI rose 0.6% month on month and 3.7% year on year, while core inflation, which strips out food and energy, rose 0.3% and 2.6% respectively (Reuters, 14 October). ING reckons a December hike could pull EUR/USD towards its year lows near 1.11.
Then comes the doubt. If AI-related stress tightens financial conditions, markets may question how much further the Fed can go, pulling expected US rates and Treasury yields lower.
That would shrink the carry advantage even without a strong ECB. The read you should take from this is that the rate gap supports the dollar now, but whether markets believe the next hike is the last one matters more for 2027 than the hike itself.
What do Asian currency management and French fiscal risk add to the picture?
Rates explain the pressure. Two other actors explain the edges of the range: Asia puts a ceiling on the dollar, while France puts weight on the euro.
Asia caps the dollar
Firmer currency management in Asia reduces the defensive dollar buying that usually appears when regional currencies slide. The key actions so far:
- China: The People’s Bank of China (PBoC) set the yuan midpoint at 6.7146 per dollar on 2 November, slightly weaker than 6.7138, even as the offshore yuan hit a more than four-year high (SCMP).
- Japan: Tokyo spent about ¥15 trillion (~US$95bn) on intervention between 30 July and 26 August.
- Bank of Japan (BoJ): It held its policy rate at 1.25% on 30 October and left further hikes open.
OCBC’s language here is telling. It is firm on China’s management but hedges on Japan, referring to “possibly Japan.” These actions work as brakes on dollar strength, not reversals of it.
France weighs on the euro
Moody’s affirmed France at Aa3 but kept a negative outlook. The government projects a deficit of 5.4% of GDP in 2026, with a 5.0% target for 2027.
The OAT-Bund spread, the extra yield France pays over Germany to borrow for 10 years, reached about 176 bp on 23 October, the widest since November 2011. OCBC believes France’s negative rating outlook and unresolved budget concerns will hold back any durable rally in its bonds as the 2027 presidential vote approaches.
This tells you dollar upside against Asian currencies is managed, while the euro carries its own country-specific discount. That is why EUR/USD can weaken even when the broad DXY is capped.
How do other banks’ EUR/USD forecasts compare with OCBC’s U-shape?
| Institution | 2027 view | Key driver |
|---|---|---|
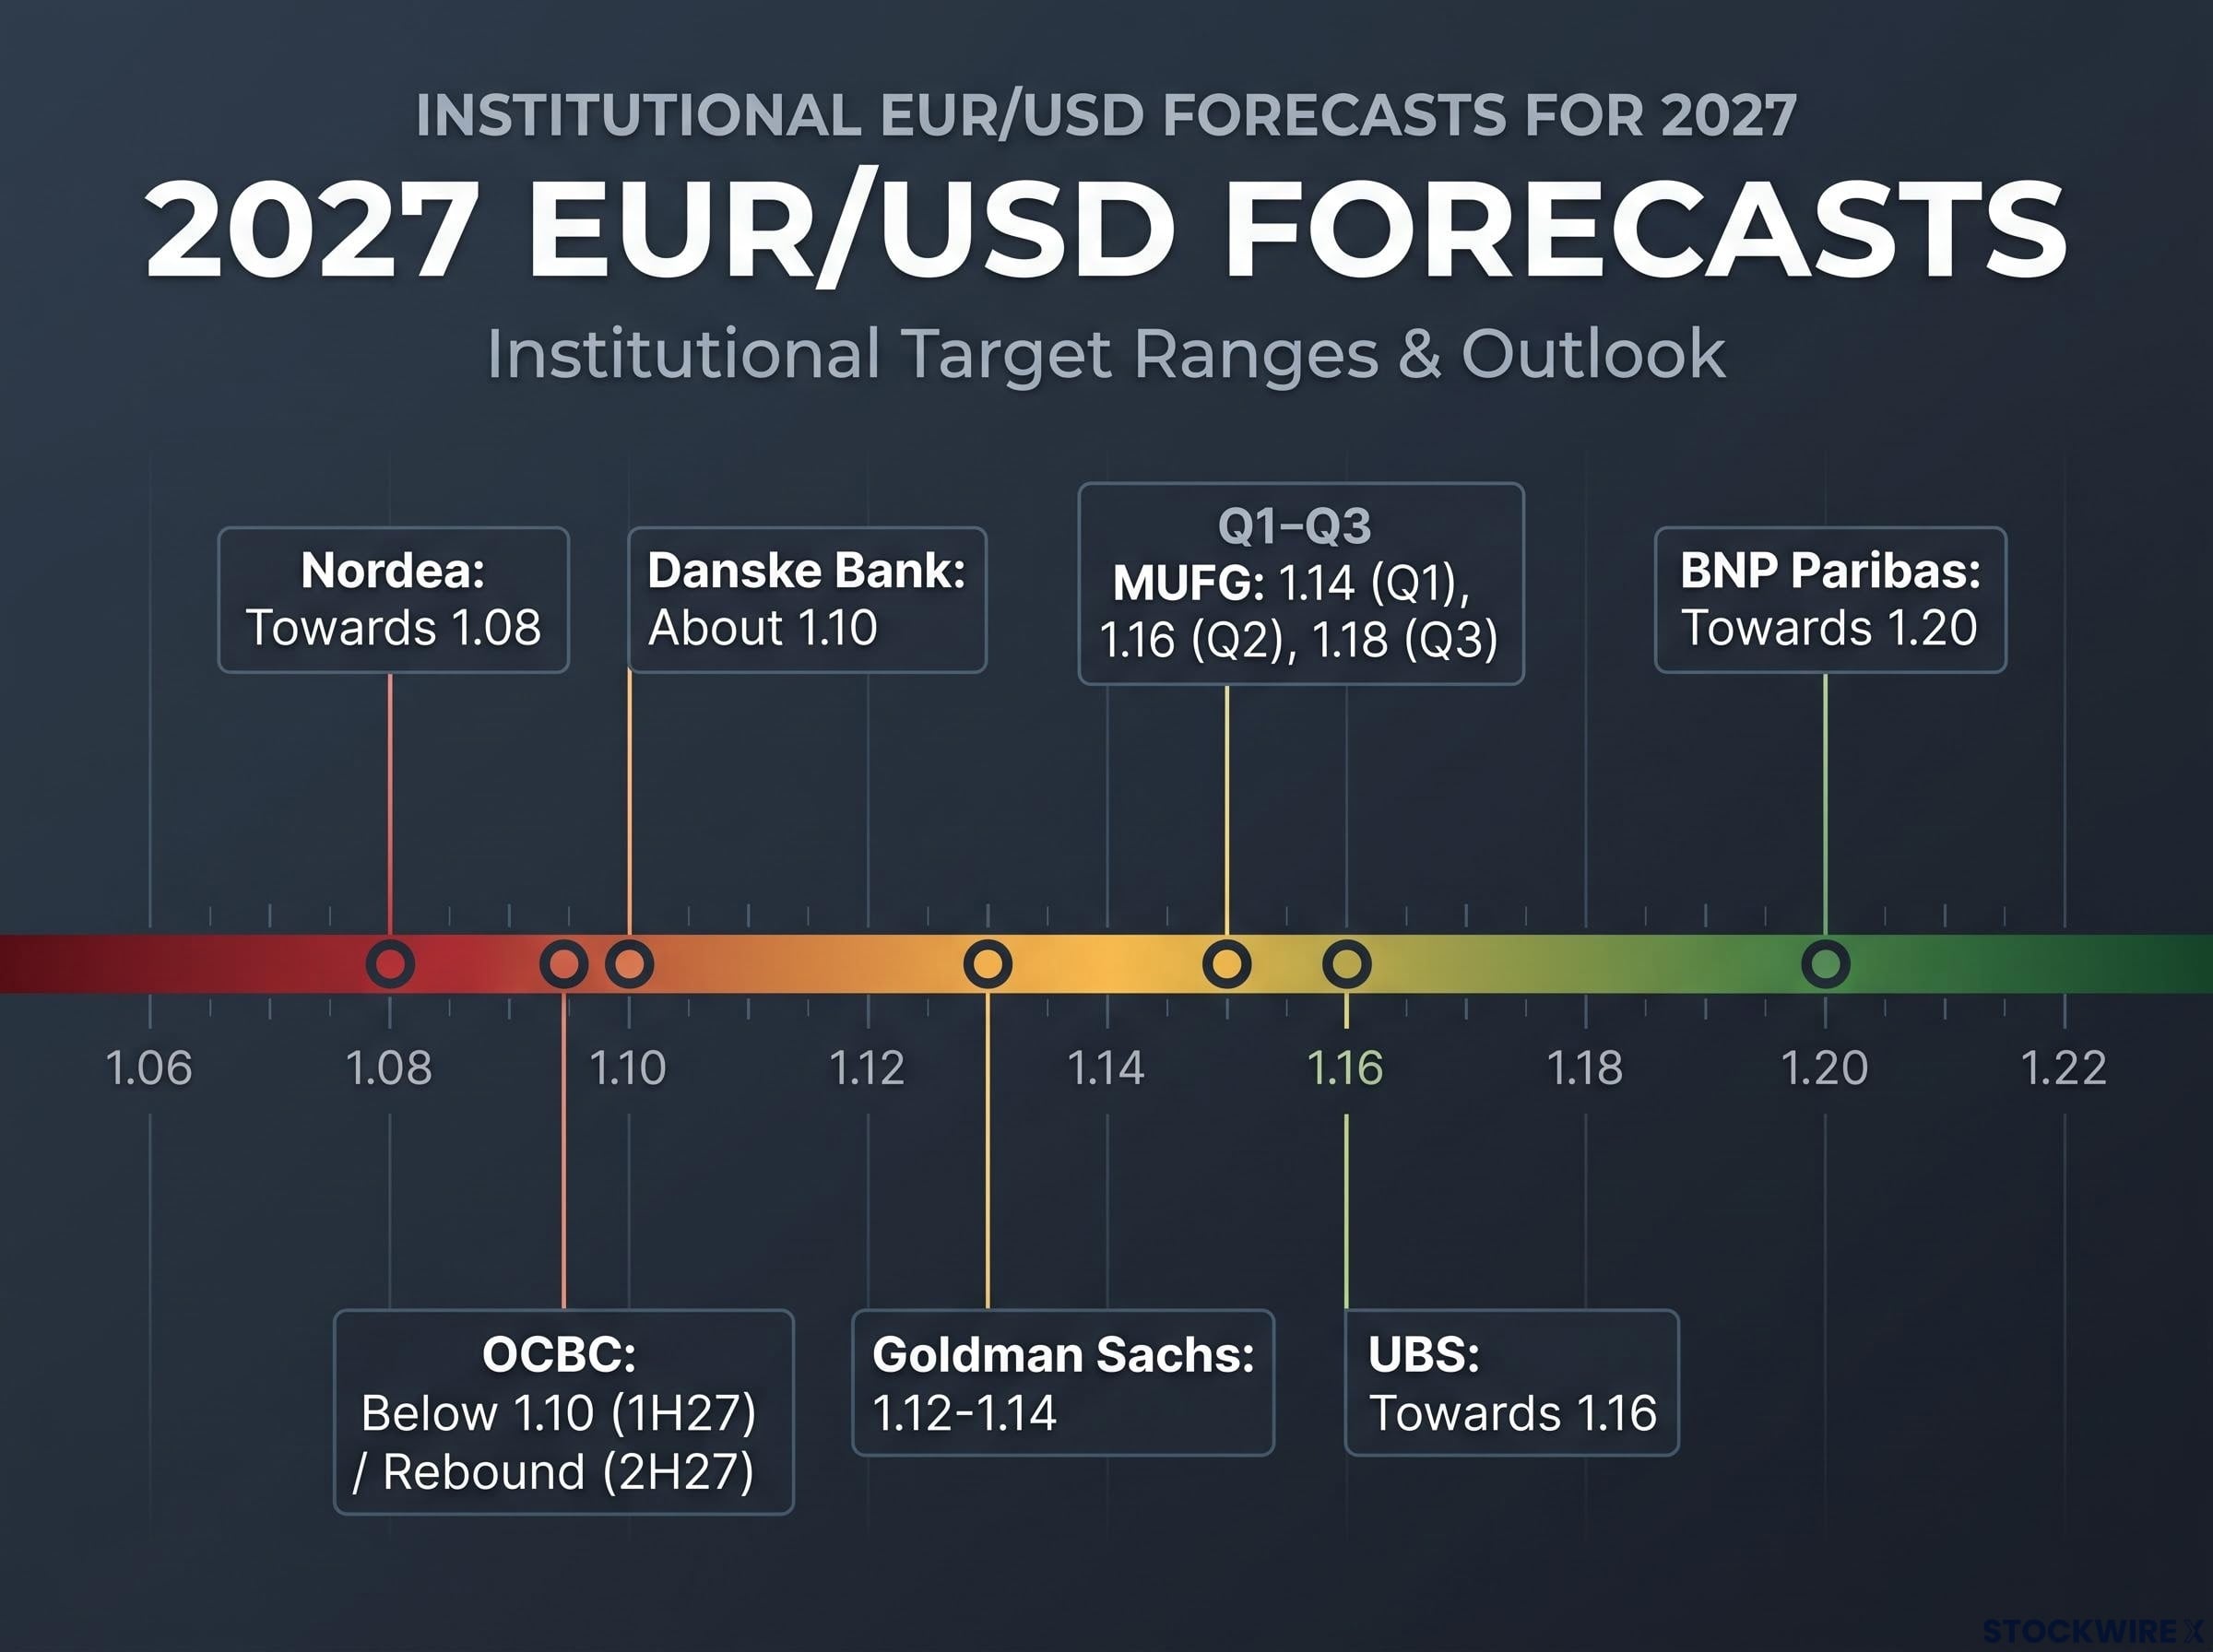
| Nordea | Towards 1.08 by mid-2027 | US rate advantage, French fiscal risk, dollar flows |
| Danske Bank | About 1.10 at 12 months | US rate advantage, European political and fiscal risk |
| OCBC | Below 1.10 in 1H27, rebound in 2H27 | Fading AI impulse, easing hawkish Fed risk |
| Goldman Sachs | 1.12-1.14 over the next year | Range-bound outlook |
| MUFG | 1.14 (Q1), 1.16 (Q2), 1.18 (Q3 2027) | Falling US yields as growth and inflation slow |
| UBS | Recovery towards 1.16 | Euro recovery scope |
| BNP Paribas | Towards about 1.20 by end-2027 | Structural dollar downtrend after temporary Fed support |
The table splits into two camps. Nordea and Danske Bank lean towards a lower-for-longer euro. MUFG, Goldman Sachs, UBS and BNP Paribas see a more meaningful recovery once US yields and Fed-hike pricing fall. MUFG pencils in 1.12 by the end of 2026 before its climb.
OCBC sits between them, accepting the sub-1.10 dip while expecting the rebound. On the euro’s rate support, Deutsche Bank and UniCredit see the ECB peaking around 2.75%, a modest lift.
The disagreement is about scale and timing, not direction. Still, a spread from 1.08 to 1.20 tells you any single EUR/USD forecast for 2027 carries wide uncertainty, so ranges deserve more of your attention than point estimates.
Fed credibility is another variable behind the spread of forecasts, since Commerzbank, for example, targets 1.18 for 2027 by arguing that political pressure on the central bank builds a slow structural discount on the dollar.
What history and risk scenarios say about a U-shaped path
A U-shaped path simply means a currency falls during a first phase, finds a floor and then recovers as the forces behind the fall weaken. Past cycles show this pattern is far from unusual:
- 2022 energy shock: EUR/USD fell towards parity amid the energy crisis and aggressive Fed tightening (Reuters), and the euro rebounded periodically as markets reassessed those risks.
- The early euro cycle: The euro dropped from about 1.17 after launch to about 0.82 in October 2002, then recovered as valuation and capital flows shifted.
- Japan’s 2026 interventions: The yen moved from about 160.7 to about 155 per dollar, but the broader trend proved hard to reverse.
The 2022 episode is the closest parallel to an energy- and policy-driven first leg down. Japan’s experience shows the limit of intervention: it slows a move rather than ending it unless rates or policy shift alongside it.
These risks could undercut the sub-1.10 view:
| Risk | Effect on EUR/USD |
|---|---|
| Fed easing after a final hike | Lower US yields cut the carry advantage and lift the pair |
| AI-driven US growth reversal | A tech correction weakens US growth expectations (MUFG) |
| ECB tightening | Hikes narrow the rate gap in the euro’s favour |
| French fiscal stabilisation | A narrower deficit could compress the OAT-Bund spread |
| US fiscal and political risk | Heavy issuance or Fed-independence worries could dent demand for dollar assets |
| Crowded long-dollar positioning | Small disappointments can trigger sharp reversals (Nordea) |
For you, these precedents suggest fiscal and energy shocks tend to be temporary drivers. A low in 1H27 would not, on its own, signal a lasting downtrend.
Reading the U-shape: what to watch before 2H27
Pulled together, OCBC’s case is that hawkish Fed risk, energy costs and French fiscal strain can push EUR/USD below 1.10 in 1H27. Once the boost from US AI-driven growth wanes and that hawkish risk recedes, the euro has space to climb again in 2H27.
To judge where in the U you are, watch which of these signposts flip:
- December Fed and ECB decisions, and whether a Fed hike is framed as the last
- Monthly US inflation prints
- AI equity sentiment
- The OAT-Bund spread
- The run-up to France’s 2027 presidential election
- PBoC yuan fixings
Treat this as a scenario framework rather than a guaranteed path. Past performance does not guarantee future results. Financial projections are subject to market conditions and various risk factors.
This article is for informational purposes only and should not be considered financial advice. Investors should conduct their own research and consult with financial professionals before making investment decisions.