Gold lost nearly 7% in October and slipped below $4,000 an ounce. Greg Weldon, a macro strategist and trader, says his own technical and quant models were “screaming sell” during the slide, yet he still plans to buy the dip.
Why would a trader who built his own algorithms override them? His answer starts with US government debt. Federal debt stood at about $40.6 trillion on 29 October 2026. Headline PCE inflation is running at 3.6% against a federal funds range of 3.75%-4.00%, and the 10-year Treasury yield touched 5.34% on 1 October.
Weldon’s thesis links debt, Federal Reserve (Fed) policy, the dollar and equity risk to a possible gold buying opportunity. This piece sets out how those links connect, which signals he treats as triggers, and where the argument is weakest.
These are one strategist’s opinions, not established fact or investment advice.
Why Weldon thinks the debt and inflation maths point toward the next QE
Weldon’s case begins with the size of the debt. He traces America’s reliance on credit back to 1971 and calls the result a “debt black hole”. He says quantitative easing (QE), the Fed’s practice of creating money to buy bonds, made it worse. QE ran in three rounds from 2008 to 2014 and returned in 2020.
Quantitative easing works through signaling, portfolio balance and liquidity channels, which is why a balance-sheet decision can move long-end yields and credit spreads in ways a quarter-point rate change cannot.
The official figures give that argument its raw material.
| Measure | Latest figure | Source and date |
|---|---|---|
| Total federal debt | $40.5936 trillion | Treasury Fiscal Data, 29 October 2026 |
| Debt held by the public | $32.71 trillion | Treasury Fiscal Data, 29 October 2026 |
| Headline CPI | 3.7% year on year | BLS, September 2026 data |
| Headline PCE | 3.6% year on year | BEA, September 2026 data |
| Core PCE | 3.1% year on year | BEA, September 2026 data |
| Fed funds target range | 3.75%-4.00% | Fed, 27-28 October 2026 meeting |
Line those numbers up and the margin is slim. The top of the funds range sits about 40 basis points above headline PCE, and the bottom sits only about 5 basis points above CPI. A basis point is one hundredth of a percentage point.
Interest costs add pressure. Kiel Institute economist Lena Dräger, citing preliminary Congressional Budget Office figures on 28 October, put US net interest at roughly $1.14 trillion in fiscal 2026, more than one fifth of federal revenue.
Weldon also argues inflation may climb further. He sees producer price inflation (PPI), the prices businesses pay, moving through raw, intermediate and final demand toward consumer prices. He says intermediate PPI is running at double-digit rates and that 41% of 83 service-sector inflation indicators sit above 4% year on year.
For you, the logic runs like this. If policy rates barely clear inflation, the Fed is not truly restraining the economy, and pushing much harder risks breaking a system that owes this much.
How Warsh’s framework fits Weldon’s critique
The Fed has not stood still. It raised rates by 25 basis points in September, and markets priced about 84.6% odds of a December hike after the September inflation data, according to Reuters.
Weldon calls that insufficient. He argues that Fed chair Kevin Warsh’s framework, built on R-star (the neutral interest rate) and long-run average targeting without tolerance bands, lets inflation run well above 2%. He suggests rates may need to approach 5%, and he says Warsh’s habit of offering little forward guidance leaves the Fed’s credibility in doubt.
When big ASX news breaks, our subscribers know first
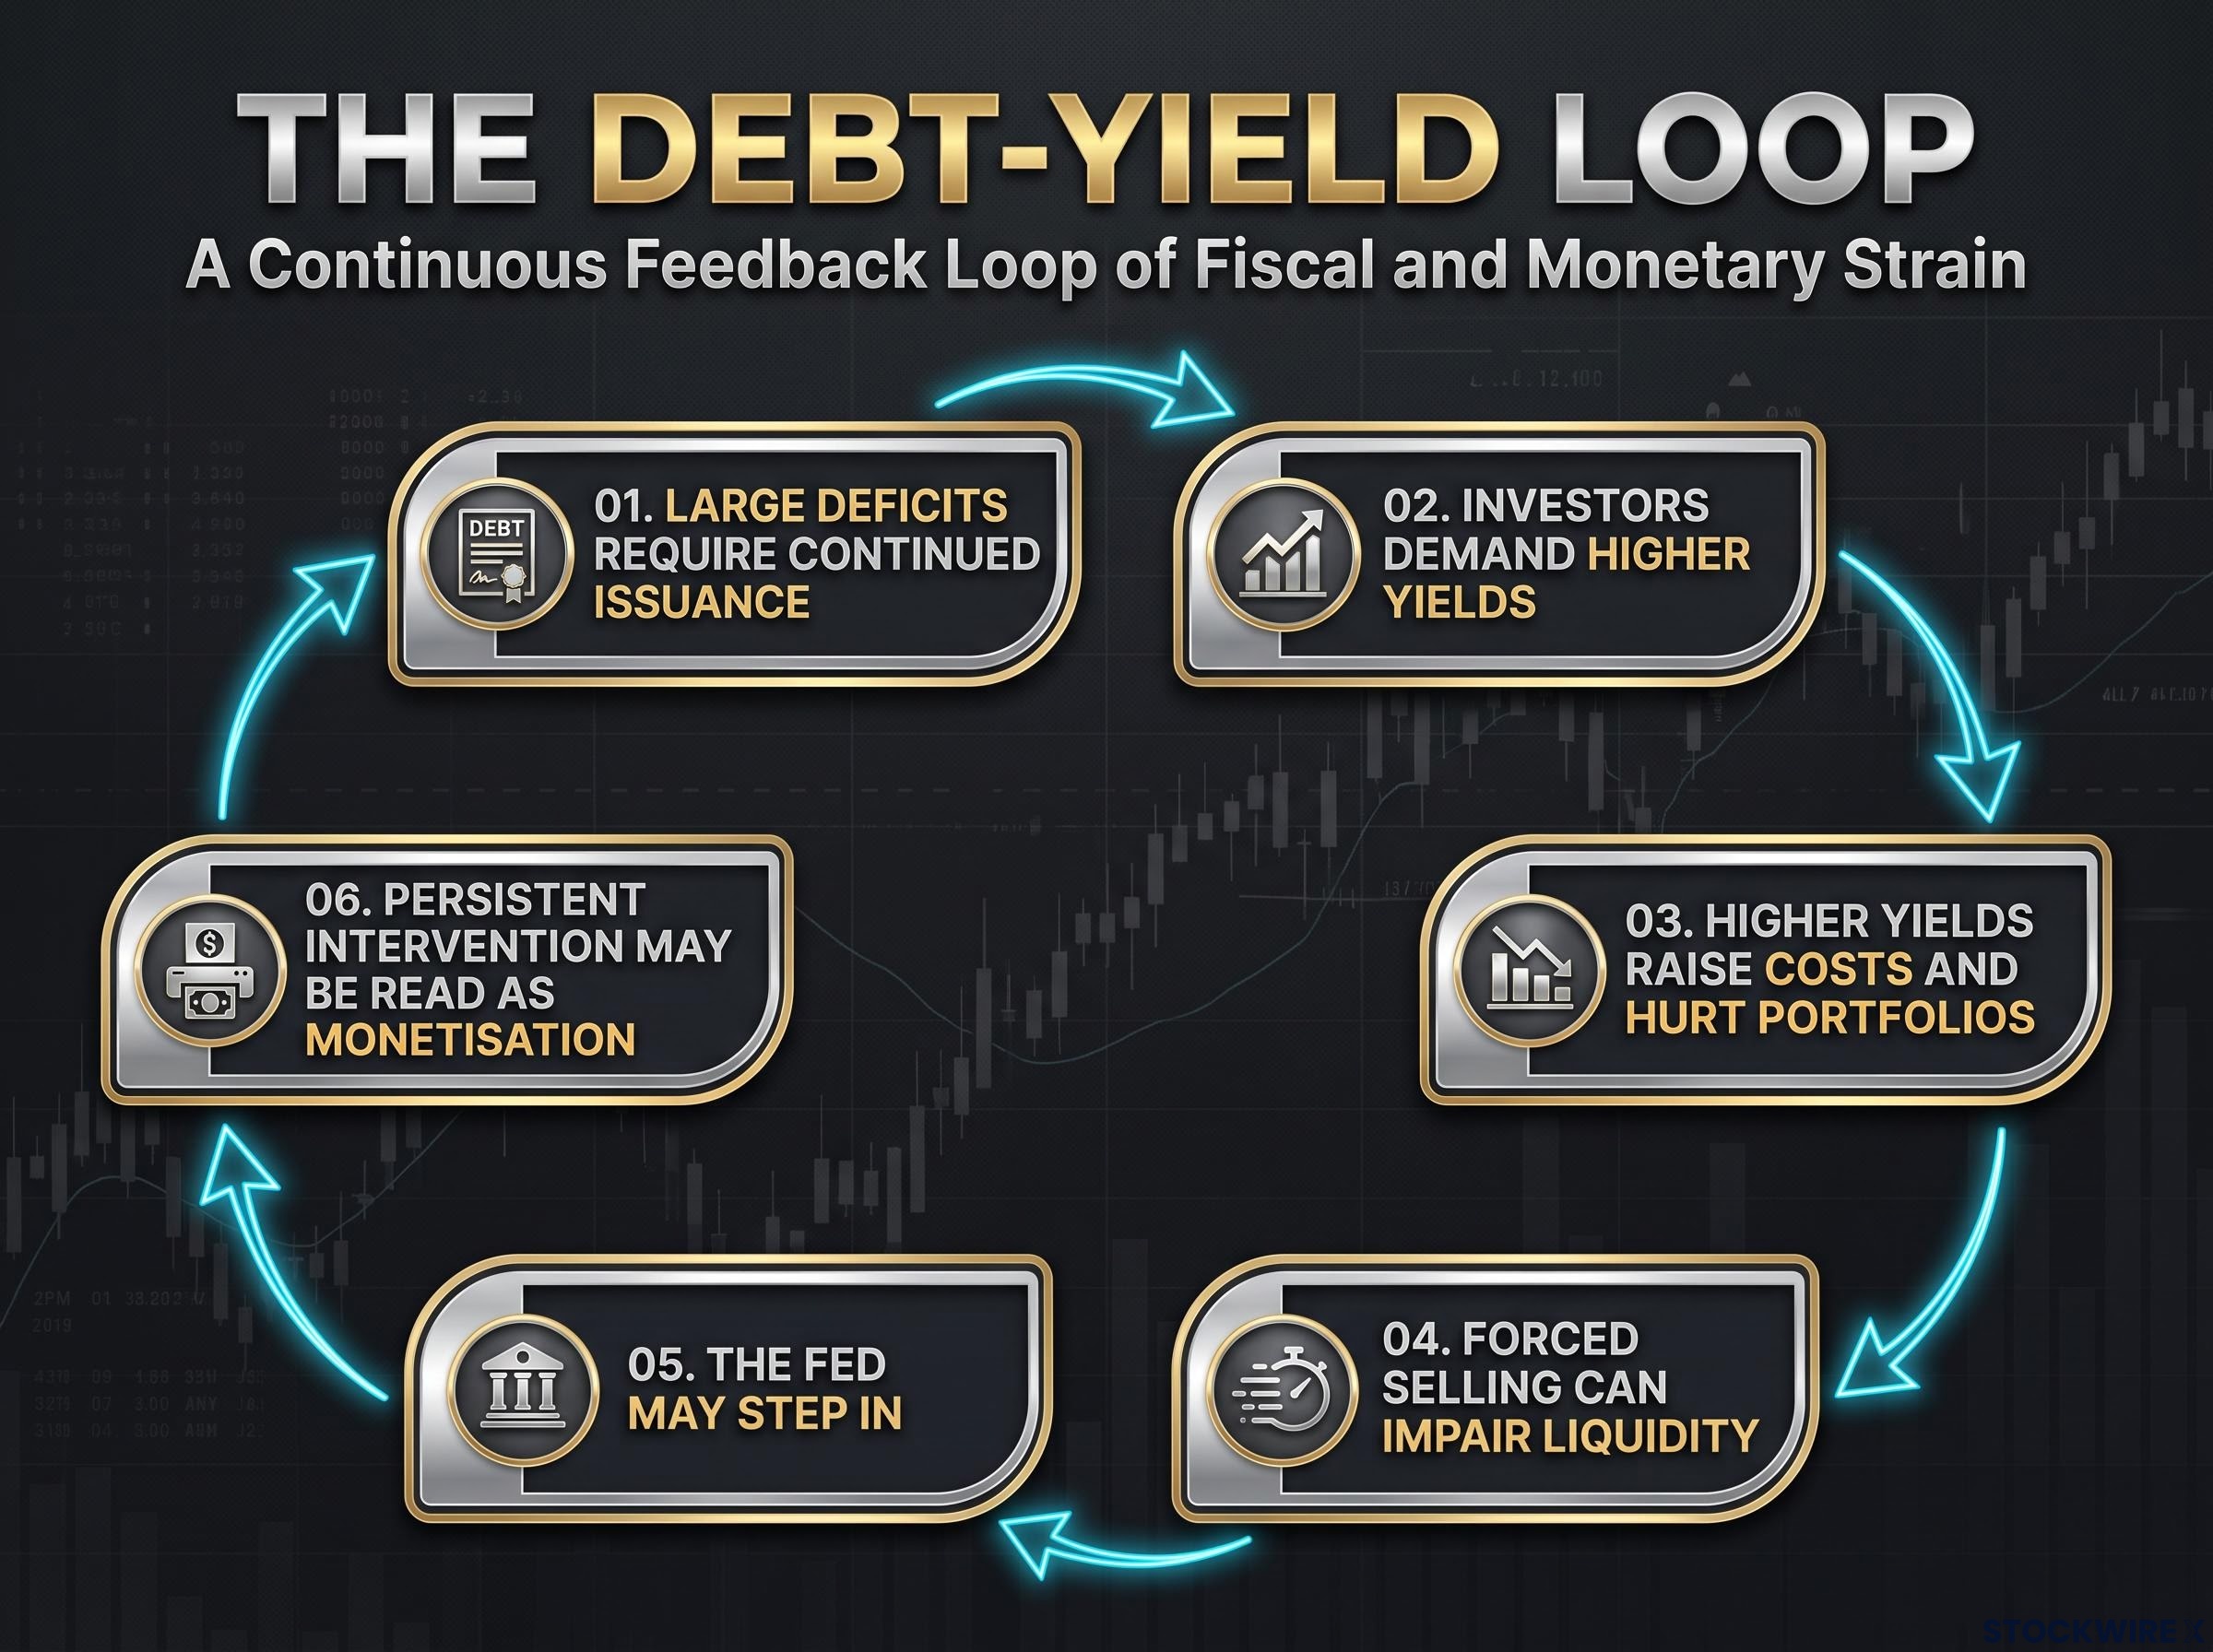
How a bond shock could turn into a Fed response: the debt-yield loop explained
If tightening looks too timid, how does Weldon get from there to fresh QE? Through the bond market. The mechanism is a feedback loop, and each step feeds the next.
- Large deficits require continued issuance. The government keeps selling bonds to fund spending.
- Investors demand higher yields. More supply means buyers want better compensation.
- Higher yields raise costs and hurt portfolios. Interest bills climb and leveraged bond holders take losses.
- Forced selling can impair liquidity. Trading in Treasuries and repo, the short-term lending market backed by bonds, can seize up.
- The Fed may step in. It can buy bills or bonds, or supply liquidity directly.
- Persistent intervention may be read as monetisation. Markets may treat it as the central bank funding deficits, weakening the currency and supporting gold.
Something resembling step five may already be visible. The Fed held about $566.0 billion of Treasury bills on 14 October 2026, up about $370.6 billion over a year. Weldon says the Fed has bought more than a quarter of a trillion dollars of bills directly from the Treasury this year.
Balance-sheet flexibility is itself constrained, since the Fed’s $1.93 trillion mortgage-backed securities portfolio is expected to take until the mid-2030s to run off, limiting how cleanly any new asset purchases could be unwound.
Treasury Secretary Scott Bessent has leaned on bill issuance while buying back longer bonds in operations of $4-6 billion. Barclays estimated about $225 billion of bill issuance in October. The disagreement is over what all this means.
| Interpretation | The argument |
|---|---|
| Operational reserve management | Buying short bills keeps bank reserves ample and money markets stable without lowering long-term yields or easing wider conditions. |
| Stealth QE (Weldon’s view) | If the Fed absorbs more bill supply while the Treasury buys back longer bonds, private buyers carry less of the debt and liquidity is quietly supported. |
The Bank for International Settlements (BIS), often called the central bank for central banks, has quantified how debt changes the odds of a breakdown.
Debt and financial stress BIS research puts the probability of a stress event on the scale of the global financial crisis at about 3.8% when public debt ratios are high, versus 0.3% otherwise.
BIS General Manager José Manuel Campa Hernández de Cos told Reuters on 5 October that central banks should intervene when market dysfunction threatens stability, pointing to past episodes. Those episodes show the mechanism at work, though none matches today exactly. The US Treasury “dash for cash” in March 2020 prompted huge Fed purchases, and the Bank of England bought gilts in 2022 after a pension-fund crisis. Japan’s 10-year yield has reached 3%, a level not seen since 1996, showing even a managed market can reprice.
Weldon argues central banks facing debt deflation will choose to reflate, and that a Treasury run resembling Japan’s would prompt quick QE. Whether you agree or not, the useful lesson is where to look: bond-market function tells you more than headlines do.
Dollar strength, tightening conditions and the equity trigger Weldon is watching
If the mechanism is in place, why has gold fallen? Weldon’s answer is the dollar. A stronger dollar makes gold more expensive for foreign buyers, and that rally is working against his thesis for now.
The dollar index stood at 101.88 on 30 October, against 101.45 at the end of September. The 10-year yield eased to about 4.93% over the same stretch, down from its 5.34% peak. Weldon calls the dollar rally unconvincing and “on borrowed time”, pointing to the Chinese yuan, which reached about 6.6523 per dollar and gained 6.60% over 12 months, according to Trading Economics on 31 October.
He also sees financial conditions tightening in the real economy. Companies facing tighter credit are delaying hiring and raising prices, and high mortgage rates have ended the home-equity withdrawals that helped wealthier households. He cites these consumer signals:
- A New York Fed survey showing sentiment turning down among people earning over $100,000
- Expected income for that group flat against inflation in real terms
- Disposable personal income, excluding government transfers, negative for two consecutive months
That is why Weldon expects equities, not bonds, to set the timing. He anticipates a stock correction, likely after the US midterm elections, and frames it as a buying opportunity rather than a disaster. He adds that passive stock investing will not keep pace with currency debasement.
Rate markets, in his reading, carry the same tension. Swaps price two hikes by October 2027, yet forward pricing shows them reversed late that year.
Weldon’s read of rate pricing Either two hikes defeat inflation, which he doubts, or high inflation hurts the consumer enough that the Fed bails them out with QE.
What this tells you is that two variables decide whether the thesis plays out soon or stays parked: the dollar and the stock market. Those are the indicators to watch.
Buying the dip against a sell signal: where gold stands and what could go wrong
Weldon normally blends top-down macro analysis with technical and quant signals, acting only when they agree. Right now they do not. His macro model points to eventual debt-driven accommodation, while his trading models say sell.
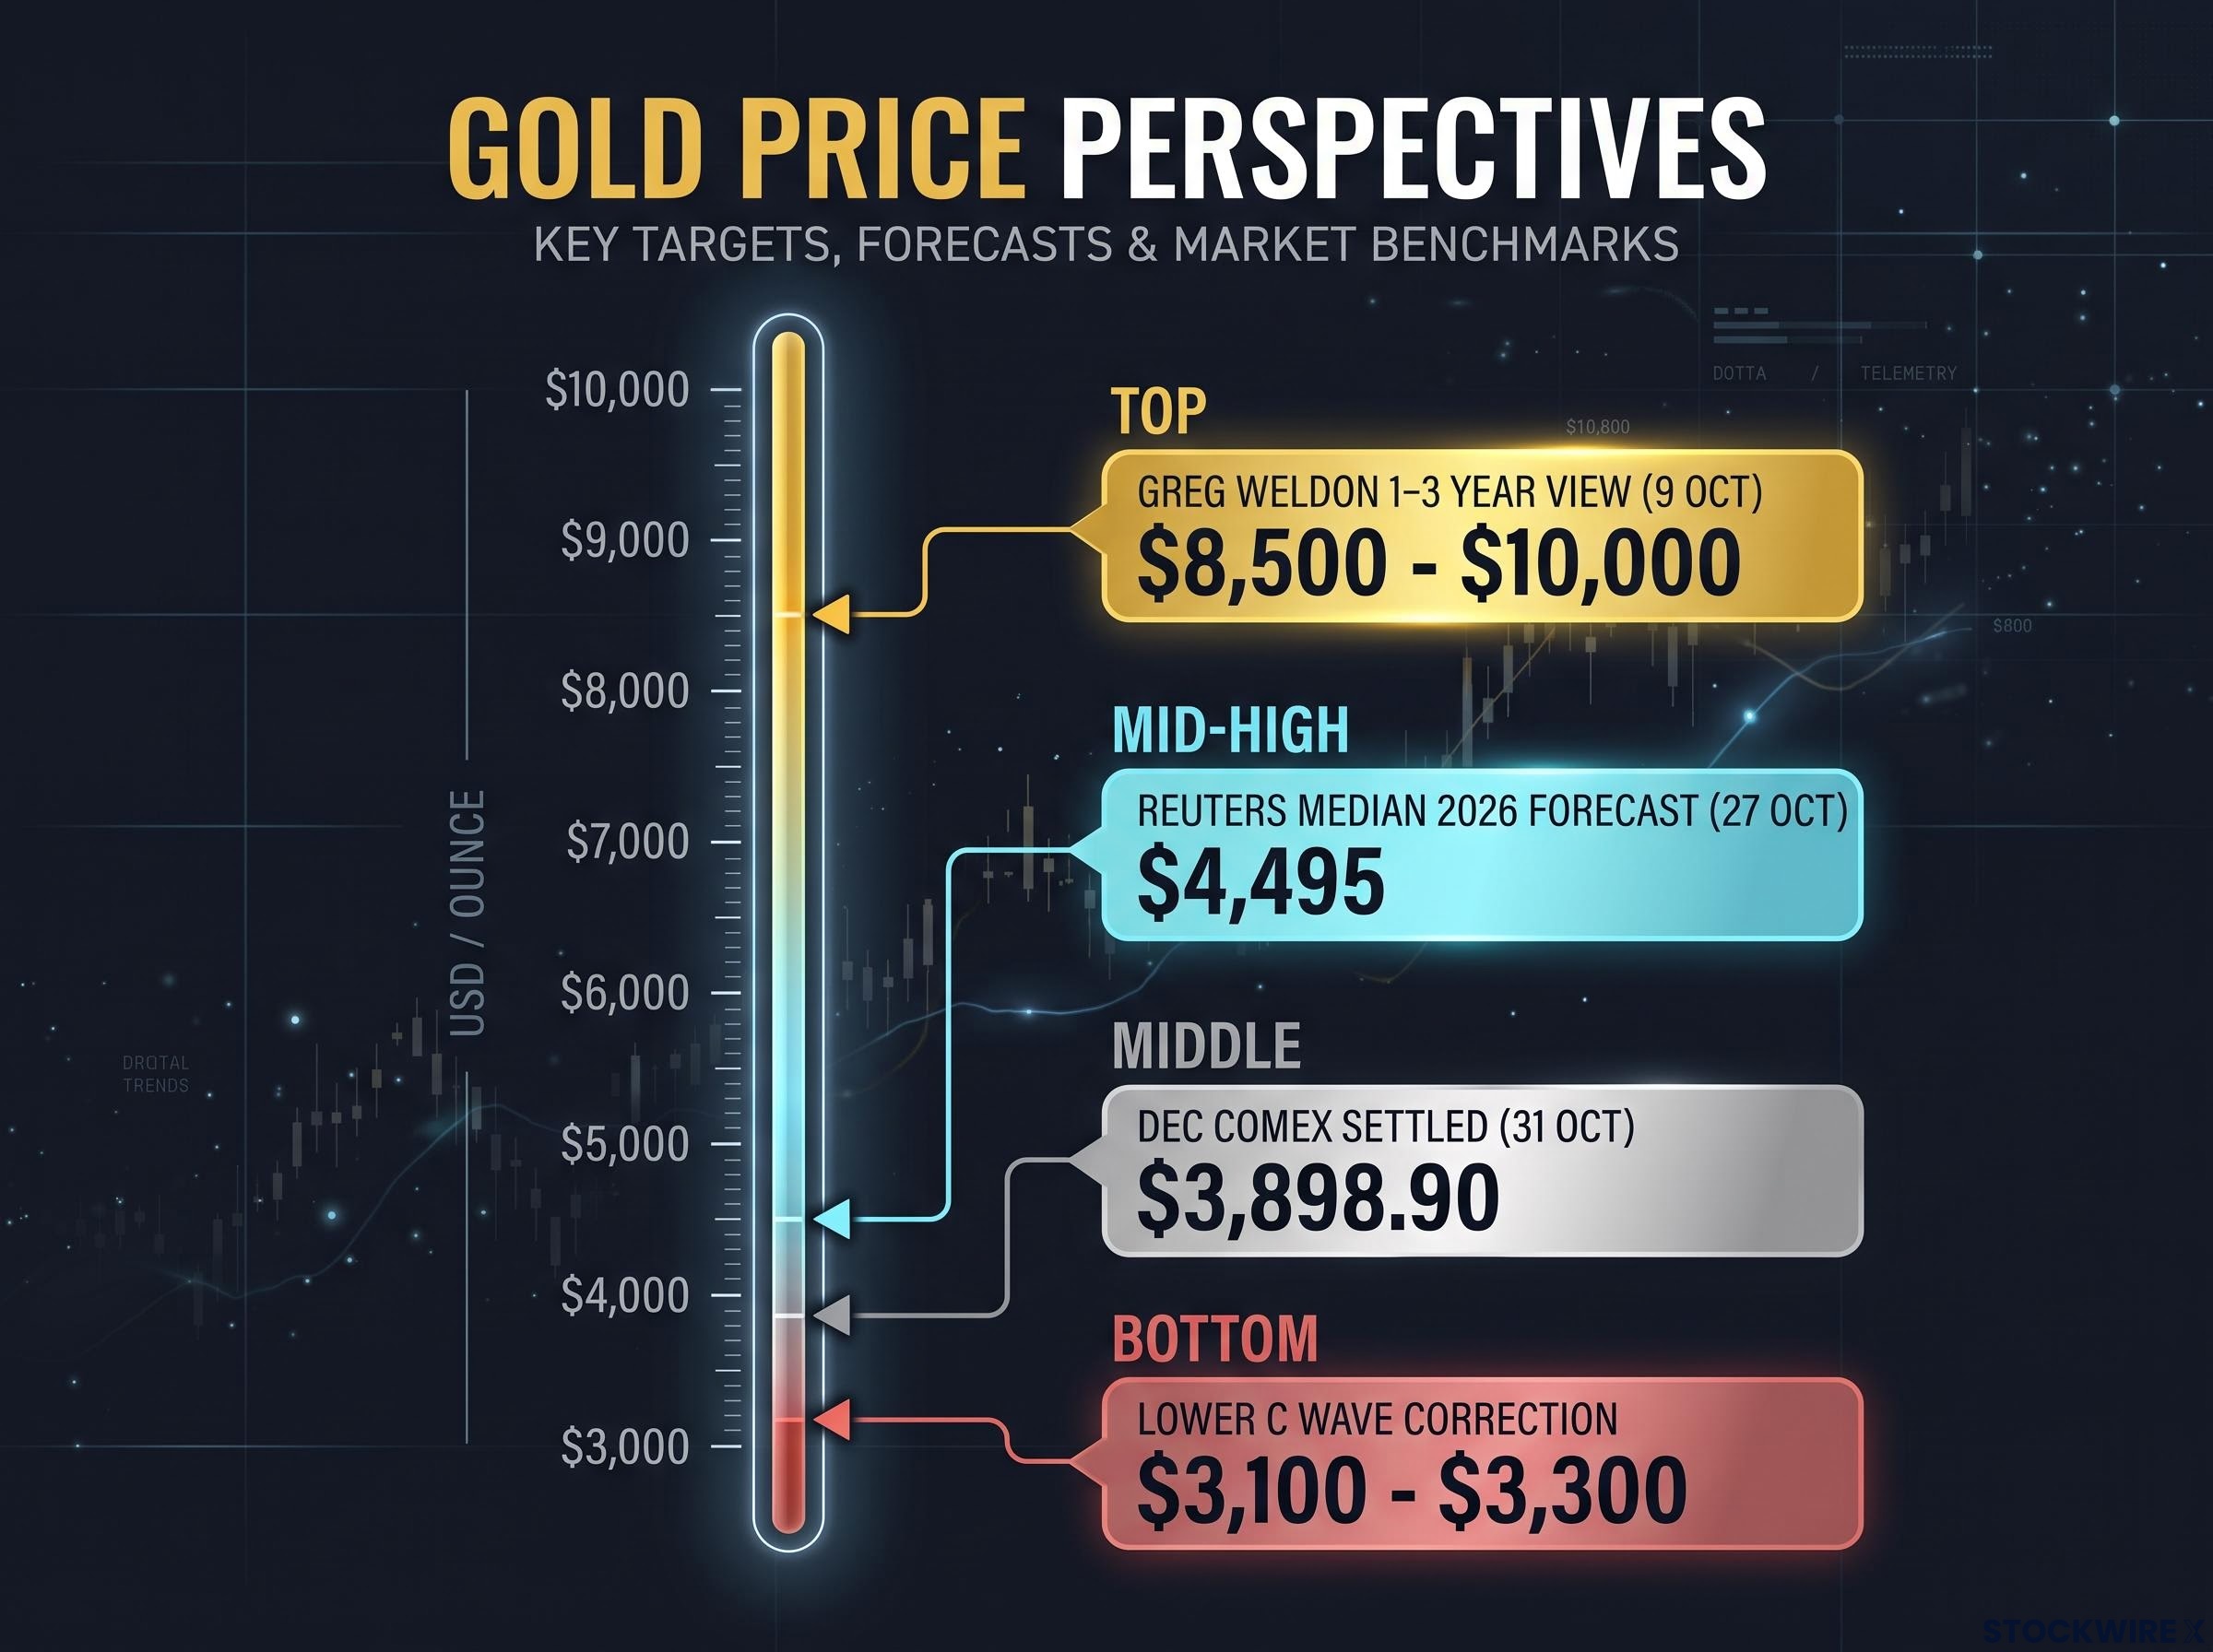
December COMEX gold settled near $3,898.90 an ounce on 31 October, down 6.9% for the month. Weldon reads the decline as an ABC correction that may need a lower C wave toward $3,100-$3,300, though he doubts it falls that far. He refuses to short gold because its upside is open-ended and reversals are hard to time.
Other analysts frame the slide differently, describing it as a speculative washout driven by ETF outflows and momentum money leaving, while central bank buying intentions remain at record highs.
His long-range view, given in an 9 October interview, is gold at $8,500-$10,000 over one to three years. That is his opinion, and it sits far above the $4,495 median 2026 forecast in Reuters’ 27 October analyst survey.
The forces on either side are evenly matched:
Bearish
- Higher yields raise the cost of holding an asset that pays no interest
- A firm dollar cuts foreign buying power
- Persistent inflation may bring more tightening, not less
- UBS’s Giovanni Staunovo points to weakening momentum and softer ETF flows; BCA Research’s Roukaya Ibrahim sees bullish technicals pinned by bearish fundamentals
Bullish
- A bond selloff could force Fed liquidity support
- Bill purchases could expand the monetary base without the QE label
- Tolerated inflation erodes real returns on cash and bonds
- Official-sector gold buying can persist despite dollar strength
Faced with that split, you can weigh three approaches.
| Approach | What it captures | Main risk |
|---|---|---|
| Follow the sell signal | Trend continuation and drawdown protection | Selling near a low or missing a sudden policy reversal |
| Buy the dip | Long-term exposure to debt monetisation, inflation and central-bank demand | Gold keeps falling while you wait for QE |
| Blend | Cutting exposure on breakdowns while keeping a core position | Whipsaw, and possibly lagging both |
Why timing is the real risk
The strongest counterargument is not that Weldon is wrong but that he may be early. Gold can stay under pressure for months or years if the dollar holds firm, fiscal policy steadies bonds, or the Fed intervenes narrowly and then resumes tightening.
October’s tape favoured the bearish technical view without disproving the fiscal case. Buying the dip only suits you if you can sit through further weakness without being forced to sell.
Weighing a debt-driven gold thesis: the signals that would confirm or challenge it
The evidence splits two ways. Above-target inflation, high yields and a firm dollar weigh on gold now, while heavy debt, rising interest costs, bill issuance and recurring bond stress could eventually bring intervention.
Sovereign gold accumulation, including central banks repatriating bullion to domestic vaults, is one reason official-sector buying can persist even when high real yields and a firm dollar cap short-term upside.
If you want to track which side is winning, watch these:
- Bond-market function and the 10-year yield
- The dollar index and the yuan
- The Fed’s December decision
- How equities behave after the midterms
- The direction of real yields
Whether a gold buying opportunity exists depends on your time horizon and tolerance for drawdowns. Weldon’s view is one opinion among many, and this piece is analysis, not a recommendation.
This article is for informational purposes only and should not be considered financial advice. Investors should conduct their own research and consult with financial professionals before making investment decisions.
Past performance does not guarantee future results. Financial projections are subject to market conditions and various risk factors.
—