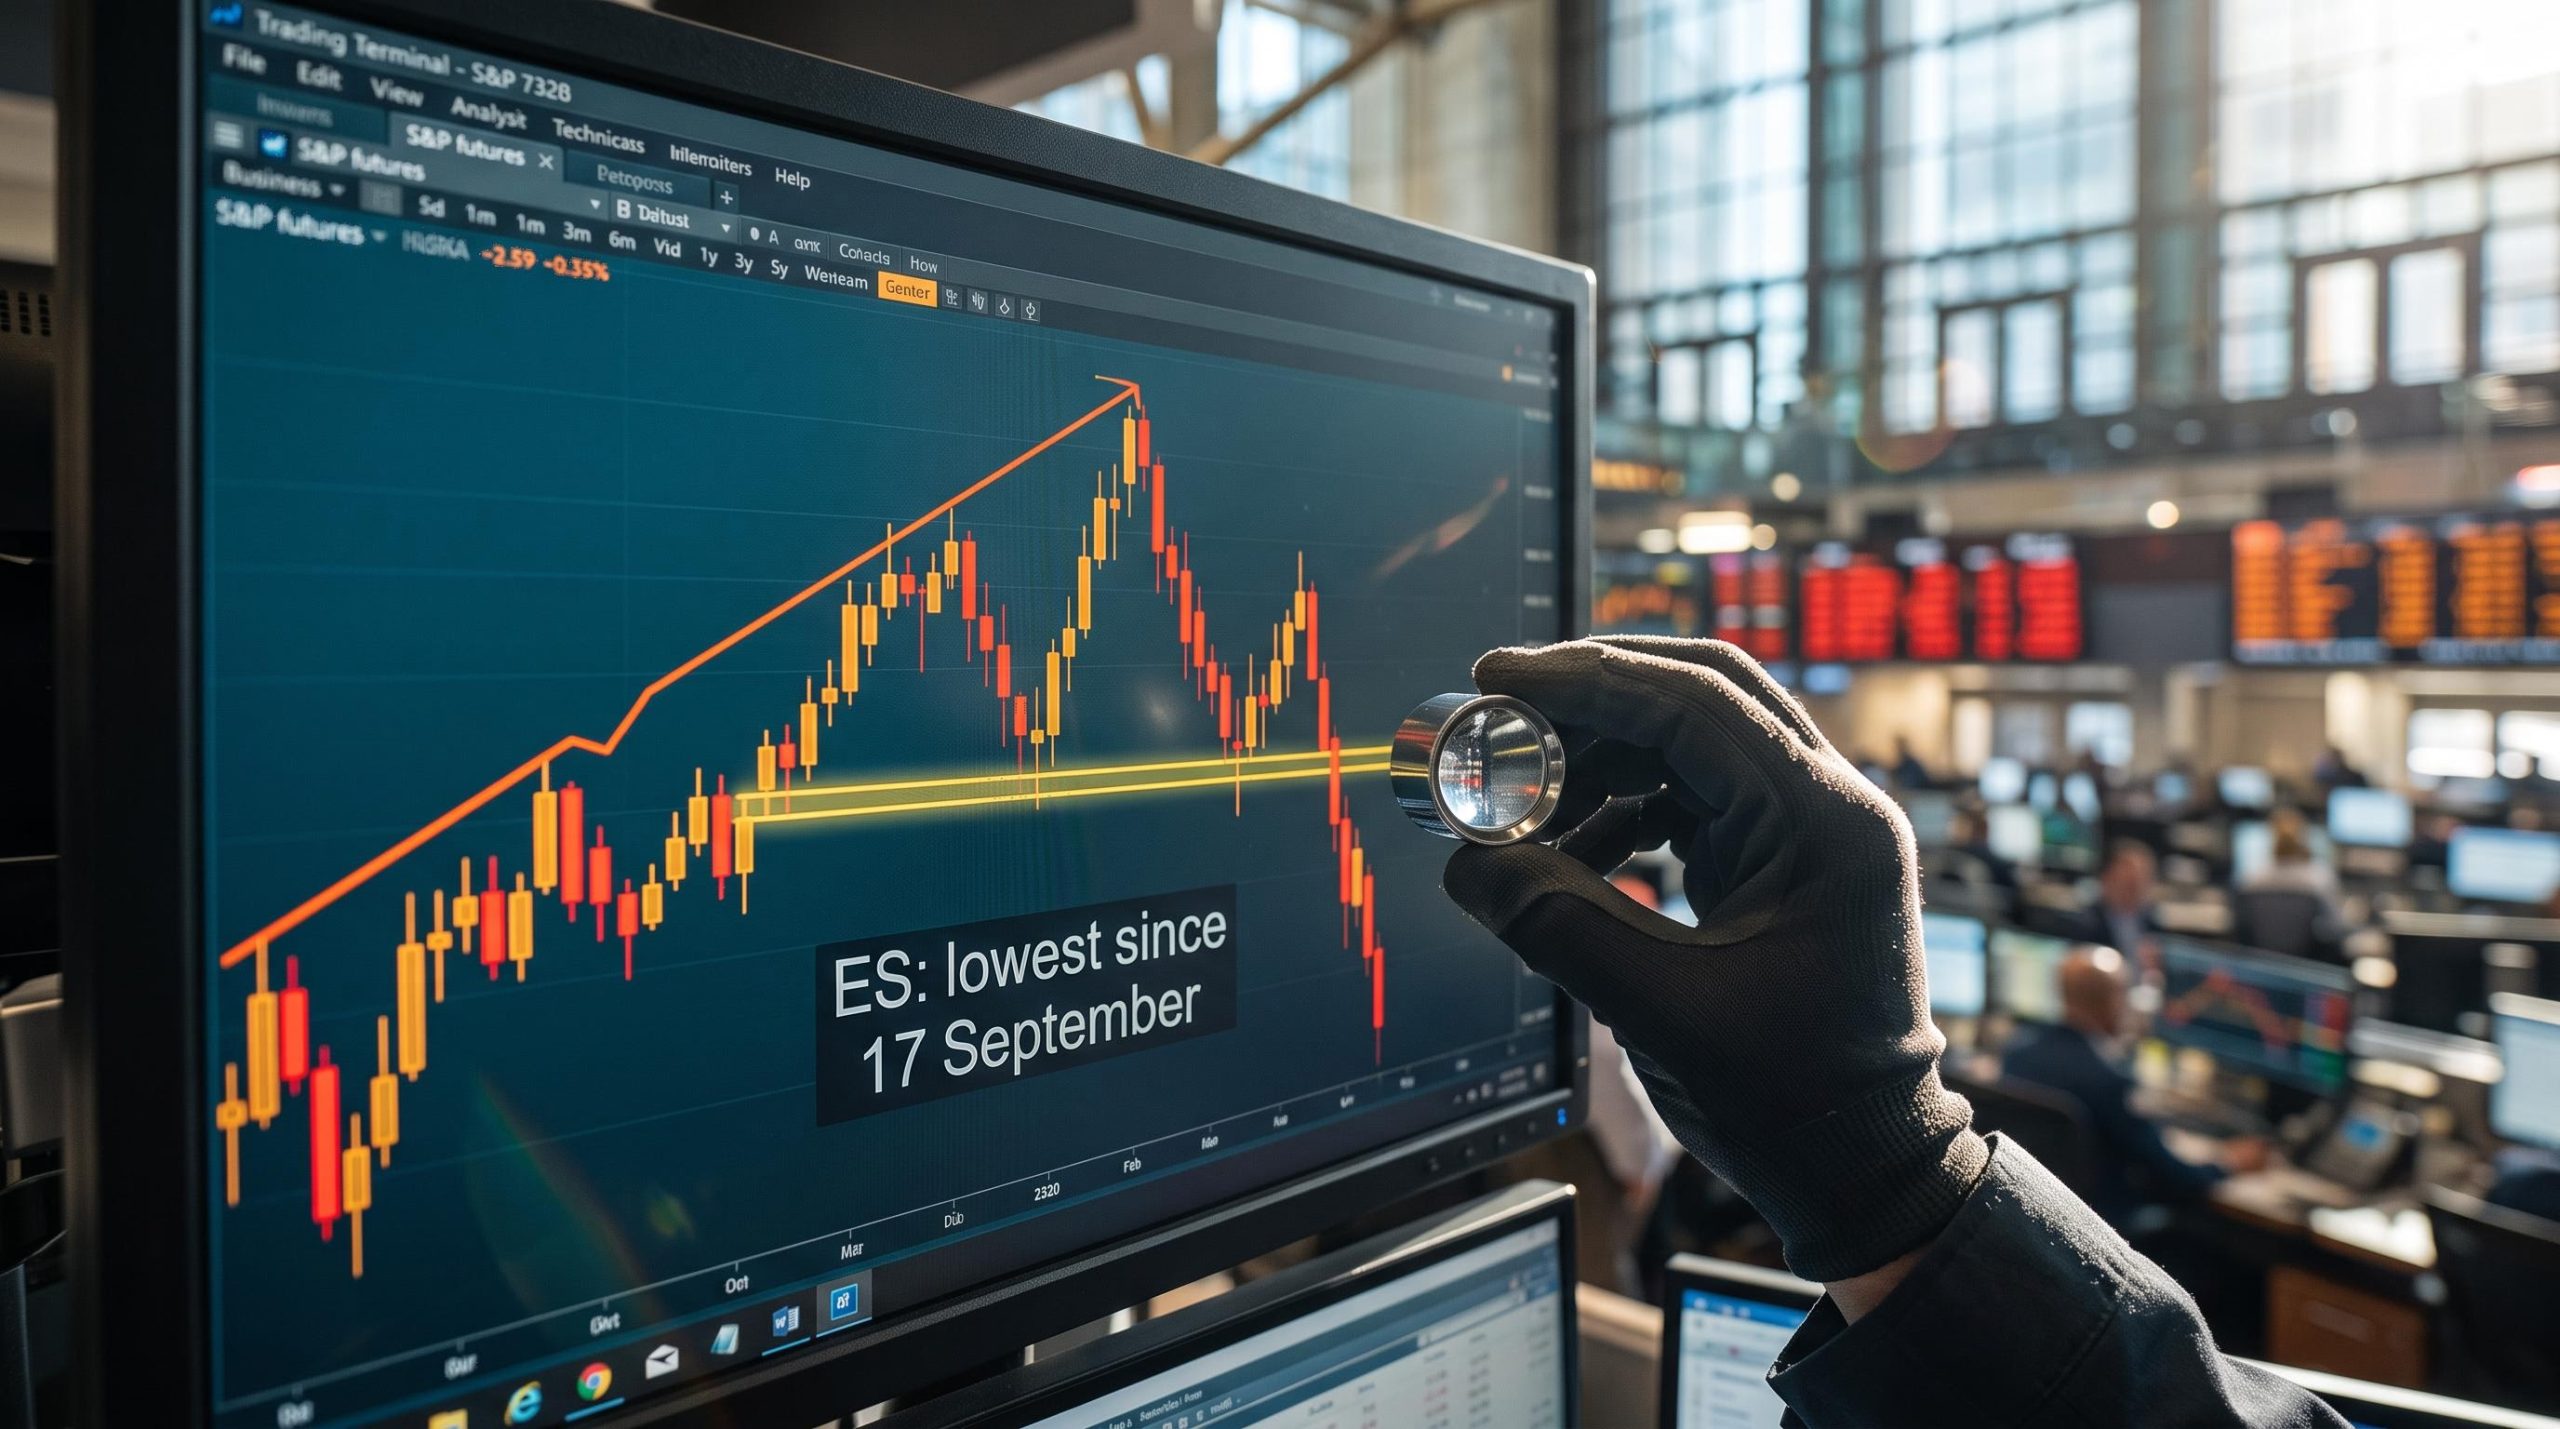
S&P 500 futures (ES) have slipped to their lowest level since 17 September. That puts them back near where they traded on 4 August, and it comes after months of sideways chop that repeatedly punished anyone who bought the dips. The S&P futures breakdown now showing on the chart looks convincing, but so did the last few warnings.
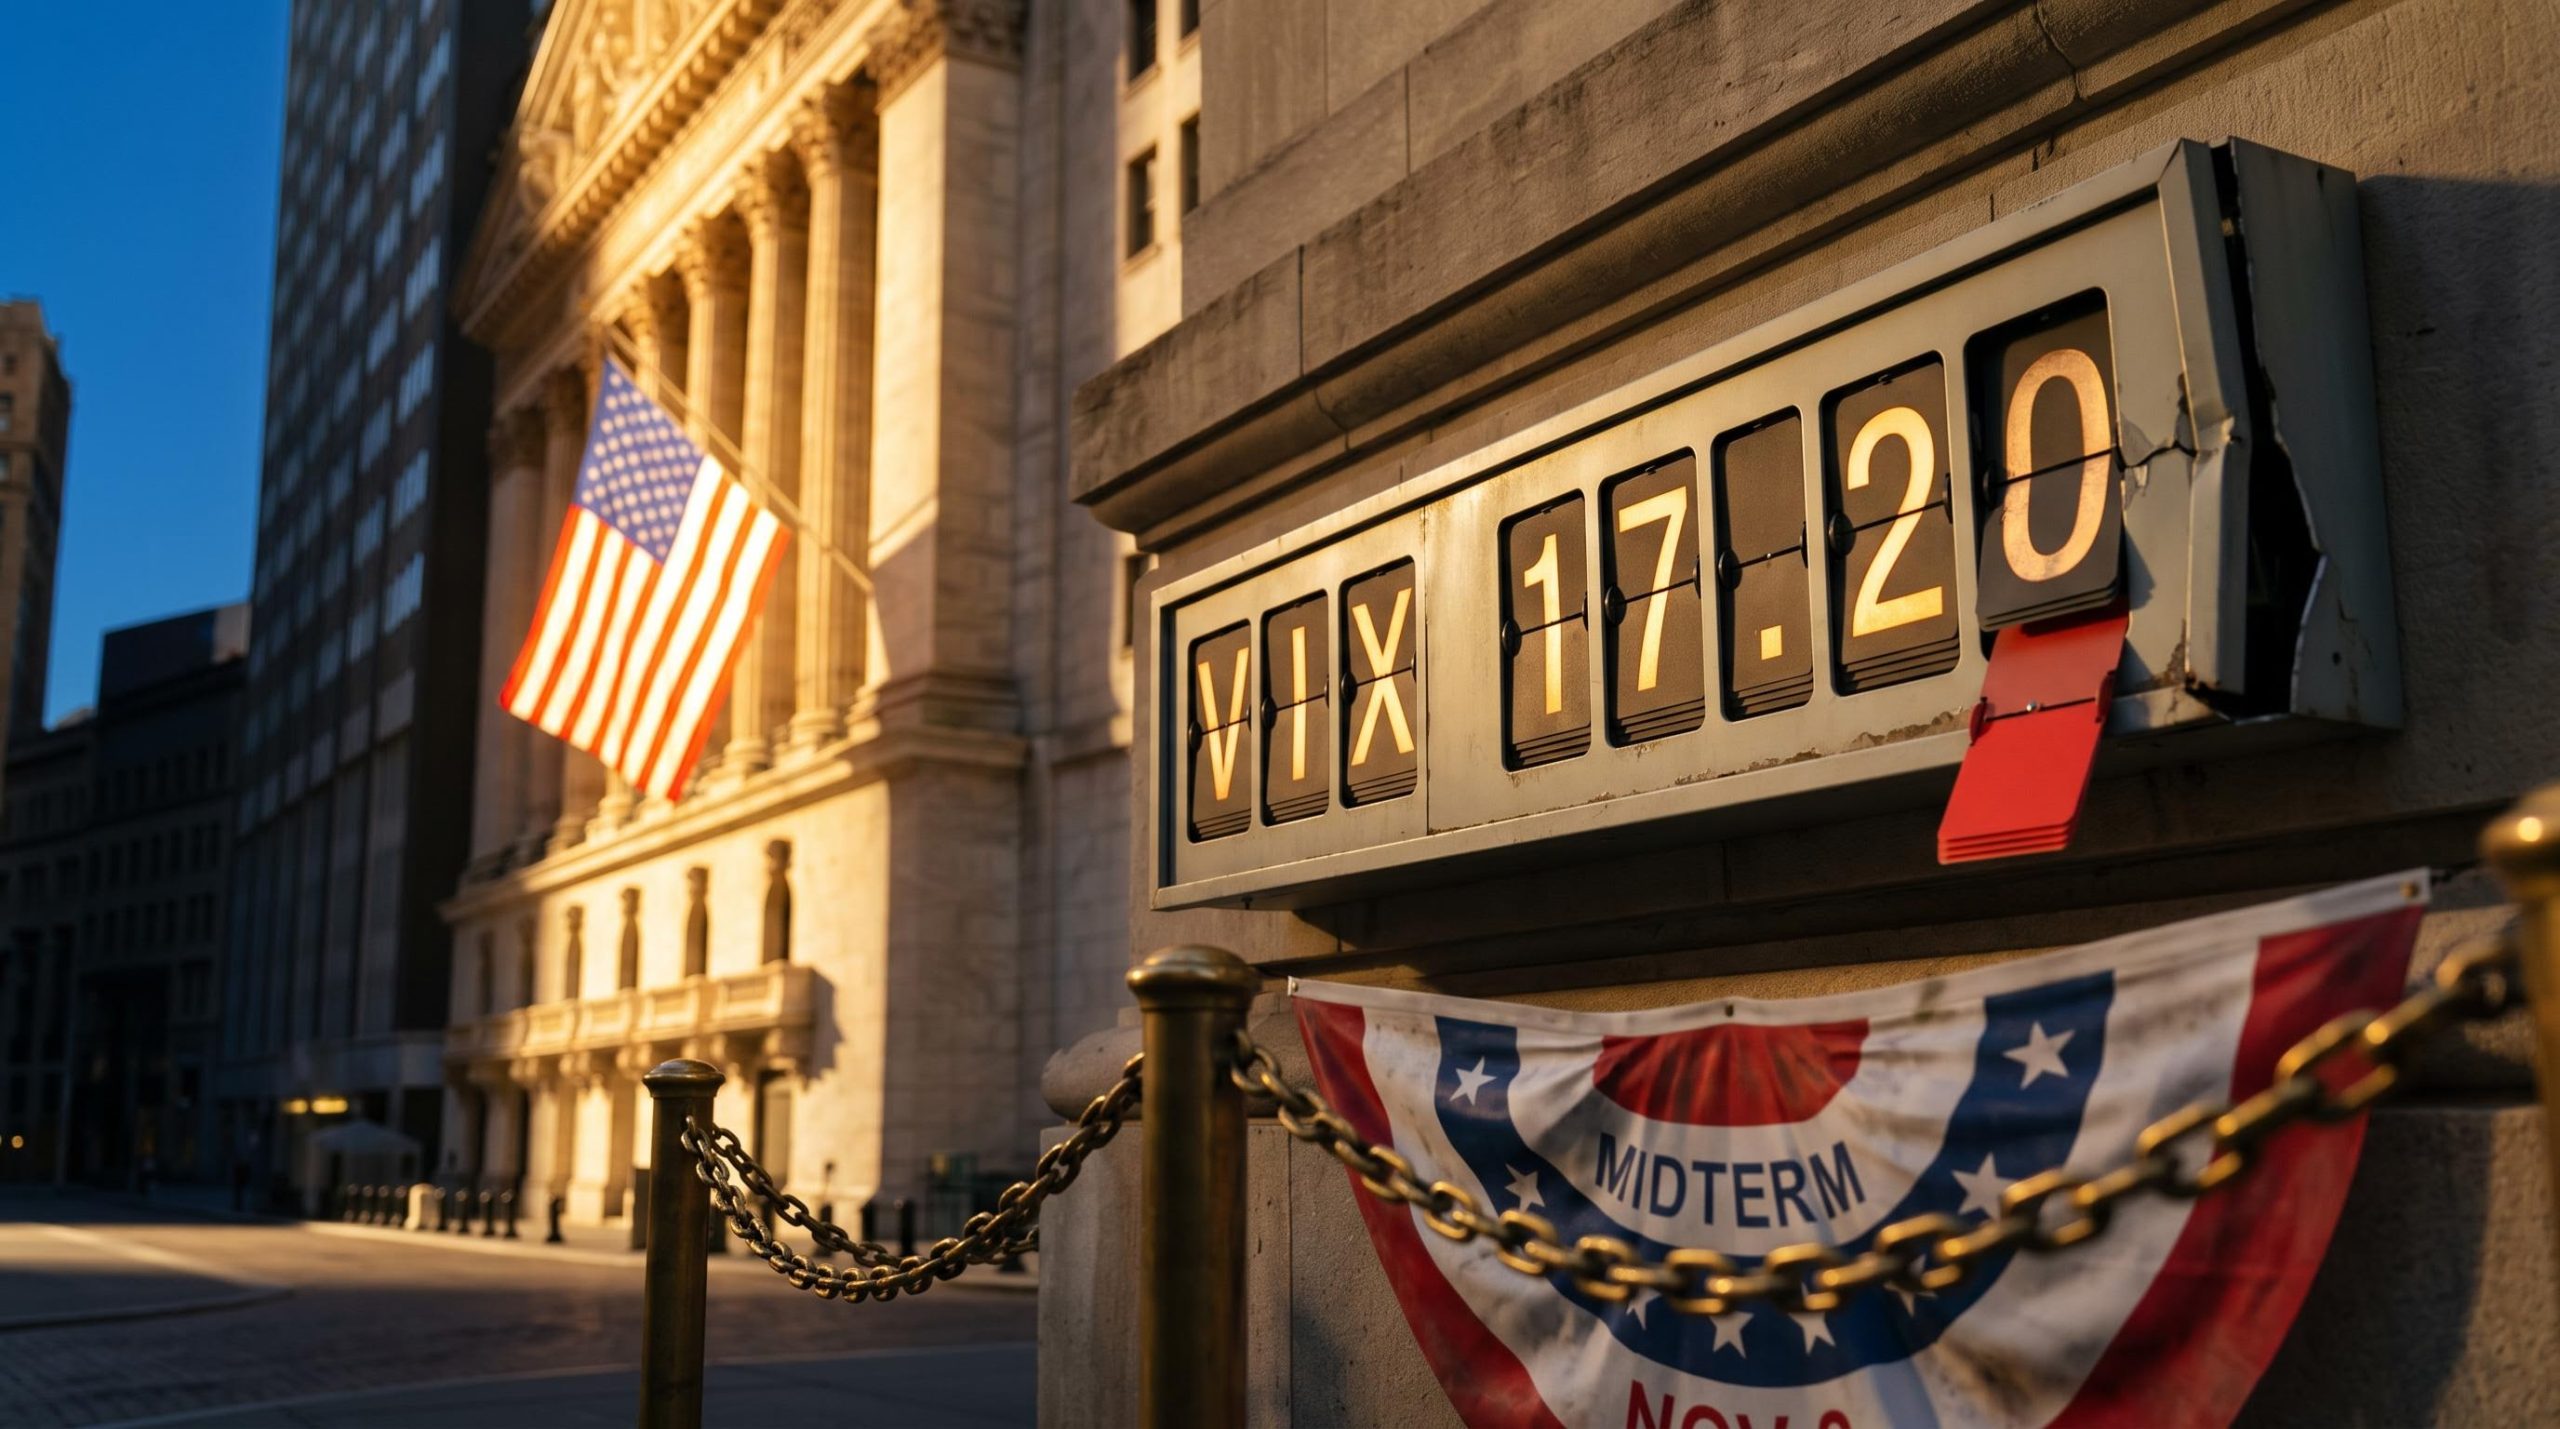
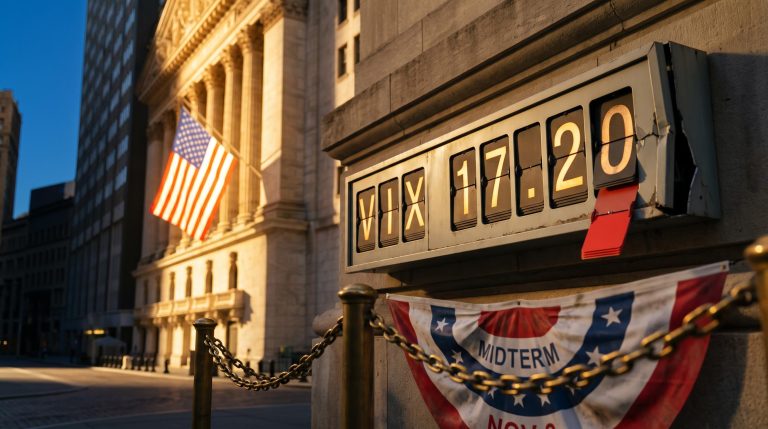
The timing compresses several risks into a single week. Amazon missed expectations on 29 October, futures were pointing to a decline of roughly 1% for the 30 October session, and the US midterm elections arrive on 3 November.
That cluster of events raises three questions. Is the technical damage real? Why are bonds rallying while technology falls? Why are small caps holding firm?
Here is a way to judge whether the break deserves your trust, how to read the bond and small-cap signals, and how to size your exposure so a wrong call does not cost you too much.
What the S&P futures breakdown looks like after months of whipsaw
The pattern started as frustration rather than collapse. For months, ES traded inside a range and made no net progress. Each dip looked like an opportunity, and each one punished swing traders who added exposure into the weakness.
The setup: Months of range trading with no net progress, in which buying weakness repeatedly cost money.
Then the rhythm changed. For two weeks in a row, the market rallied early in the week and dropped hard late in the week: on Thursday the first time, then on Friday. One trader whose market commentary forms the basis of this analysis was caught lightly positioned both times. That is how a range starts to tilt.
According to that trader, the tilt has now produced three signals:
- A broken trend line drawn from the late-March Iran war low, which followed an earlier false break with a genuine one
- A completed small head-and-shoulders pattern, formed over several weeks and now breaking
- ES at its lowest since 17 September, roughly level with 4 August, when Treasury Secretary Scott Bessent said the Iran war would end quickly and sparked the last large rally
The cash index tells a more muted story. The S&P 500 closed at 7,720.39 on 29 October, down 0.30%, according to Charles Schwab. The New York Times reported futures indicating about 1% lower for the next session. In the week ending 23 October, the index fell about 0.46% to 7,623.68, Stifel reported. No precise current ES price was available in the reporting reviewed.
The headline drop matters less than where price settles. The breakdown only matters to you if ES stays below the broken trend line and the neckline. Those two levels deserve your attention.
When big ASX news breaks, our subscribers know first
How to read a trend-line or head-and-shoulders break without getting whipsawed
Each pattern describes buyers losing control. A trend-line break means a run of rising lows, which acted as support, has been breached.
A head-and-shoulders pattern is a three-peak formation where the middle peak (the head) stands taller than the two either side (the shoulders). The neckline is the support line connecting the lows between those peaks. A close below the neckline completes the pattern. Traders then project a downside objective roughly equal to the distance from the head down to the neckline.
Traders who project measured-move targets from the head down to the neckline also tend to scale out early, often taking partial profits at roughly 40% of the projected distance rather than waiting for the full objective.
The hard part is confirmation. A summary of Thomas Bulkowski’s historical pattern study reported a break-even failure rate of about 19%, a target-hit rate of about 51% and a pullback rate of about 68%. These figures were not independently confirmed, and they describe historical patterns rather than forecasting ES. The 68% figure explains why so many breaks feel wrong before they work: price often returns to test the broken level.
A practical confirmation checklist:
- Wait for a close below the neckline. An intraday breach carries less weight.
- Check volume. Breaks on low volume fail more often.
- Watch the retest. A failed attempt to reclaim the neckline strengthens the signal.
- Set the invalidation level first. Stops typically sit above the right shoulder, or above the head for a more conservative approach, with an ATR buffer. ATR (average true range) measures typical daily price movement and helps keep normal volatility from triggering your stop.
| Signal | What it suggests | Confirmation | Invalidation |
|---|---|---|---|
| Trend-line break | Rising support has failed | Closes below the line, failed retest | Quick reclaim of the line |
| Head-and-shoulders | Buyers could not reclaim the high | Close below neckline on volume | Close back above neckline or right shoulder |
The trader’s months of whipsaw show the cost of skipping these steps. A pattern gives you a probability, not a verdict. Decide in advance what price action would prove the breakdown wrong.
Why bonds are rallying while AI and tech weaken
The evidence
The cross-asset move began with Amazon. The company reported revenue of $201.94 billion, up 12.1%, against consensus of $202.22 billion. Earnings per share came in at $1.89 against $1.96 expected. The shares fell about 6-7% in extended trading.
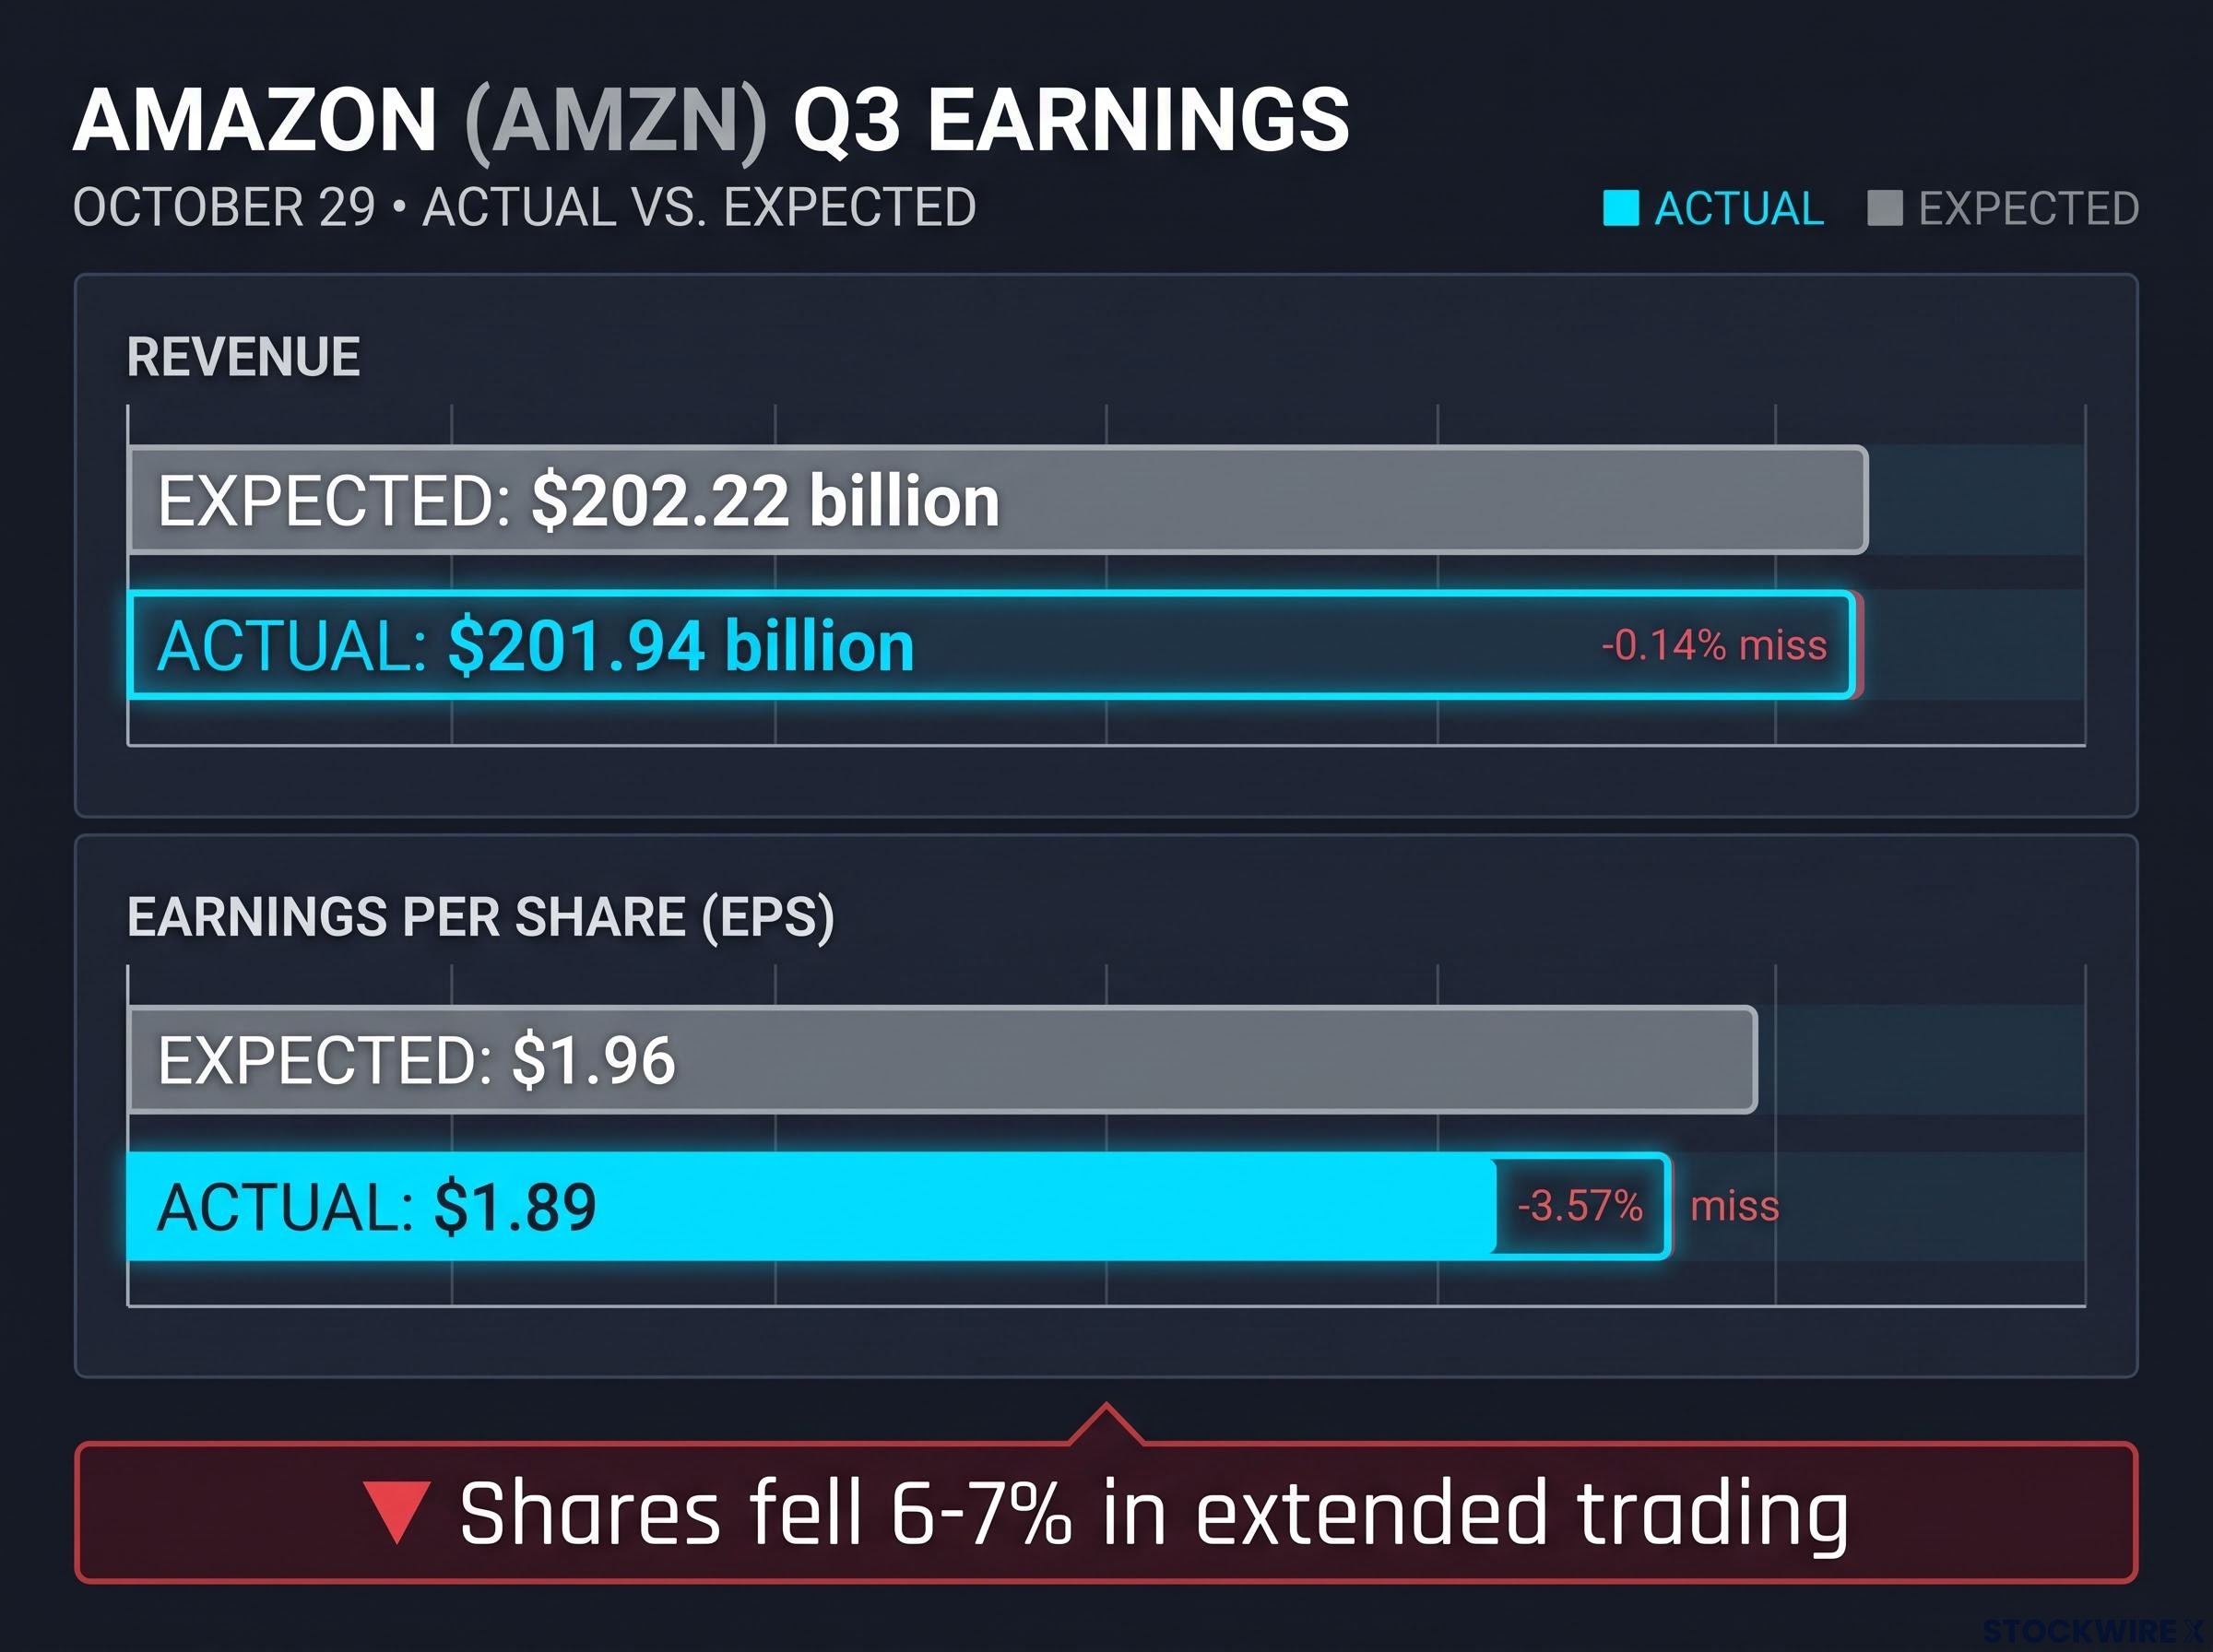
Bonds jumped almost immediately. The 10-year Treasury yield fell to about 4.94% on 29 October, down roughly 10 basis points that day, after touching about 5.3% earlier in October. One market participant observed that tech had followed yields up and was now following them down. In that reading, the trigger was the entire AI trade rather than Amazon alone.
Competing explanations
The same price action supports three different stories:
| View | Core claim | Supporting evidence | Implication for equities |
|---|---|---|---|
| Bearish macro | AI capex and debt strain slow growth | CoreWeave 9.75% bonds yielding nearly 15% (Morningstar) | Lower valuations, deeper drawdown |
| Valuation reset | AI theme intact, winners separating | UBS’s Ulrike Hoffmann-Burchardi calls it a recalibration | Dispersion, not collapse |
| Traditional risk-off | Flight to safety amid uncertainty | Bonds, yen and Swiss franc rallied on 15 October | Fades if uncertainty clears |
Pepperstone’s Chris Weston described the shift as a move from worries about financing AI to worries about whether shareholders will earn adequate returns. The trader adds a fourth, untested idea: debt capital that previously funded AI is being redirected into Treasuries. Reuters separately reported that strain in AI infrastructure financing was helping drive the bond rally, which is consistent with that idea but does not prove it.
Inflation complicates every one of these views. Bessent said another Fed hike would “not necessarily” be a mistake, and the Iran energy shock continues to push inflation away from target. If yields are falling because investors fear slower growth, that is a warning for stocks. If they are falling because investors want safety, the move may reverse once the election passes. You need to know which of those stories your positions depend on.
Why small caps are rate-sensitive, and the case and risks of shorting IWM
Why rates matter for small caps
Smaller companies tend to have thinner margins, less diversified revenue and weaker access to capital markets. That pushes them towards bank loans, which usually carry floating rates. Floating-rate debt resets as market rates move, so rising yields feed directly into higher interest costs.
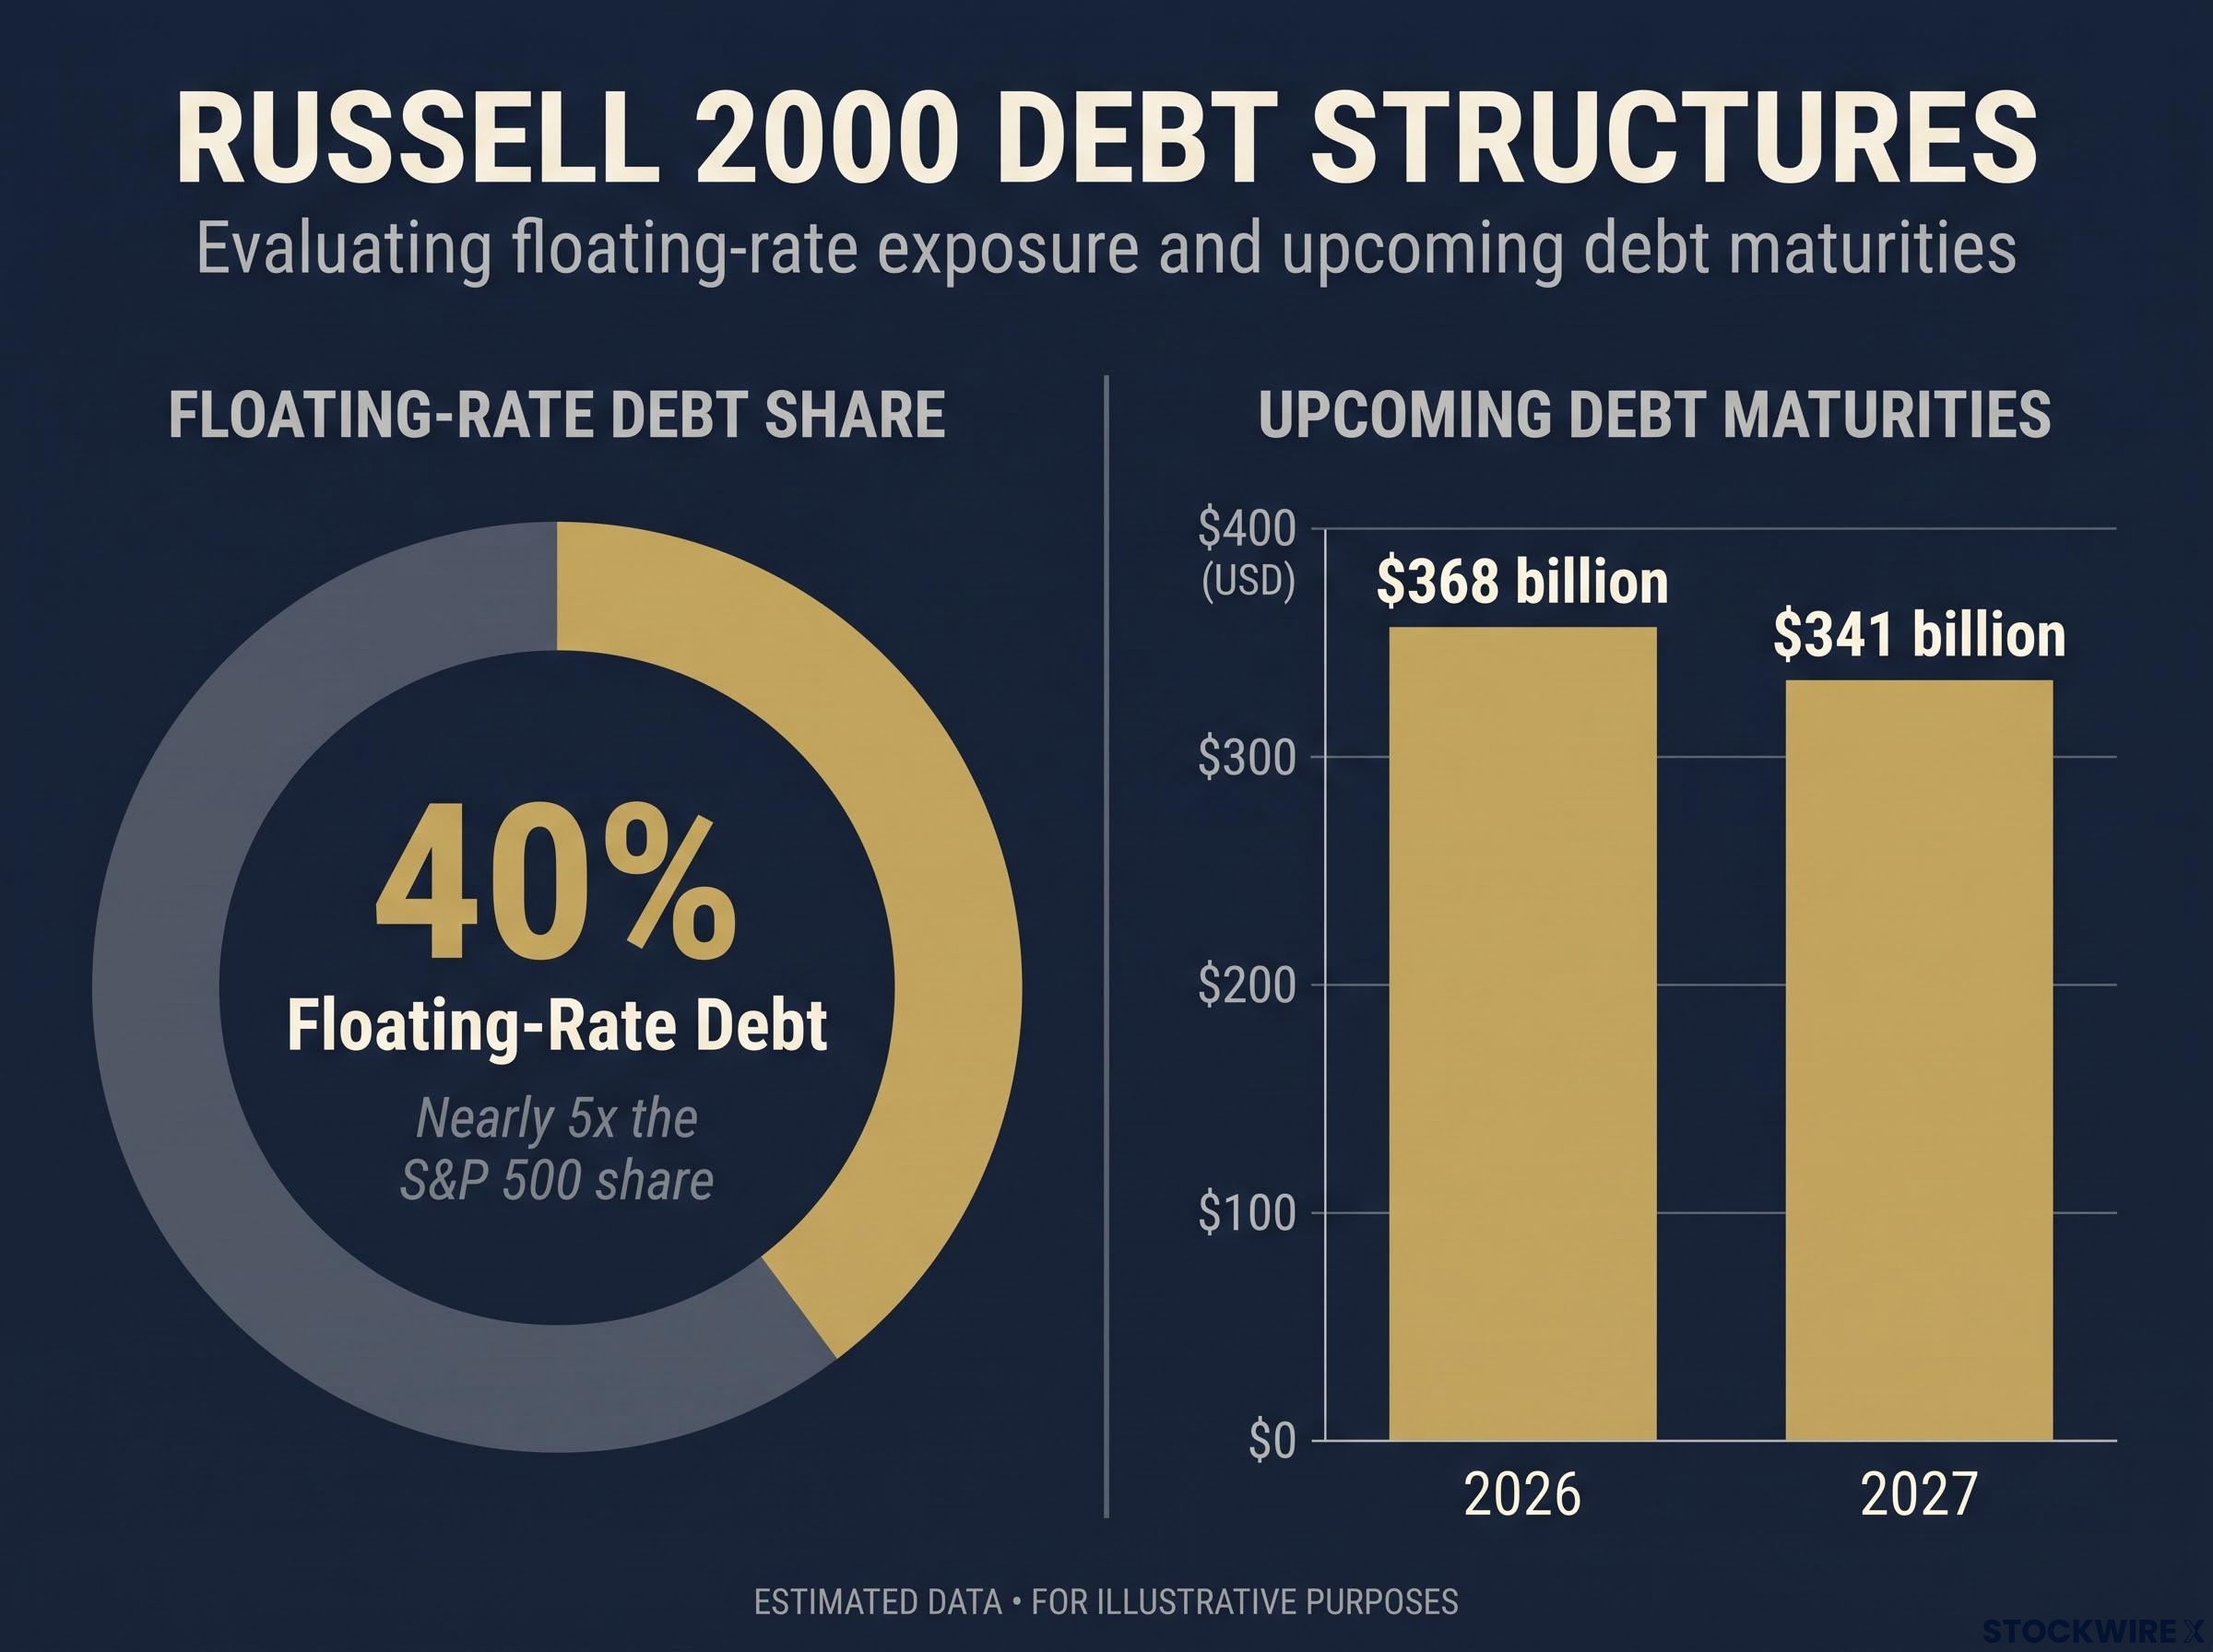
Estimates of floating-rate debt exposure vary by source, with some analyses putting the share of Russell 2000 debt at 30% to 38% versus roughly 7% for the S&P 500, which magnifies the earnings hit when rates stay elevated.
Wells Fargo: About 40% of Russell 2000 rate-classified debt is floating, nearly five times the S&P 500 share.
The refinancing wall adds pressure. Roughly $368 billion of Russell 2000 debt reportedly matures in 2026 and $341 billion in 2027, although these figures were not independently confirmed. Debt that was issued when rates were low will be refinanced at higher cost.
That logic sits behind the trader’s position: short IWM, the Russell 2000 exchange-traded fund, in size. The trader expects rates to rise again, holds about 25% cash and has stops in place.
Risks to the short
The tape on 30 October points the other way. The Russell 2000 rose about 1.0% to 2,859.22 on 29 October, was up about 3.0% for the week, and was on course to finish October higher after falling more than 11% from mid-August to mid-October.
- Rates can fall fast, which cuts interest costs and makes refinancing easier.
- Rotation out of mega-cap tech can lift cheaper domestic stocks even when their balance sheets are weak.
- The index is mixed, and constituents with cash and little debt can lead a rebound.
- Election relief could trigger a short squeeze.
- Recent resilience is real, and the trader has observed small caps rising when Nasdaq futures fall.
This short is a bet on rates as much as on stocks. Check whether your thesis needs yields to rise again, because the bond market is currently moving against that assumption.
Managing exposure into the 3 November midterms
The trader believes markets are underestimating the election’s impact and points to the drop that followed Brazil’s election. That comparison is the trader’s own, and the research reviewed does not support it with data.
History leans the other way. LPL Research reported on 4 September 2026 that midterm-year Octobers have averaged about 3.0% and Novembers about 2.7%. LPL data shows the S&P 500 has risen in the 12 months after the midterms 18 straight times since 1954, averaging about 17.2%.
Those numbers come from small samples drawn across very different economic regimes. They do not account for wars, inflation shocks or AI capital spending repricing. Treat them as background probabilities rather than timing signals.
The seasonal case rests on a long record: the S&P 500 has averaged a 14.5% gain from late August through March in midterm election years since 1950, driven largely by relief once political uncertainty resolves.
Prediction markets suggest little surprise is left in the result:
| Source | House odds (Democrats) | Senate odds (Democrats) |
|---|---|---|
| Kalshi (28 October) | 91% | 65% |
| OnPoint Politics | 95% | 82% |
The election is not the only event this week. The Fed, Iran headlines and major tech earnings all carry their own risk. Practical controls include:
- Smaller gross exposure
- Stops set in advance, wider if needed, but never left undefined
- Partial profit-taking into moves
- A higher cash allocation
- Risking about 1-2% of account equity per trade (a framework that was not independently confirmed), with size based on the distance to your stop
Both the bearish case and the seasonal case are plausible. Position sizes that survive being wrong in either direction will serve you best.
Reclaim levels and the signals that would change the picture
The breakdown stays credible while ES remains below the broken trend line and the neckline. A quick reclaim of those levels, backed by strong breadth and falling yields, would point to a false breakdown rather than the start of a deeper slide.
Four variables deserve your attention: daily closes around the neckline, the 10-year yield relative to the 5% area, whether small caps keep rising when tech sells off, and the market’s reaction after 3 November.
None of these will resolve the question in advance. That is why the order of operations matters. Define your invalidation level first, then size the position to fit it.
This article is for informational purposes only and should not be considered financial advice. Investors should conduct their own research and consult with financial professionals before making investment decisions. Past performance does not guarantee future results. These statements are speculative and subject to change based on market developments.