USD/CAD fell for a third straight session to about 1.3970 in Asian trading on Friday, 30 October 2026. The trigger came from a diplomatic phone call between Washington and Tehran, not from Canada’s economy, and that changes how any USD CAD forecast should read the slide.
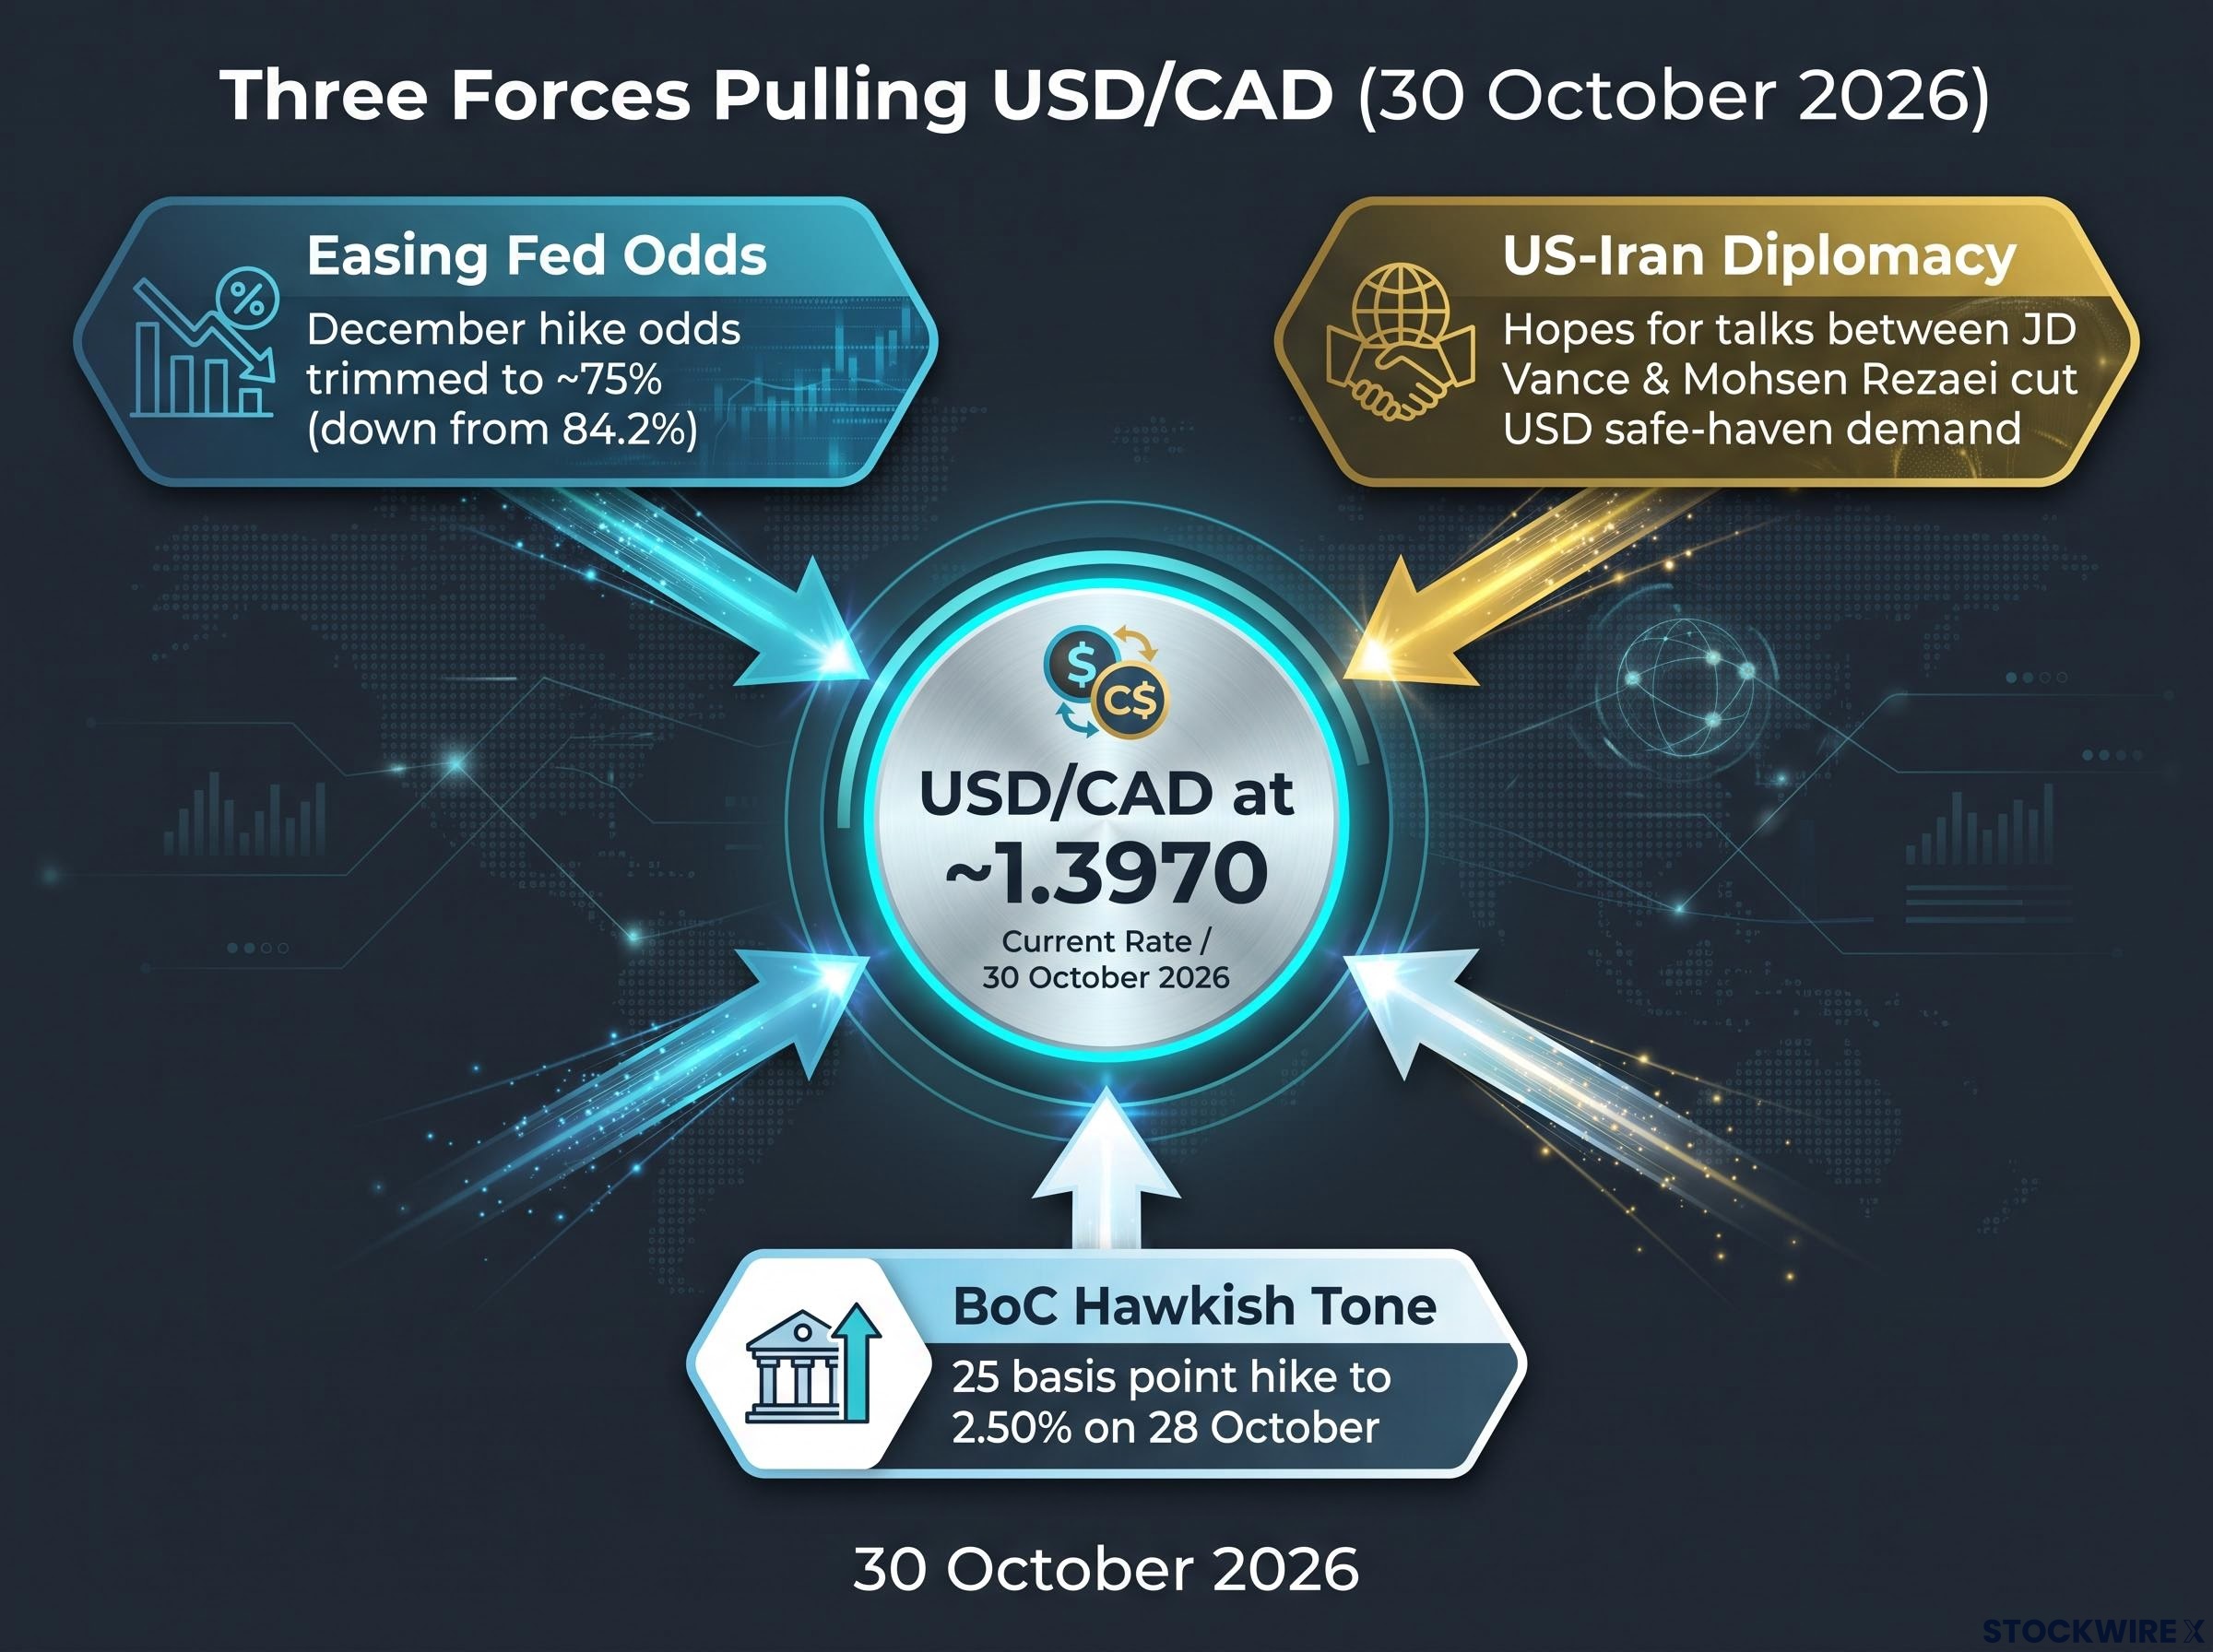
Three forces are pulling on the pair at once. Hopes for US-Iran talks have cut demand for the US dollar as a safe haven, traders have trimmed bets on a December Federal Reserve hike, and the Bank of Canada struck a mildly hawkish tone with its 25 basis point hike on 28 October. If you read this move as simple oil weakness, you risk misjudging both how far it can run and how fast it can reverse.
Here is how to separate the drivers that matter from the noise, along with the chart levels and triggers that frame the next leg.
Why is USD/CAD falling when oil is also easing?
On paper, the move looks backwards. Canada’s dollar, nicknamed the loonie, usually tracks oil because crude is the country’s largest export. Oil eased this week, yet the loonie gained.
The explanation sits on the other side of the pair. The Wall Street Journal reported that Vice President JD Vance contacted Mohsen Rezaei, Secretary of Iran’s Supreme National Security Council, on Wednesday to try to revive peace talks. President Donald Trump confirmed he authorised the outreach, though he said he did not know whether the talks would succeed.
Gulf-driven energy risk now transmits to currencies through two channels, short-lived risk sentiment and longer energy price shocks, which is why a diplomatic headline can move the dollar faster than crude itself.
That uncertainty matters. This is a possibility of de-escalation, not a deal or a ceasefire, and markets repriced on that possibility through three channels:
- Diplomacy: lower geopolitical risk reduced safe-haven buying of the US dollar.
- Oil and inflation: Brent settled near $114.88 and WTI near $102.00 on 29 October, modest declines, although the original FXStreet report described crude as stable after the news.
- Fed odds: easing oil-driven inflation fears tempered expectations of a December hike.
According to Bank of Canada daily rates, which have not been independently confirmed, USD/CAD stood at 1.3985 on 29 October, down from 1.4036 a day earlier. The dollar, not the loonie, is doing most of the moving.
The Fed odds shift
US data still argue for a hike. Preliminary Q3 GDP came in at 3.4% against a 3.2% forecast, although sources differ on whether that figure is annualised quarterly or year-on-year. Core PCE, the Fed’s preferred inflation gauge that strips out food and energy, ran at 3.1%, and initial jobless claims sat at just 194K.
December Fed hike odds Roughly 75%, down from 84.2% the previous day, per the original source.
Sources conflict here: Reuters cited CME FedWatch near 84.6% on 29 October. Either way, the direction is the same, and for you it means the pair’s decline reflects a fading dollar risk premium that could return quickly if talks stall.
What did the Bank of Canada’s hike change for the loonie?
The Bank of Canada lifted its overnight rate from 2.25% to 2.50% on 28 October, reportedly its first hike since 2023. Governor Tiff Macklem said the move aimed to stop elevated energy prices from turning into generalised inflation.
Reported figures, not independently verified, show Canadian inflation near 3% since April and expected near 3.5% by the end of 2026, with a return to the 2% target around mid-2028. Q2 GDP reportedly grew 3.3%.
The tone carried as much weight as the decision. Scotiabank strategists described a mildly hawkish message that nudged rate expectations higher and supported the loonie against other commodity currencies.
ING’s Francesco Pesole urged caution. ING expects one more 25 basis point hike, most likely in January 2027, but argues markets are overpricing about 90 basis points of tightening and keeps a year-end USD/CAD target of 1.420, calling oil the key swing factor.
| Institution | Stated view |
|---|---|
| Scotiabank | Cycle to continue; longer-run terminal rate near 3.25% |
| RBC | Gradual tightening; warns of growth risk in rate-sensitive sectors such as housing |
| ING | One more hike, rates peaking near 2.75%; year-end USD/CAD 1.420 |
| National Bank | USD supported through year-end, then weakening gradually in 2027 |
Where strategists disagree
The views fall into three camps. Scotiabank, CIBC and BMO argue energy inflation justifies pre-emptive tightening, RBC and TD doubt the economy can handle an aggressive cycle, and ING sees room for a hike but not as much as markets price.
The disagreement among strategists reflects a wider gap before the decision, when economists and traders split over whether the Bank would act, with markets pricing a hike that most surveyed forecasters did not expect.
A five-bank survey puts year-end 2026 USD/CAD estimates at roughly 1.38-1.43. The hike narrowed the expected rate gap with the US, which helps the loonie, but if oil drops, a dovish repricing could erase that gain.
What do the charts say about USD/CAD’s next move?
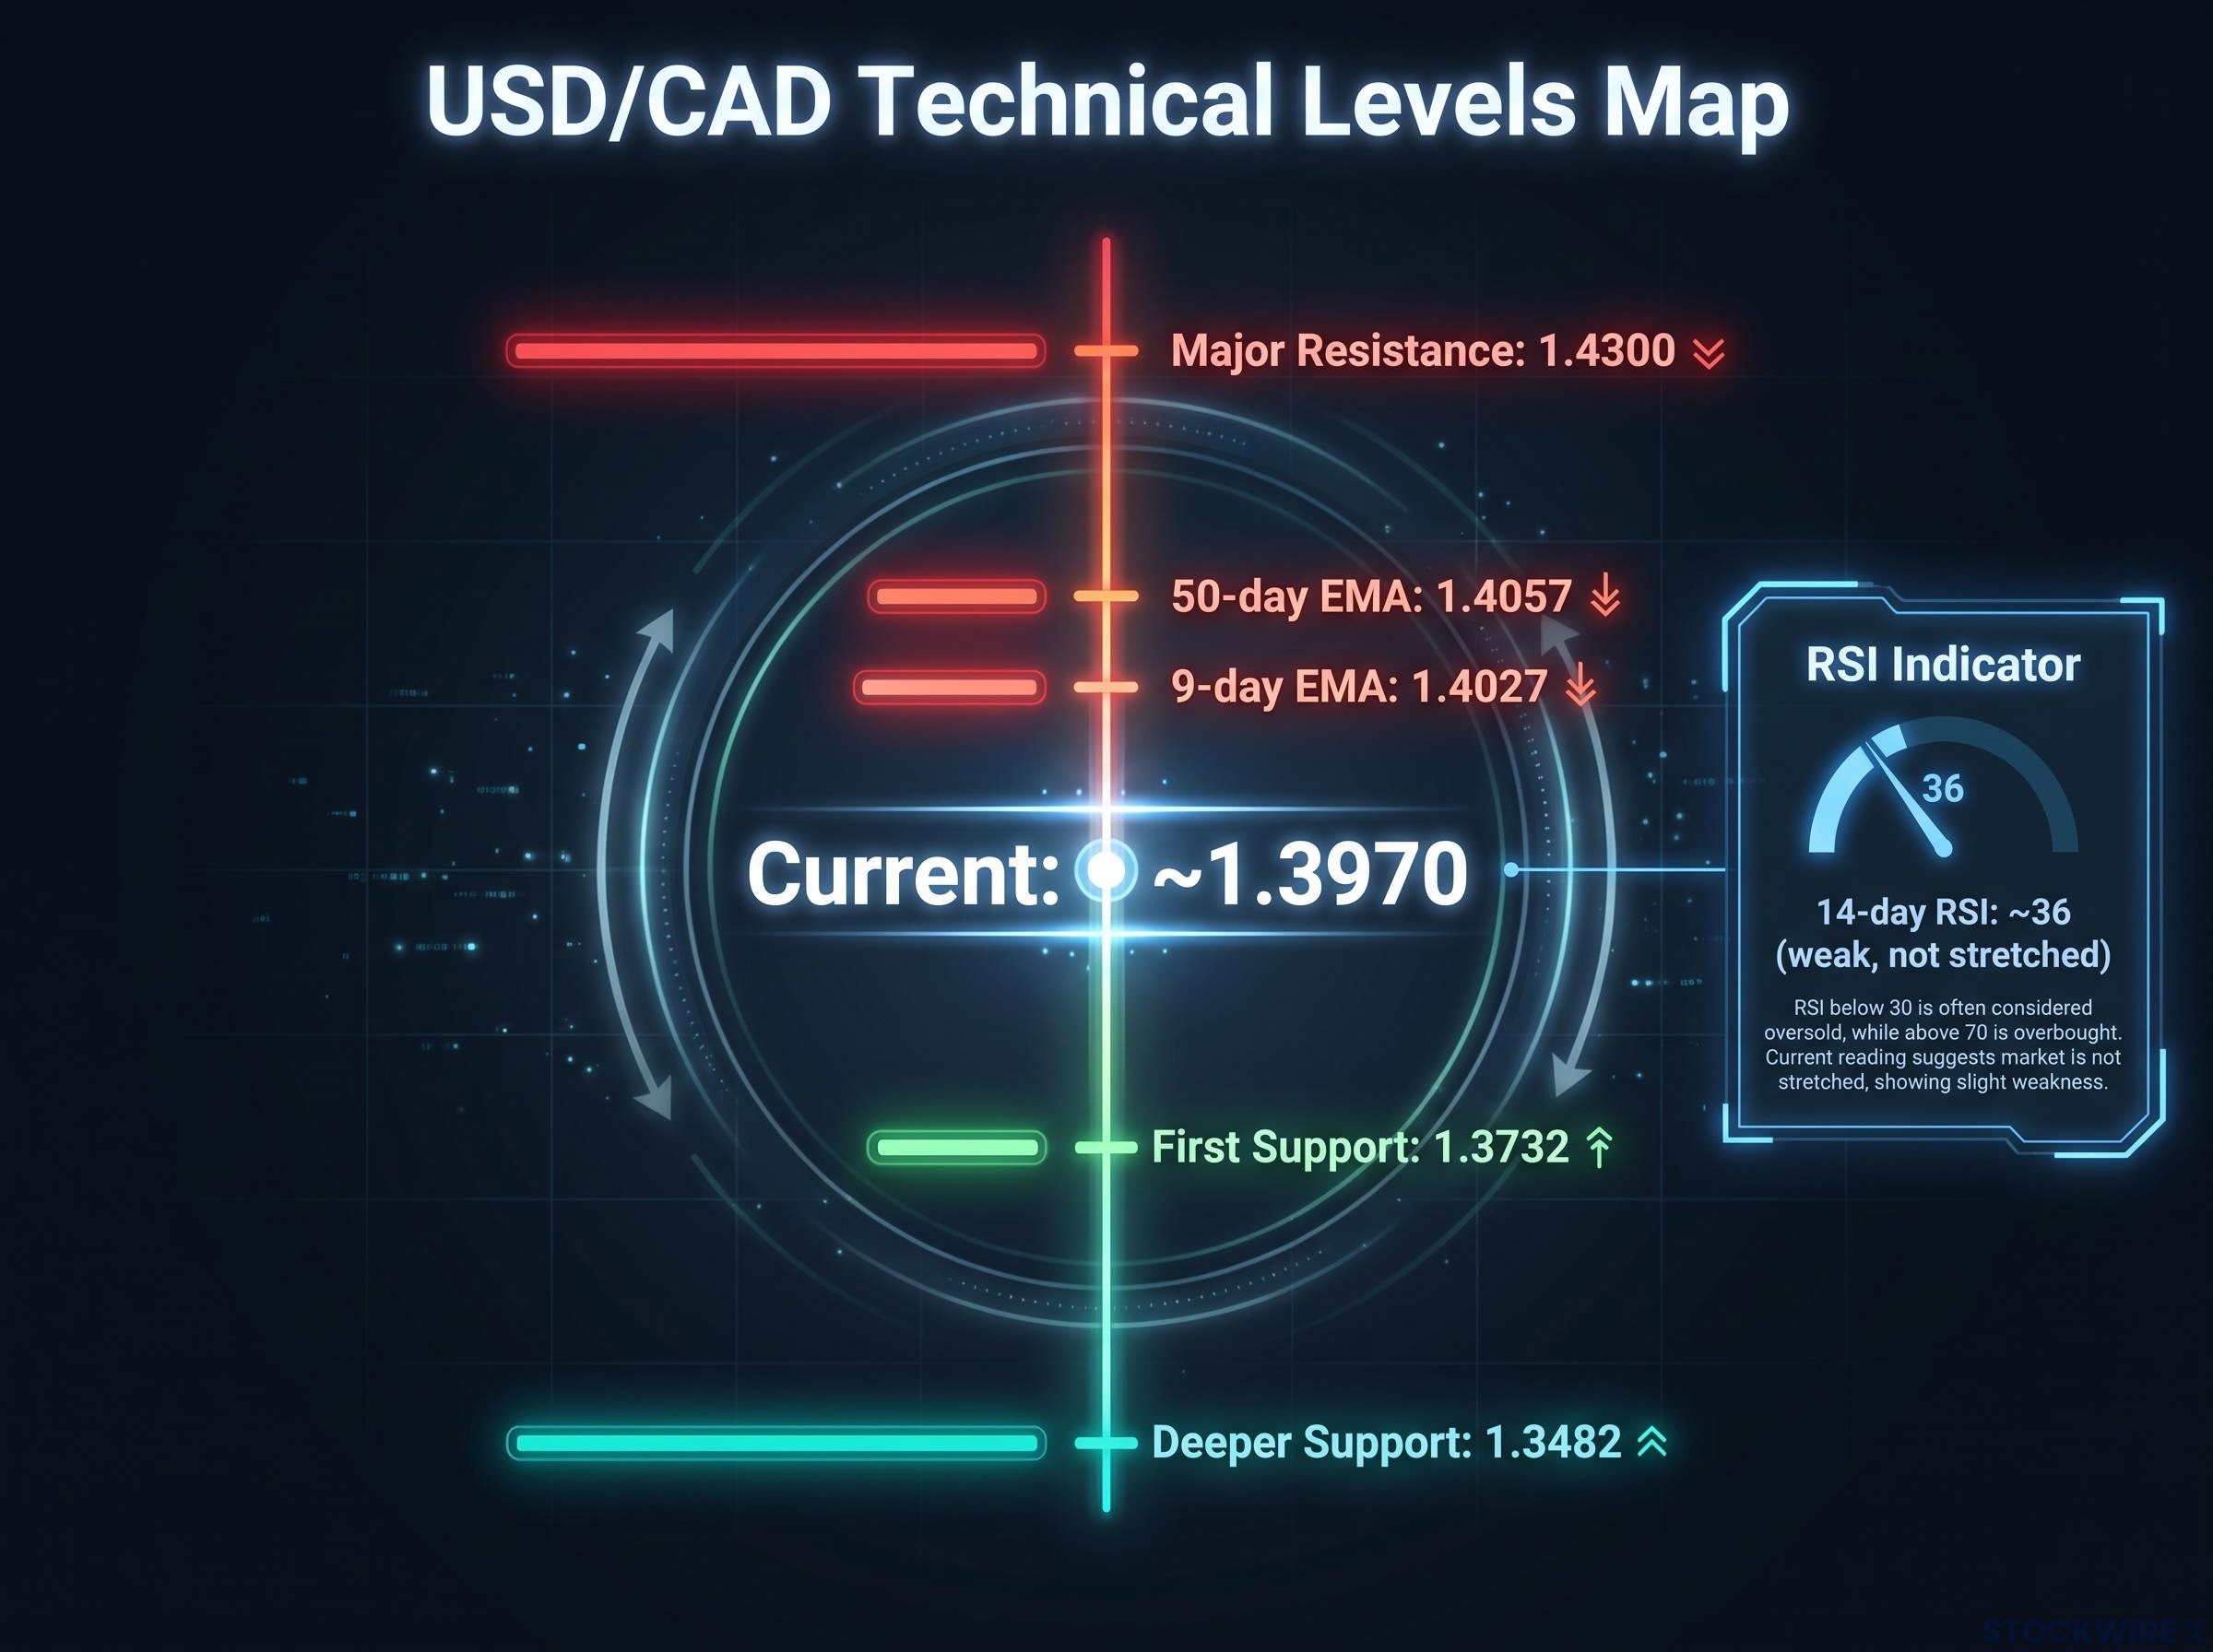
On the daily chart, the short-term bias is bearish. The pair trades below its nine-day and 50-day exponential moving averages (EMAs), which are average prices that weight recent sessions more heavily. The 14-day Relative Strength Index (RSI), a momentum gauge where readings below 30 signal oversold conditions, sits near 36: weak, but not stretched.
| Indicator or level | Value |
|---|---|
| USD/CAD | About 1.3970 |
| Nine-day EMA (resistance) | About 1.4027 |
| 50-day EMA (resistance) | About 1.4057 |
| Major horizontal resistance | Near 1.4300 |
| First support | 1.3732 |
| Deeper support | 1.3482 |
| 14-day RSI | About 36 |
Treat these as a map of where momentum could stall, not a prediction. An RSI of 36 is not a confirmed reversal signal.
The broader loonie checklist stays steady:
- Oil prices, as Canada’s largest export
- Bank of Canada rates relative to the Fed
- Risk sentiment, which favours the loonie when appetite is strong
- The US economy, since the US is Canada’s largest trading partner
What could change the picture
Four risks could flip the move:
- Talks collapse, restoring oil and safe-haven premiums
- Oil rebounds on renewed attacks or shipping disruption
- The US dollar recovers on strong growth and inflation data
- Trade tensions between the US and Canada resurface
Oil cuts both ways in a crisis. Higher crude normally helps Canada, but geopolitical shocks can lift the US dollar faster through inflation fears and risk aversion.
The oil-dollar correlation has flattened well below its historical baseline, so crude moves alone no longer explain dollar direction, and rate normalisation elsewhere is doing more near-term currency work.
What the slide tells you, and what it does not
This decline looks like a cyclical, positioning-driven repricing, not the start of a durable one-way trend for the loonie. No verified comparable de-escalation episode exists to show how far such moves typically run.
Your next step is to watch the variables that will decide direction: whether US-Iran talks progress or stall, which way oil breaks, how December Fed pricing settles, and whether the Bank of Canada sees energy costs feeding into wages and prices. If two or more of those turn against the loonie, the 1.4027-1.4057 EMA zone becomes the first test.
Past performance does not guarantee future results. Financial projections are subject to market conditions and various risk factors.
This article is for informational purposes only and should not be considered financial advice. Investors should conduct their own research and consult with financial professionals before making investment decisions.