Brent crude sat near US$109 a barrel on 28 October 2026 and the Federal Reserve sounded hawkish. Even so, 10-year and 30-year Treasury yields fell, and the dollar slipped back from an 18-month high. The chain that had run through every stage of the Iran war (oil higher, bond yields higher, dollar stronger) stopped working.
That break caught out traders positioned on the old pattern. Many expected a hawkish Fed to push the dollar and long-dated yields higher again. Neither happened.
The explanation is not in the wording of the Fed statement. It is in what markets had already priced before the statement arrived.
This analysis gives you a way to tell what is already in the price, which cross-asset signals still deserve your trust, and where the next break in the pattern could come from, whether in Washington, Paris or the bullion market.
Why did oil rise while yields and the dollar fell?
The numbers look like a contradiction at first. Brent settled at US$116.72 on 23 October after a more-than-10% run in October. Long Treasury yields should have climbed with it. They went the other way.
| Measure | Level around the Fed meeting | October move |
|---|---|---|
| US 10-year yield | ~4.95% (28 Oct) | Down from ~5.10% on 15 Oct |
| US 30-year yield | ~5.37% (28 Oct) | Down from ~5.48% on 15 Oct |
| US Dollar Index (DXY) | About 0.2% lower on 28 Oct | 18-month high earlier in October, then weakened |
| Brent | ~US$109.46 (28 Oct) | Settled at US$116.72 on 23 Oct, then retreated |
| WTI | ~US$100.89-$102.80 (28 Oct) | Up more than 10% by 23 Oct |
Note: intraday and official-close figures differ. Treasury yields above use the US Treasury’s official daily curve; the 10-year traded near 5.03% shortly after the decision.
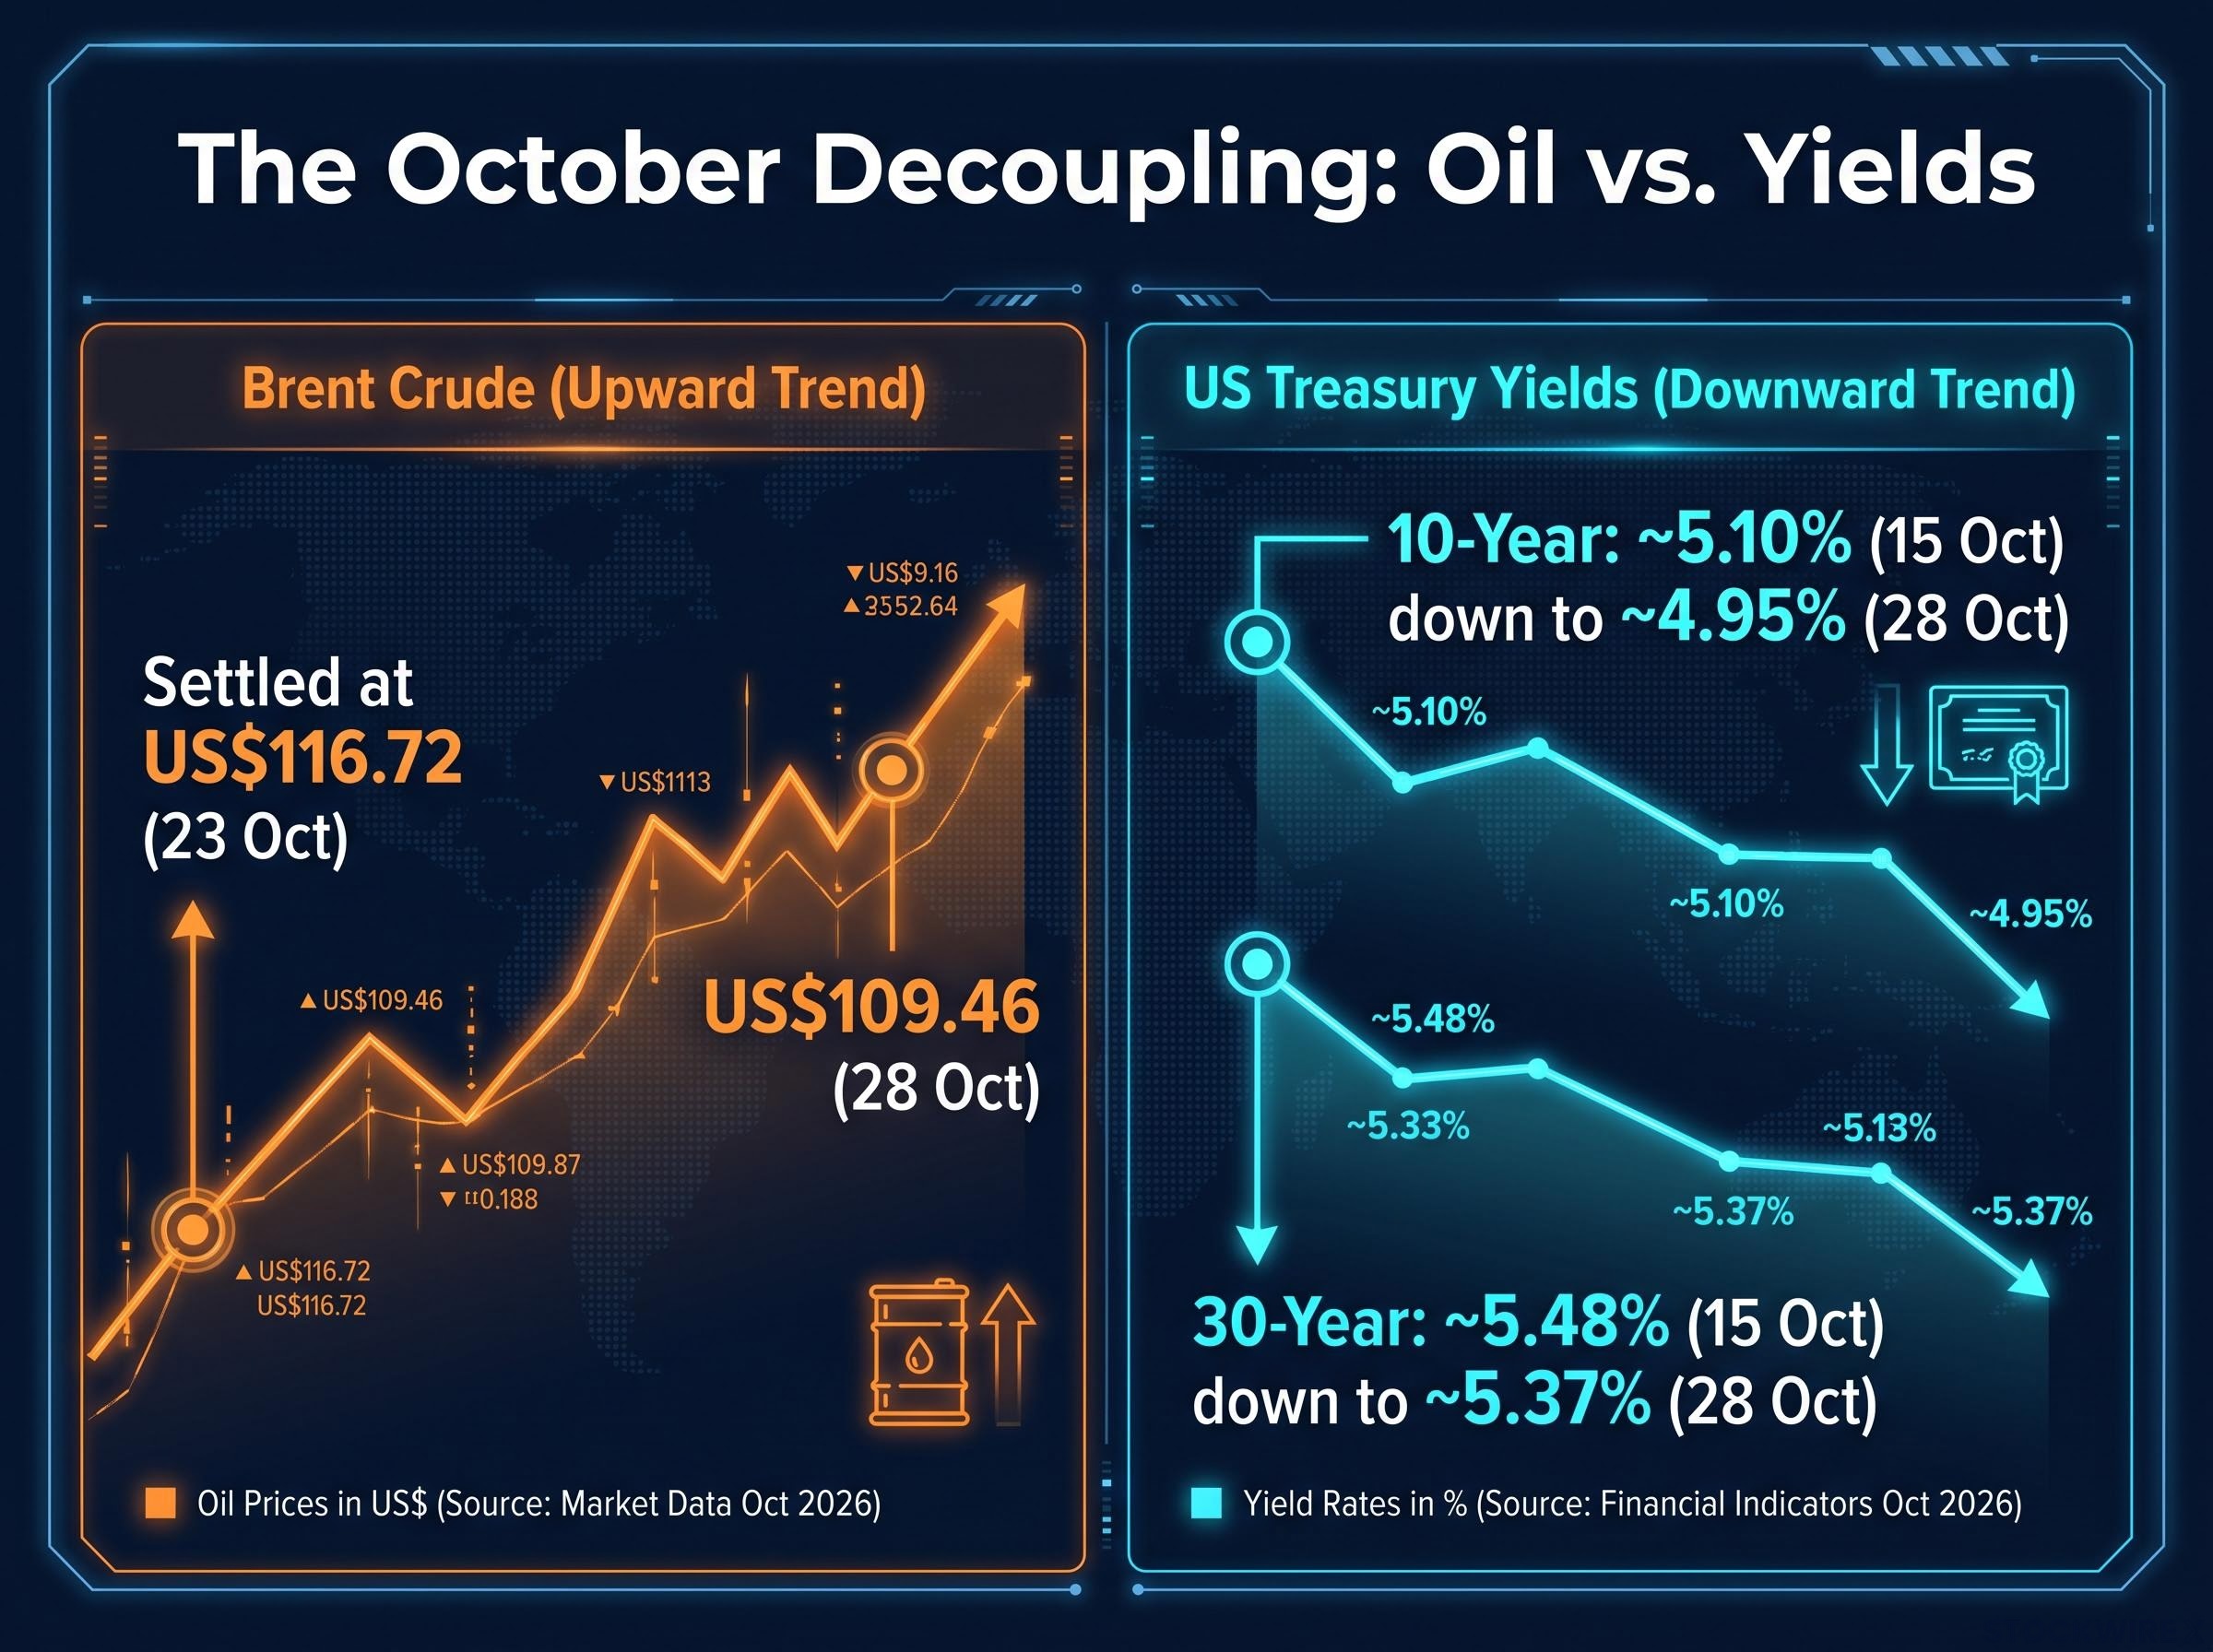
In 2022, oil, inflation and Fed tightening lifted yields and the dollar together. This time, oil carried two messages at once. It signalled inflation, which supports hikes, but it also signalled slower global growth and lower risk appetite, which pulled money into long-dated Treasuries.
The long end of the curve answers to more than the policy rate. A Reuters poll of nearly 60 strategists projects the 10-year at about 5.00% by year-end, 4.90% in six months and 4.75% in a year, a path driven by term premium (the extra yield investors demand for locking money away longer), fiscal supply and hedging flows.
Five forces behind the split
- Oil raised inflation fears while also stoking growth fears that drove buying of long bonds.
- Fed hawkishness was already priced, so more oil news moved short-dated yields less.
- Term premium and expected Treasury supply set the tone at the long end.
- Safe-haven demand favoured Treasuries without lifting the dollar, which was already stretched.
- The front end held up on hike pricing while the long end fell, steepening the curve.
The oil-dollar link is unstable. Oil can lift the dollar through Fed tightening, but weaken it when markets treat oil as a tax on growth or focus on US fiscal risk. For you, “oil up” no longer maps to a single trade, and any strategy built on that shortcut carries hidden risk.
When big ASX news breaks, our subscribers know first
What does priced-in hawkishness actually mean?
On 28 October, the Fed under Chair Kevin Warsh held its target range at 3.75%-4.00%. It upgraded its description of growth from “solid” to “strong”. The vote was 10-2, with Governor Lisa Cook and Cleveland Fed President Beth Hammack dissenting in favour of an immediate hike.
That sounds like a dollar-positive outcome. To see why it was not, you need to separate two kinds of information:
- What the Fed says: the dot plot, a chart of officials’ projections for rates, which is a forecast conditional on how the economy evolves. In September it pointed to a 2026 peak with two hikes, none in 2027 and gradual cuts from 2028.
- What the market prices: fed funds futures, contracts whose prices imply the probability of rate moves, with risk premia and hedging demand mixed in.
The gap between the dot plot and futures pricing is the central tension here; when the committee underestimated how long it needed to stay tight in 2021-2023, the more hawkish futures path proved closer to reality.
December hike odds CME FedWatch showed about an 85.7% probability of a hike at the 9 December meeting immediately after the decision. A weekly reading in the original source showed about 77.5%; the gap reflects when each was observed.
With that much already priced, the hawkish tone added little. Futures-implied tightening for 2026 fell to 38 bp from over 50 bp. After the 25 bp hike delivered in September, that leaves about 13 bp, roughly a 52% chance of another hike this year. For 2027, a second hike is now roughly a coin toss, leaving markets and the Fed about 25 bp apart, according to the original source. Reuters, writing on 13-14 October, put pricing at about 75 bp of tightening by late 2027; sources split the 2026 and 2027 numbers inconsistently.
The lesson for you: judge a surprise against pricing, not against the tone of the statement.
Was the Fed ahead of or behind the market?
One reading says the Fed lagged: two dissents for a hike, with futures already near 86% for December. The other says it was ahead, keeping a restrictive path conditional while markets priced only a near-term insurance hike.
Both can hold. Long yields can fall while futures price hikes if investors expect tightening to damage growth and inflation.
Is Europe’s bond stress the next stage of the story?
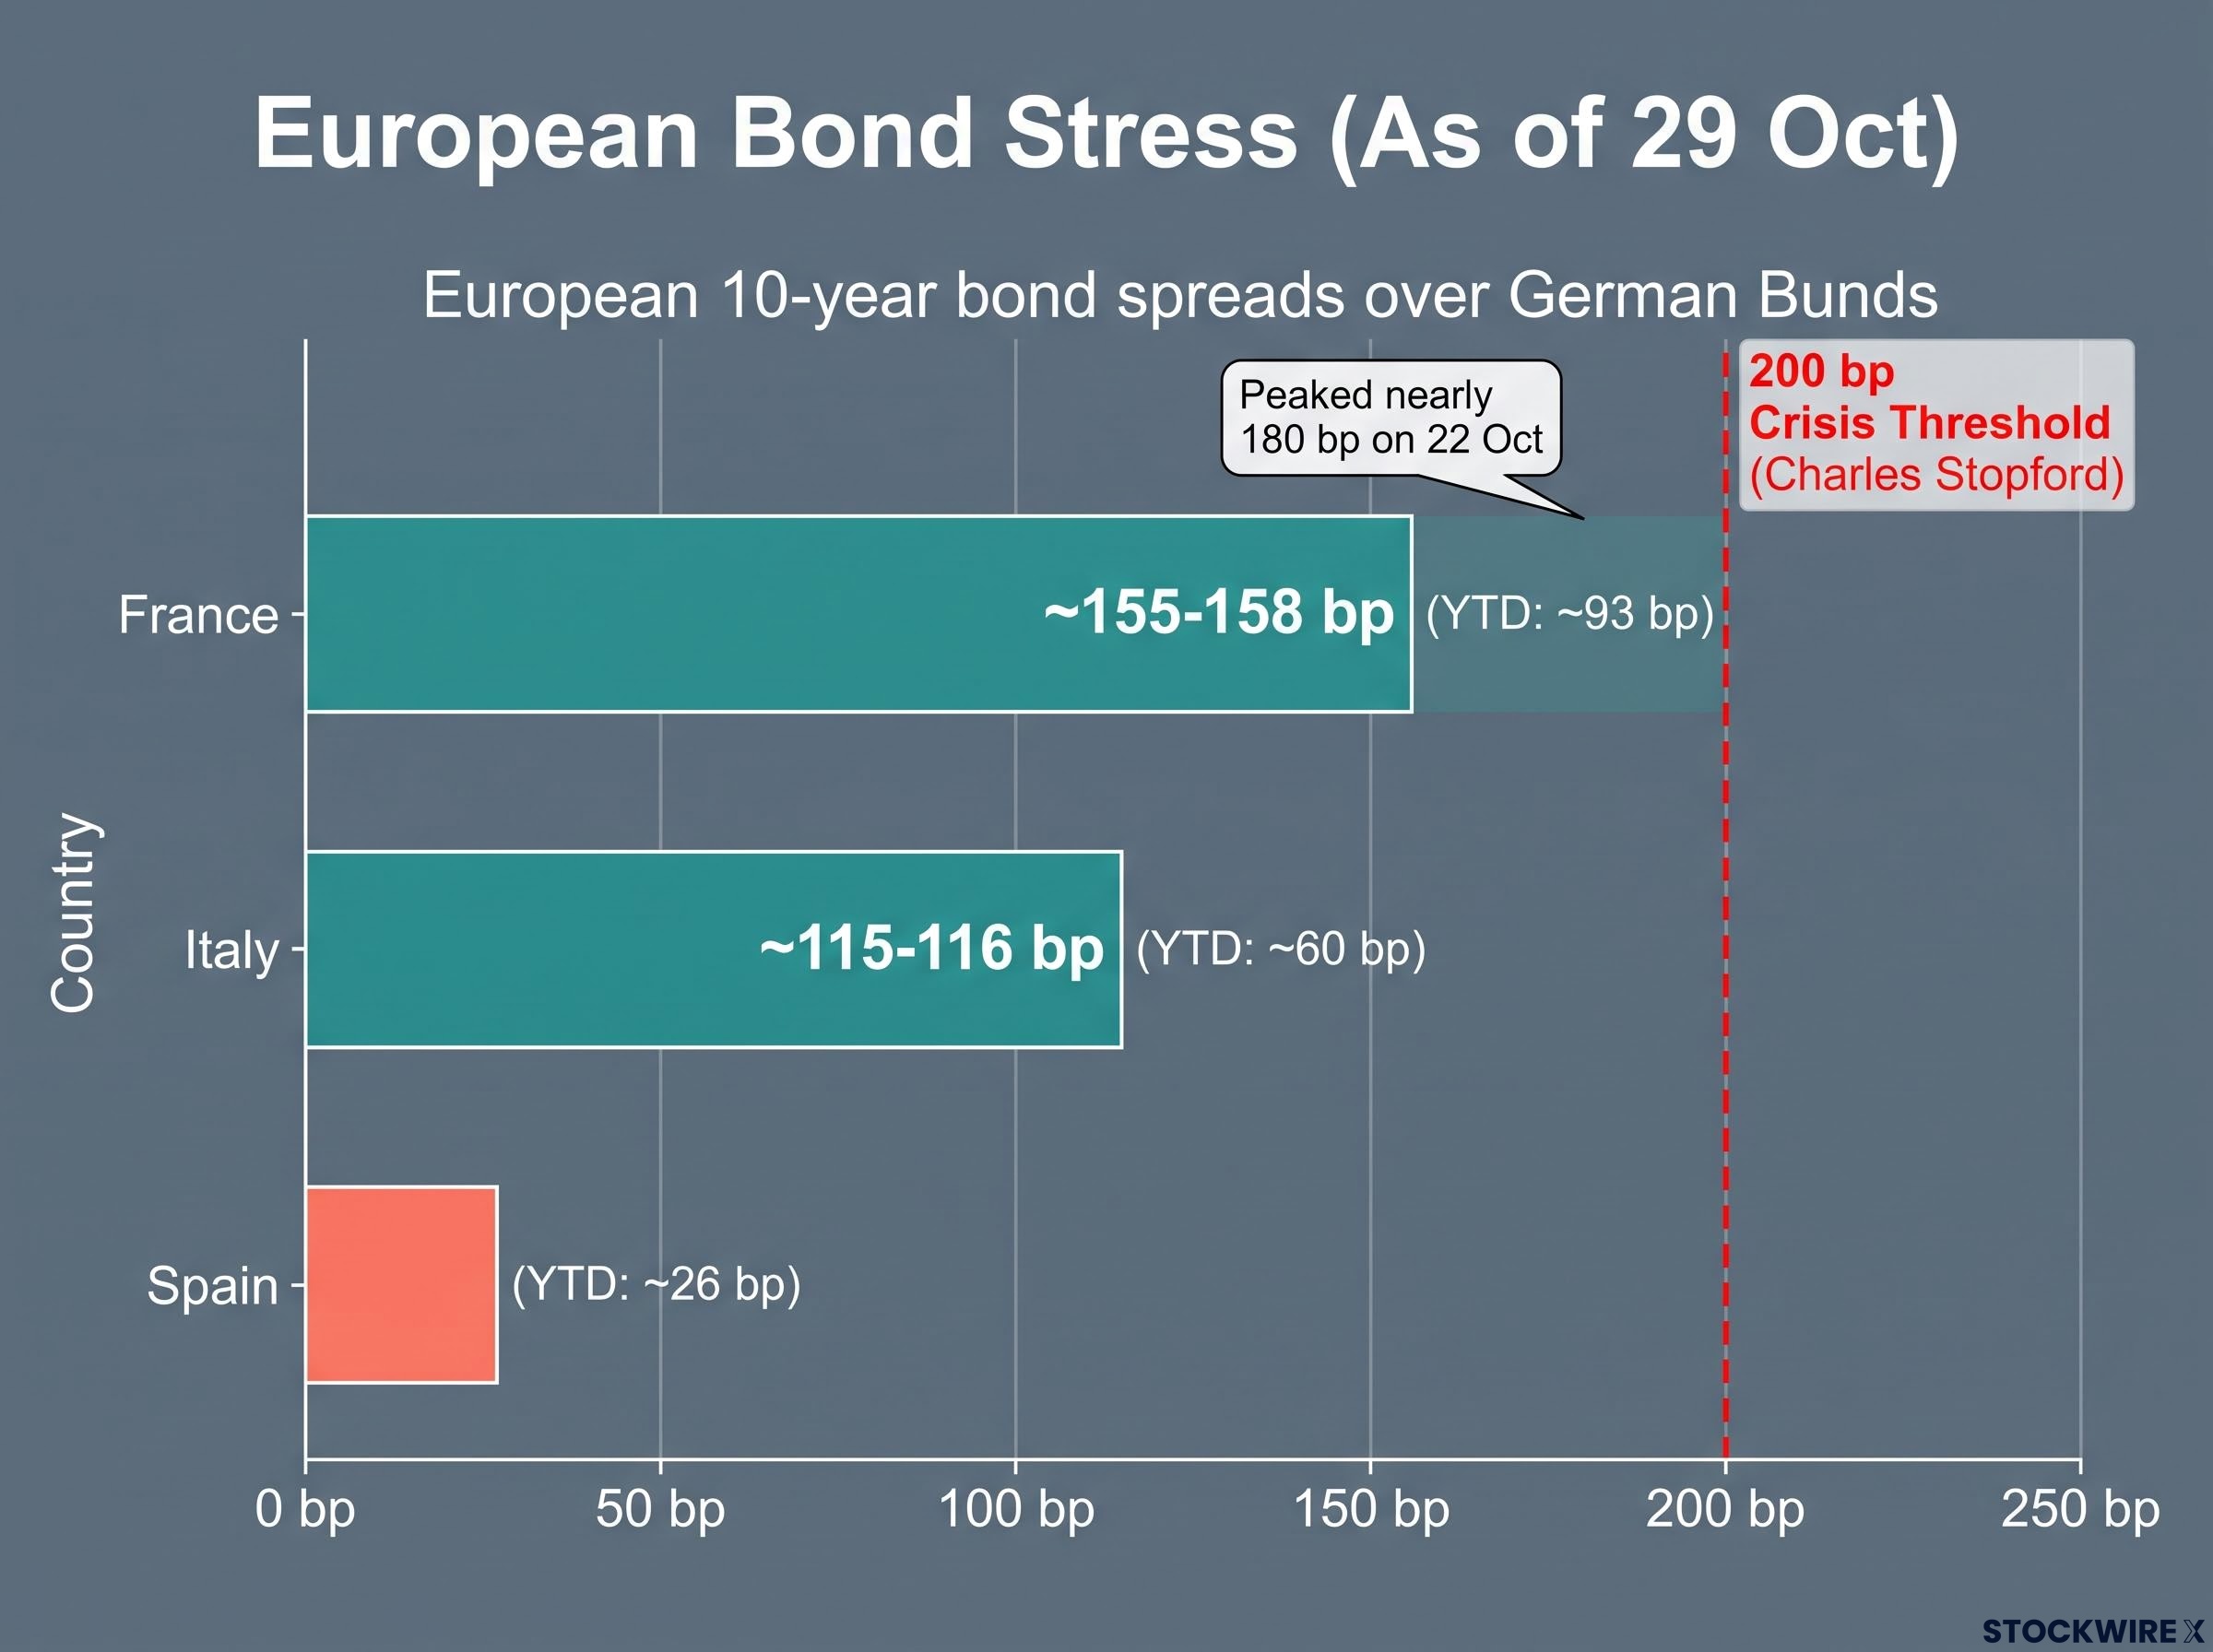
France has become the focal point. Its 10-year spread over German Bunds (the extra yield investors demand to hold French debt instead of German) moved from about 150 bp on 21 October to nearly 180 bp on 22 October. That puts it wider than Italy, Spain and Greece, despite France’s stronger credit standing.
| Country | 10-year spread over Bunds (29 Oct) | Year-to-date widening (JPMorgan) |
|---|---|---|
| France | ~155-158 bp | ~93 bp |
| Italy | ~115-116 bp | ~60 bp |
| Spain | n/a | ~26 bp |
The original source described the French spread as reaching levels not seen since 1999. Other analysts compared it with the 2011 euro-area crisis. Analysts point to fiscal deterioration, political fragmentation and budget uncertainty.
Analysts see a budget rollover as the most probable outcome in Paris, a path that could push the 2027 deficit toward 6.0% of GDP and keep spreads under pressure.
The contagion picture is calmer than the headline numbers suggest:
- Safeguards: stronger banks, deeper institutional integration and more tools against fragmentation than in the early 2010s, according to JPMorgan and CNBC analysts.
- Triggers: spreads approaching 200 bp, which Ninety One’s Charles Stopford says would likely mark a full crisis, or a wider political or banking shock.
Other analysts put broad contagion odds at only 10%-20%. Meanwhile the euro has not sold off and may be forming a double bottom, while the pound and Canadian dollar look firm and the Australian dollar somewhat heavy. A euro holding up through French stress tells you markets are punishing the dollar more than they fear Europe. That is a fragile balance, not a vote of confidence in the euro area.
What did Lagarde’s early exit change for the euro?
Yesterday, 29 October 2026, European Central Bank (ECB) President Christine Lagarde announced she would leave early.
The timing gap Exit date: 7 February 2027. Scheduled term expiry: October 2027. That is roughly nine months early.
The facts and the commentary need separating:
- Stated: Lagarde wants greater freedom of expression and room to engage on issues beyond monetary policy.
- Speculated: commentators linked the timing to EU leaders choosing a successor while Emmanuel Macron is still French president, ahead of France’s 2027 election. The original source’s presenter also floated a possible French candidacy, which no other coverage reported as fact.
Markets read the news as positive for the euro. For you, a central bank succession is a pricing event about institutional continuity. The useful question is not that she is leaving, but who replaces her and how markets read that person’s stance.
Why did gold and silver fall when yields fell?
Falling Treasury yields normally help bullion, because gold pays no interest and lower yields reduce what you give up by holding it. Yet gold fell about 3% to roughly US$4,156.45 an ounce on 26 October, a more-than-seven-week low, before rebounding to about US$4,312.05 on 29 October.
The resolution runs back through oil. Markets read the oil shock as inflationary, which lifted expected policy rates and real yields (returns after inflation), raising the cost of holding metal. UBS analyst Giovanni Staunovo attributed gold’s weakness mainly to higher oil and rising odds of further Fed hikes.
Heraeus describes gold as caught between three forces:
- Oil-driven December hike odds pushing it down
- Falling Treasury yields offering support
- Treasuries competing with gold for safe-haven money
Invesco adds a structural point: central-bank buying since Russia’s reserves were frozen has weakened gold’s usual inverse link with real yields. Technically, gold was rejected at a former range top and is trading in a US$4,000-$4,300 band. Silver, at about US$63.83 on 29 October, broke support more forcefully; the presenter’s “below 50” target is a technical scenario, not a forecast, and sits well under current prices.
The read for you: watch the oil-to-hike-probability link, and treat falling Treasury yields as a weaker bullion signal in this regime.
Risks that could break the pattern
- The dollar could rebound if the conflict intensifies or December pricing moves to certainty.
- Oil could reverse sharply on diplomatic or military news.
- French fiscal and political stress could worsen and turn systemic.
- The long bond sits at a critical inflection level and could break either way.
- The Fed could face credibility questions if it fails to tighten with oil elevated.
Each risk maps to an indicator you can track, which is where the final section picks up.
For readers wanting to test portfolios against the oil scenarios above, our deep-dive into oil and bond risk explains why futures keep elevated crude priced into 2027.
Past performance does not guarantee future results. Forecasts and projections cited here are subject to market conditions and various risk factors.
Reading the signals: what to watch before the December meeting
October’s decoupling does not prove the war trade is over. It proves that pricing versus guidance, and how each part of the yield curve reacts, matter more than any single headline.
Before 9 December, five gauges deserve your attention:
- December hike probability, and whether it moves towards certainty
- The long bond at its inflection level
- DXY direction
- Brent’s response to diplomatic news
- French spreads against Ninety One’s 200 bp marker
Gaps remain, including no reported EUR/USD level around the meeting. The decision point is simple: if those gauges move together again, the old chain is back; if they keep diverging, trade the drivers, not the shortcut.
This article is for informational purposes only and should not be considered financial advice. Investors should conduct their own research and consult with financial professionals before making investment decisions.