
Falling house prices sound like a problem for property stocks. That view misses most of the exposure. Every capital city bar Darwin lost value in the September quarter, national home values now sit 5.2% below their March 2026 peak, and Morgan Stanley now expects a 10-15% peak-to-trough fall, making this Australian housing downturn a story about banks, developers and household spending across the ASX 200.
The slump has two causes. A cyclical rate shock has lifted the cash rate to 4.60% after four hikes in 2026. A tax reset taking effect on 1 July 2027 sits on top of that shock.
Misreading which sectors are housing-sensitive works in both directions. You could hold more exposure than you realise through a bank or a building supplier. You could also avoid a business that might hold up better than its label suggests.
Here is a framework for sorting ASX 200 exposure by how housing weakness reaches each sector, and the signals that show whether the damage is spreading.
How deep could the fall go, and why do forecasters disagree?
Start with what has already happened. Cotality’s October chart pack showed national dwelling values fell 1.1% in September 2026, the sixth monthly decline in a row. Values dropped 3.7% across the September quarter.
The weakness is broad, though some cities are falling faster than others:
- Sydney: -1.4% in September, -8.6% from its February 2026 peak
- Brisbane: -1.5%, the sharpest monthly fall among the capitals
- Adelaide: -1.3%
- Perth: -1.2%
- Melbourne: -0.7%
- Darwin: +0.5% for the quarter, the only capital to rise
Forecasters agree prices are heading down. They disagree on how far, and the spread between the mildest and harshest calls is wide.
Falls are not confined to cheaper suburbs; premium coastal markets show how high price levels and positive momentum have decoupled, with stress-tested borrowing capacity thinning the discretionary buyer pool.
Westpac initially projected a 7.3% peak-to-trough decline. It has since revised that to just over 10%. The size of that move shows how quickly the consensus has shifted in a matter of weeks.
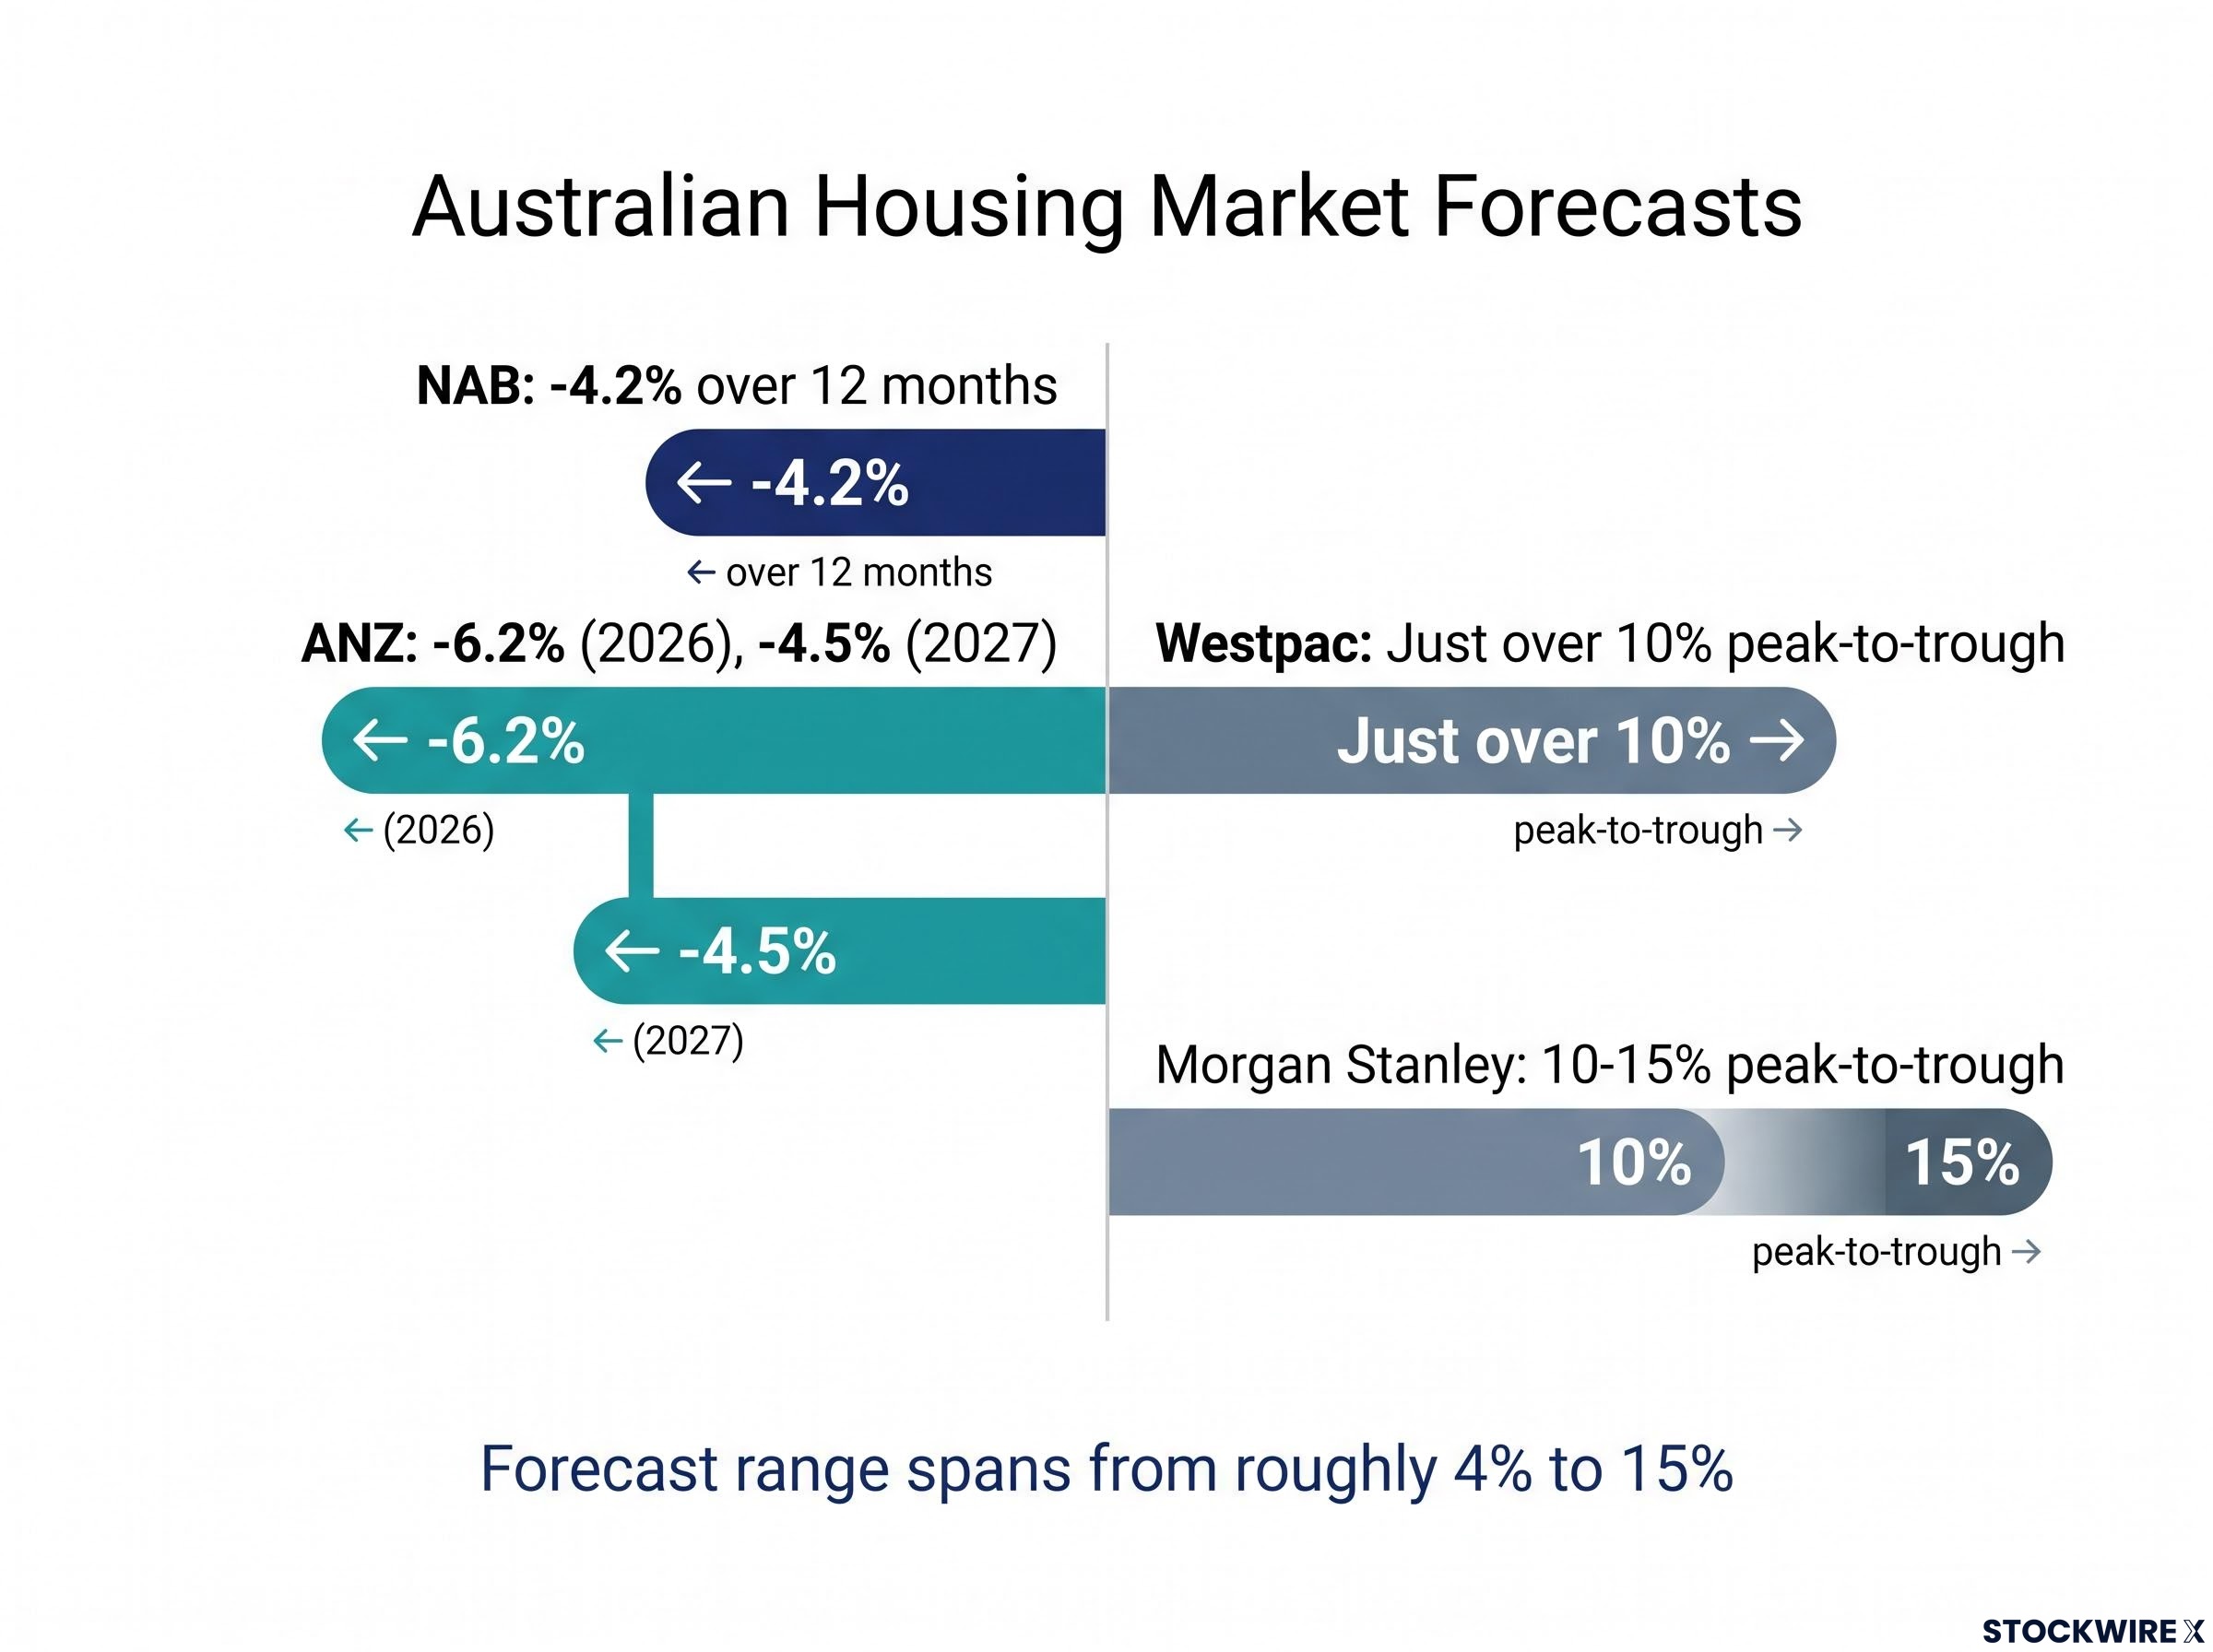
| Source | Peak-to-trough or period view | Timing or trough | Key assumption |
|---|---|---|---|
| NAB survey | -4.2% over 12 months | Next 12 months | RBA broadly on hold, with risk of further hikes |
| ANZ | -6.2% (2026), -4.5% (2027) | Recovery of +3.6% in 2028 | Another hike, no cuts until November 2027 |
| Westpac (revised) | Just over 10%: Sydney 12%, Melbourne 8%, Brisbane 4%, Perth and Adelaide 2% | Larger falls in Sydney and Melbourne | Tight on-market supply limits the decline |
| Morgan Stanley | 10-15% (up from 5-10%) | Second half of 2027 | Rate hikes, tax changes and weaker credit demand combine |
The bearish end of the range Morgan Stanley expects a 10-15% national decline, with a trough in the second half of 2027 and no meaningful recovery before then. According to secondary coverage, including the AFR, the bank says this could become Australia’s largest nominal housing downturn in more than 40 years.
The primary Morgan Stanley note is not publicly available. UBS, Goldman Sachs and Macquarie have no accessible current forecasts.
The forecasts run from about 4% to 15%, so the downside is a genuine range. You are better served sizing your exposure against a band of scenarios than against any single headline number.
When big ASX news breaks, our subscribers know first
What is driving the slump: rates, tax changes and credit?
The forecast spread makes more sense once you see that three separate forces are stacking:
- Rates: higher repayments and smaller loans
- Tax: weaker after-tax returns for investors in established property
- Credit: fewer mortgage applications and slower loan growth
Rates and credit
On 29 September 2026, the Reserve Bank of Australia (RBA) raised the cash rate by 25 basis points to 4.60%. A basis point is one-hundredth of a percentage point. The cash rate is the benchmark interest rate that banks use to price their loans.
This was the fourth rise of 2026, and it took the cash rate to its highest level in roughly 15 years. Each hike increases repayments on variable mortgages. It also lowers the amount a bank will lend a buyer, which caps what they can bid at auction.
Lending data shows the effect. Mortgage applications sit about 20% below second-quarter levels. Investor applications are down about 26% and owner-occupier applications are down 18%. Morningstar expects home-loan growth of 2.5% in fiscal 2027, compared with 6.8% in fiscal 2026. The RBA’s October Financial Stability Review linked the weaker demand for housing credit to both the higher cash rate and the tax changes.
The tax reset and grandfathering
The May 2026 federal budget changed how property investors are taxed. Negative gearing allows investors to deduct rental losses from their wage or business income. The capital gains tax (CGT) discount halves the taxable profit on an asset held for more than a year.
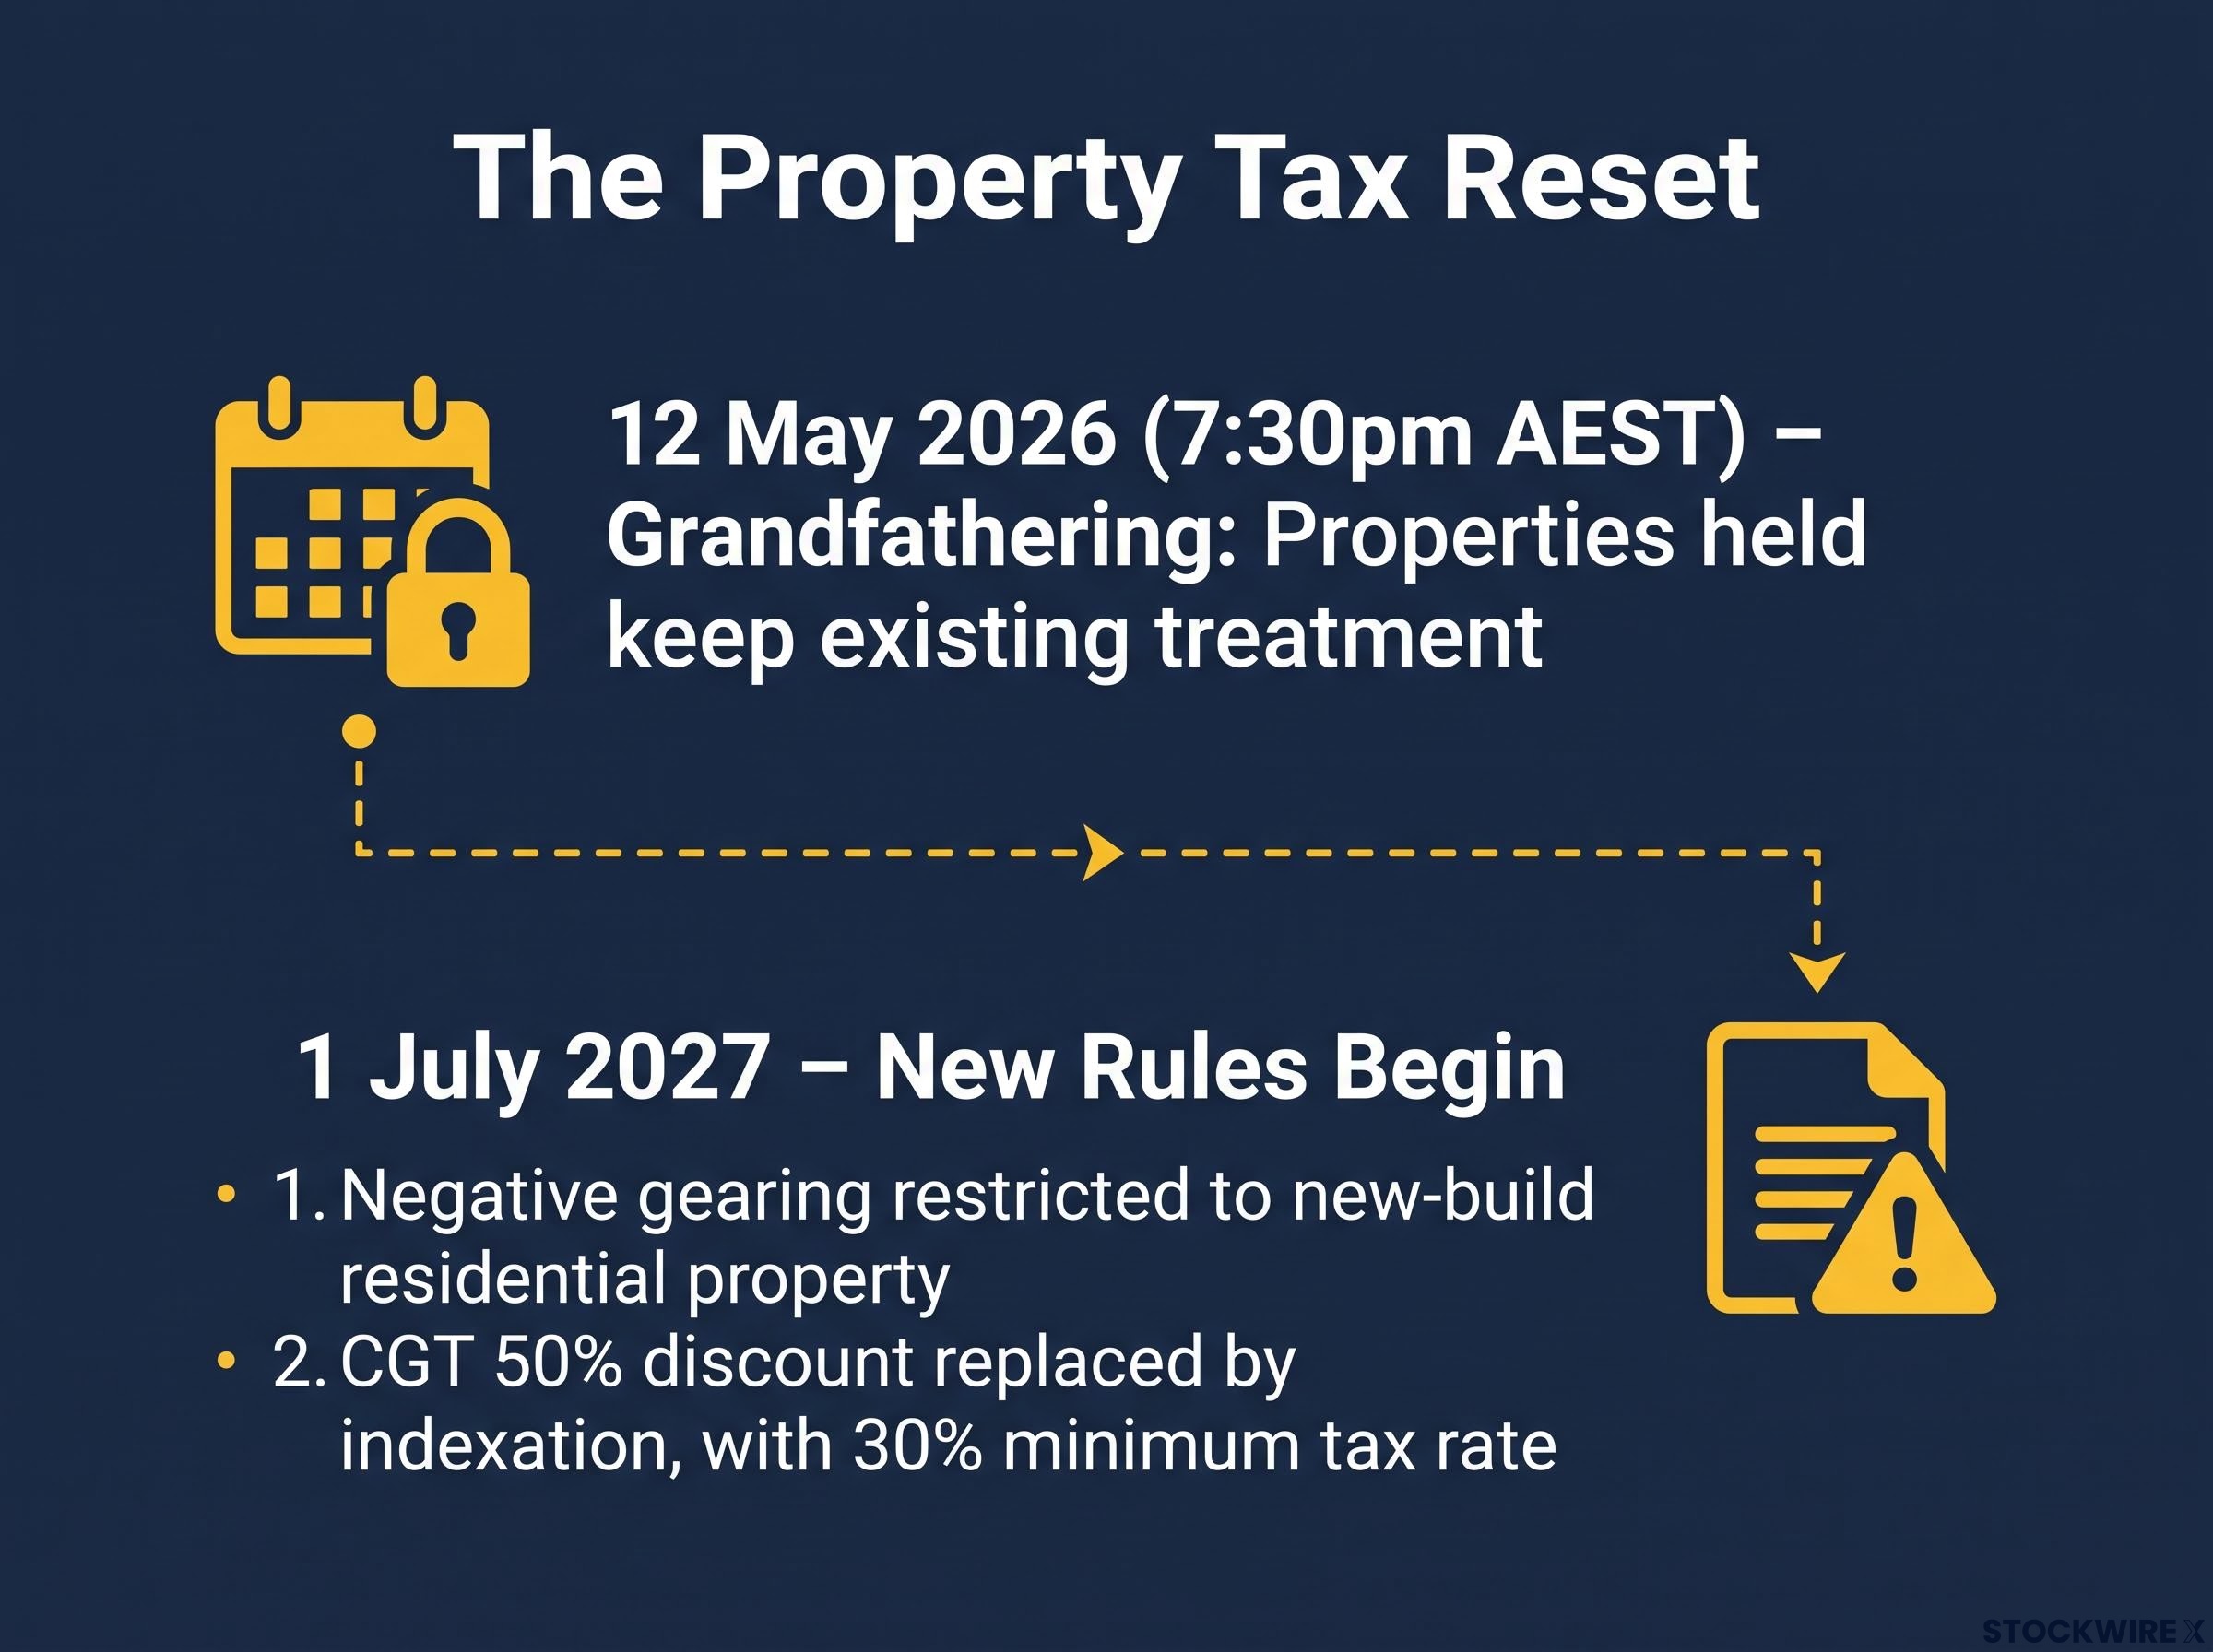
| Measure | Change | Start date |
|---|---|---|
| Negative gearing | Restricted to new-build residential property | 1 July 2027 |
| CGT discount | 50% discount replaced by indexation, with a 30% minimum tax rate | 1 July 2027 |
| Grandfathering | Properties held at 7:30pm AEST on 12 May 2026 keep existing treatment | Ongoing |
Indexation adjusts a property’s purchase cost for inflation, so investors pay tax only on the gain above inflation. Treasury describes the package as redirecting tax support toward new housing supply.
For top-rate taxpayers, cost base indexation plus a 30% minimum tax can lift the effective rate on gains well above the old discounted level, which sharpens the incentive to sell before the deadline.
The rules do not apply yet. However, investors are already recalculating their expected returns, and that is enough to change behaviour. Investor selling pressure may therefore build toward July 2027 rather than ease, which is a strong reason to doubt any forecast that has the market recovering early.
Which ASX 200 sectors are exposed, and which could hold up?
Housing weakness reaches the share market through a chain. It starts with households, then moves through the banks that lend to them, the developers that sell to them, and the suppliers that build for them.
Why this reaches beyond property Morningstar notes that housing makes up close to 70% of Australian household wealth. A sustained decline could therefore turn into a broader economic problem.
Banks: margins versus arrears
Banks are a two-sided case. Higher rates can widen net interest margins, which measure the gap between what a bank earns on loans and what it pays for funding. Slower lending and rising bad debts work in the opposite direction.
Westpac’s fiscal Q3 2026 result shows both forces. Morningstar reported underlying profit of $1.8 billion, up 2%, on loan growth of 2%. Higher impairments, meaning loans the bank does not expect to recover in full, and stronger competition absorbed much of the margin benefit.
Capital buffers mean a correction does not imply a banking crisis. For bank shareholders, the earnings question is whether arrears stay contained.
For readers wanting the bank-by-bank impact, our deep-dive into Morgan Stanley’s housing call and ASX bank earnings shows why CBA ranks last in its post-downgrade preference order.
Developers, suppliers and relative beneficiaries
Developers face falling site values, fewer presales and tougher financing, while wage and materials costs keep rising. Mirvac pointed to its October results as evidence that four rate rises had hurt buyer confidence. CBA economists say weaker demand for established property limits builders’ ability to pass on construction costs. No attributable downturn reaction was found for Stockland, Goodman or Lendlease.
| Sector | Transmission channel | Likely direction | Key swing factor |
|---|---|---|---|
| Major banks | Loan growth, margins, impairments | Mixed | Arrears trend |
| Established-home developers | Presales, site values, financing | Negative | Buyer confidence |
| Building suppliers and contractors | Approvals and project volumes | Negative | Construction costs |
| Housing-linked retail | Turnover, renovation and furnishing spending | Negative | Wealth effect |
| Brokers, rental managers, new-build developers, infrastructure | Refinancing, rents, preserved negative gearing | Relatively resilient | Financing costs and rental demand |
When you check your own holdings, test each one by its leverage to credit growth and transaction volumes. Whether a company has “property” in its description tells you much less.
What could limit the damage, and what could make it worse?
The bear case has real weight. However, the floor arguments are also concrete.
What could cushion the fall
- Structural undersupply, with Westpac expecting tight on-market listings to limit the decline
- Migration and population growth supporting demand
- Rising rents preserving the investment case
- Bank capital buffers
- Eventual rate relief if inflation eases
What could deepen it
- Another RBA hike, which ANZ expects, with no cuts until November 2027
- A sharper investor pullback as July 2027 approaches
- Payment shocks for borrowers rolling off older fixed-rate loans
- A negative wealth effect on spending, which Morningstar warns could raise recession risk if the fall is large enough
NAB, by contrast, sees the RBA broadly on hold, though with some risk of further hikes. Broad-based capital-city falls in the September quarter were reported as only the second such event on record and the first in 15 years.
History suggests where the line between a correction and a crisis sits. The downturns of 2017-19 and 2022-23 slowed credit and transaction volumes without causing bank failures. The US slump of 2006-09 became severe when high leverage, falling collateral values and credit losses fed on each other.
Price falls alone will not tell you which path Australia is on. Watch arrears and the labour market, because those signals separate a manageable correction from a broader earnings hit.
Sorting exposure before the July 2027 deadline
The framework has three parts. Treat the downside as a range of roughly 4-15%. Recognise that rates, tax and credit are stacking, and the tax change has not yet taken effect. Judge each holding by its sensitivity to credit growth and transaction volumes.
Four indicators will show which end of the range is playing out:
- The next RBA decision
- Monthly Cotality value data
- Mortgage application and arrears trends
- Investor behaviour ahead of 1 July 2027
This article is for informational purposes only and should not be considered financial advice. Investors should conduct their own research and consult with financial professionals before making investment decisions. Past performance does not guarantee future results. Financial projections are subject to market conditions and various risk factors.