You could sell every AI stock you own tomorrow and still be lending money to the AI build-out. The largest US technology companies plan to spend about $735 billion on capital projects in 2026, up from roughly $410 billion in 2025. Much of that gap is being borrowed, and some of the borrowed money comes from funds sitting inside your retirement account. That is why AI debt exposure matters more for retirement savers than any single stock pick.
The timing matters. On 21 October 2026, Meta reported negative quarterly free cash flow. Oracle sits one notch above junk. The International Monetary Fund (IMF) and the Bank for International Settlements (BIS) have both flagged how the build-out is being financed.
The pressure is showing up in debt markets and in how quickly investors can get their money out, not only in share prices.
After this, you will know which position you hold in the lending loop, how many times you appear in it, and how fast you could leave if you needed to.
How does money loop between AI companies, lenders and your retirement account?
Start with a simple circle. It has renters, landlords, lenders and savers. The uncomfortable part is that you may be standing in two places at once.
- AI companies rent computing power rather than owning all of it.
- Data-centre landlords borrow to build the facilities.
- Lenders raise that money from pension funds, bond funds and income funds.
- Ordinary savers fund those vehicles through retirement plans.
- Those same savers own the AI companies through index funds, so the money returns to where it started.
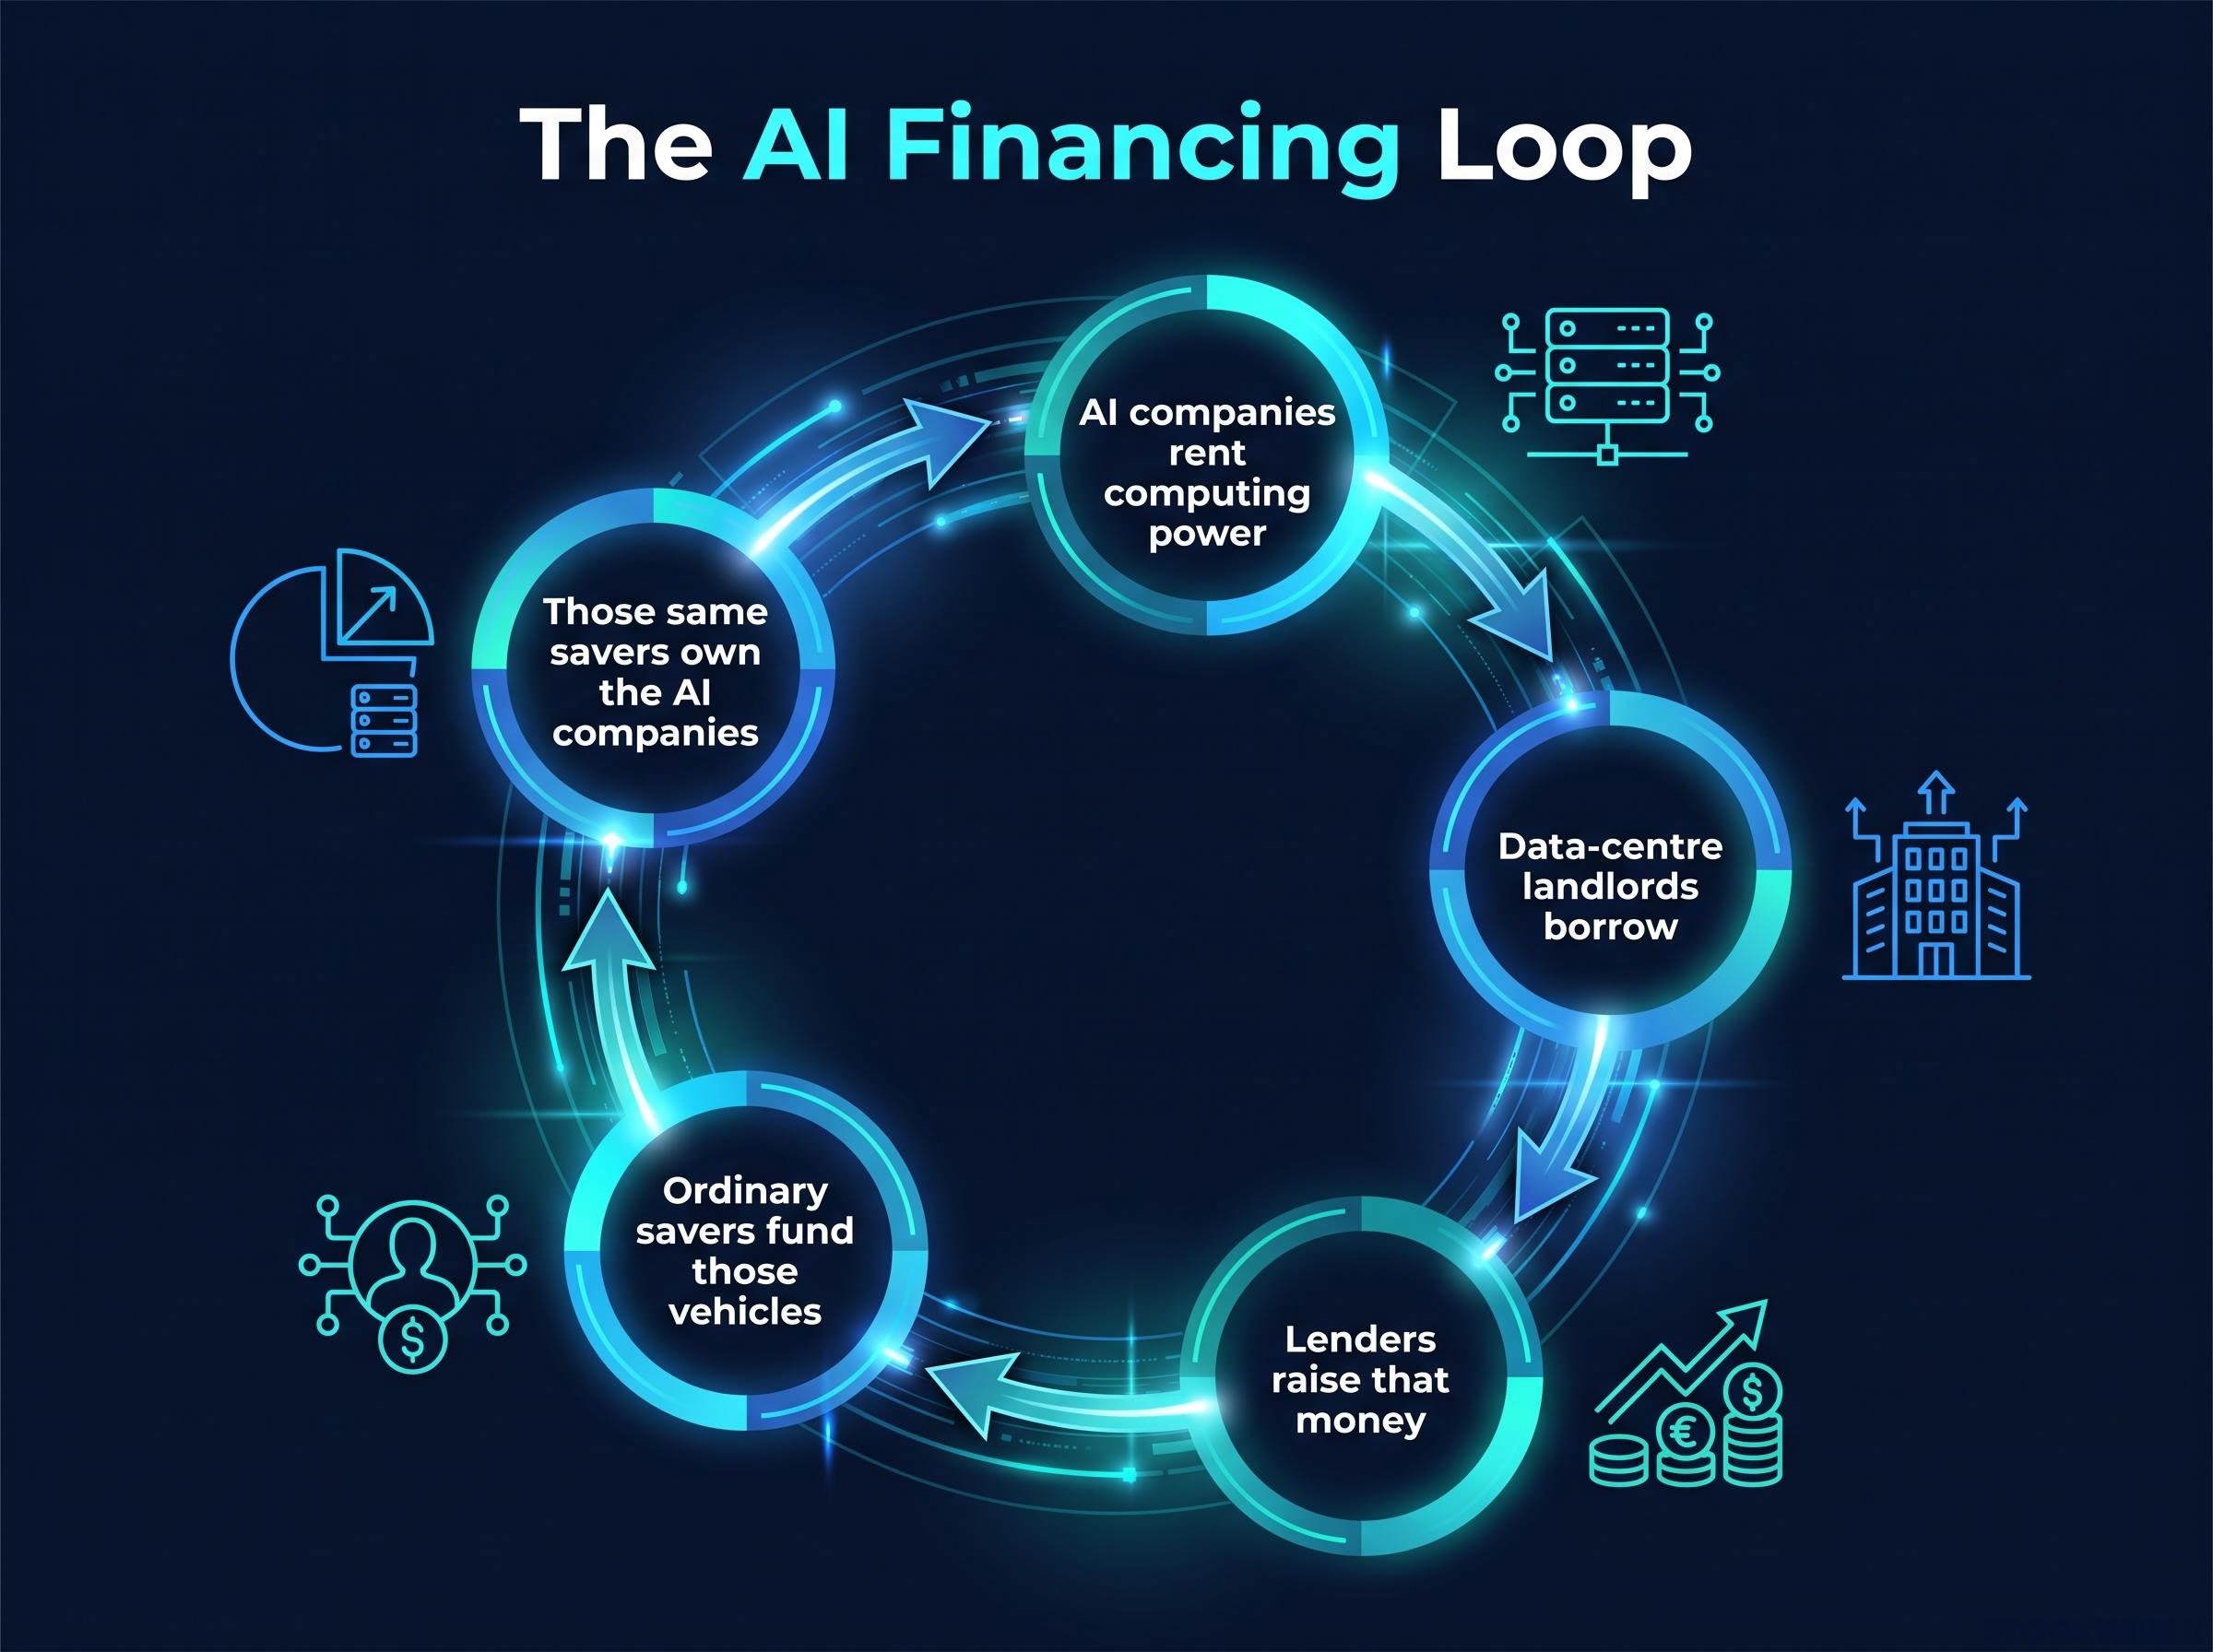
Everyone gets paid while money keeps flowing. Each participant takes a cut, though, so the pool has to grow every cycle to keep the arrangement working. The excess here lies in what has been pledged, not in what assets currently cost. It forms when the growth required outruns what participants can actually earn.
The scale is large. Morgan Stanley estimates almost $3 trillion of global data-centre spending over 2025-2028. Builders can cover about half from cash, which leaves a roughly $1.5 trillion borrowing gap. Morgan Stanley expects private credit funds to supply over half of it. Private credit means loans made directly by investment funds rather than banks. Those funds stepped in after the financial crisis, when tighter capital rules pushed banks away from large, risky loans.
The IMF’s feedback-loop concern
In an October 2026 briefing, the IMF examined 14 AI-related transactions. Together they involved about $300 billion of equity, $650 billion of debt (including off-balance-sheet vehicles) and $1.4 trillion of future revenue commitments. In April, it had already warned about increasingly circular financing.
The IMF’s worry If AI earns less than hoped, equity values could fall, debt repayments could weaken and revenue promises could lose credibility, all at the same moment.
The IMF judged the immediate stability effect to be modest, and it does not describe this as an imminent systemic crisis. For you, the point is structural. You are likely in the loop twice: once as an owner through stock funds and once as a lender through bond and income funds. A single stress event could hit both sides of your account together. The two questions to carry forward are which position you hold and how fast you can exit.
When big ASX news breaks, our subscribers know first
Where is the strain showing: Meta, Oracle and the borrowing surge?
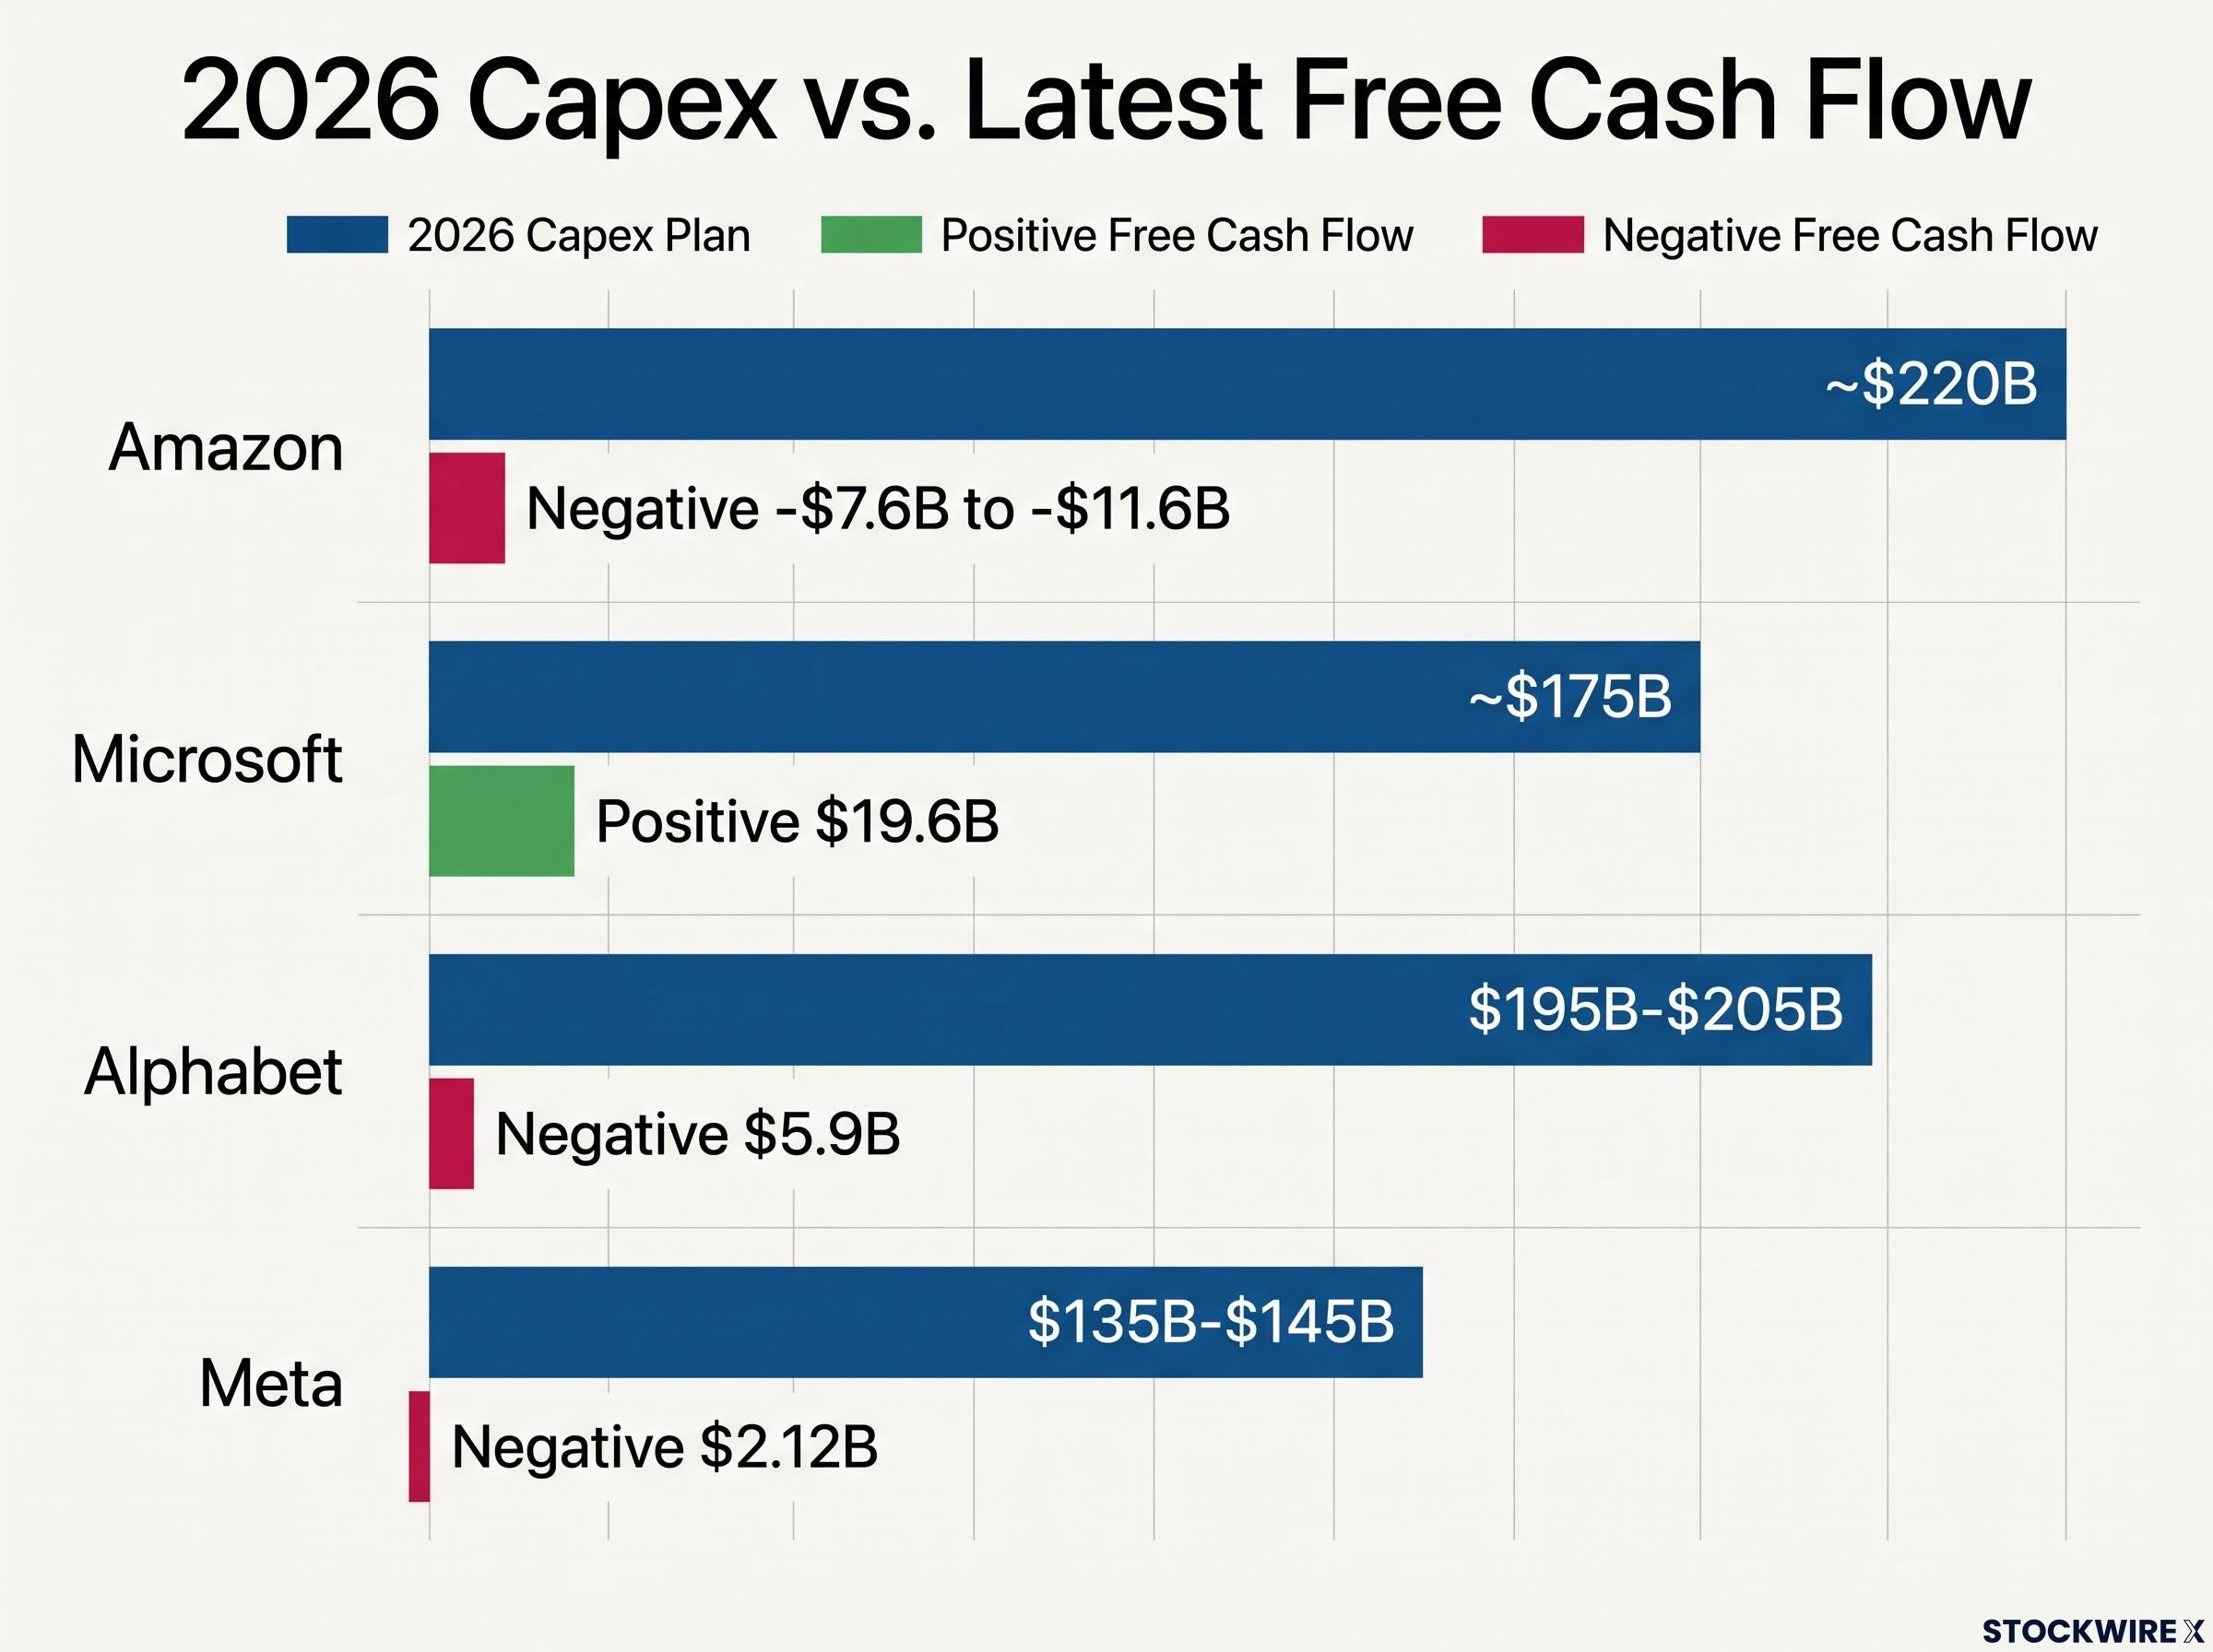
The headline numbers still look like strength. Combined 2026 capex plans run to roughly $725-$750 billion. Capex, or capital expenditure, is money spent on long-lived assets such as buildings and chips. In 2025, Amazon, Alphabet, Meta, Microsoft and Oracle sold $121 billion of bonds, over four times their typical pace. That included Meta’s record $30 billion deal and Amazon’s $37 billion, the largest corporate bond financing ever.
JPMorgan’s Michael Cembalest counted about $320 billion of new investment-grade debt and related financing from six hyperscalers through late August 2026. Hyperscalers are the giant cloud operators. Investment grade is the higher tier of credit ratings, reserved for borrowers judged likely to repay.
| Company | 2026 capex plan | Latest free cash flow |
|---|---|---|
| Amazon | ~$220B | Negative (trailing 12 months to June 2026, roughly -$7.6B to -$11.6B) |
| Microsoft | ~$175B | Positive $19.6B (latest fiscal quarter) |
| Alphabet | $195B-$205B | Negative $5.9B (latest quarter) |
| Meta | $135B-$145B | Negative $2.12B (Q3 2026) |
Free cash flow is the cash left after running the business and paying for investment. When it turns negative, the gap has to be borrowed or raised. A Reuters/LSEG analysis suggests hyperscaler capex may exceed free cash flow by 2027.
Meta’s Hyperion: borrowing off the balance sheet
Meta’s Q3 capex of about $34.9 billion outran operating cash flow of about $32.8 billion. Debt reached $83.7 billion, although cash and securities of about $82.4 billion nearly offset it.
For its Louisiana Hyperion data centre, Meta formed a joint venture with Blue Owl Capital. Blue Owl owns 80% and Meta owns 20%. The venture sold about $27 billion of bonds maturing in 2049. That debt sits off Meta’s balance sheet, yet Meta guarantees shortfalls if it walks away. The main buyers were two of the largest bond managers, whose clients include pensions and insurers.
Estimates put off-balance-sheet lease obligations at about $1.1 trillion across major tech firms, which is why standard leverage screens can understate how much debt sits behind the build-out.
Oracle: one notch above junk
S&P Global Ratings cut Oracle to BBB- in July 2026. That is still investment grade, but it is the lowest rung before junk.
- Yields of about 7%-8%, compared with 2.5%-3.5% for Alphabet and Amazon
- 20-year bonds trading near 85 cents on the dollar
- About $167 billion borrowed
- About half its order book tied to one AI customer, which is projecting about $840 billion of revenue against $856 billion of compute spending
A higher yield signals that Oracle has less room before a further downgrade. It is not proof of default. Elsewhere, a chip-rental company with about $35 billion of debt has seen its bonds fall to 80 cents on the dollar, yielding 15%.
Rising yields tell you lenders are already pricing in risk. Those same bonds sit inside funds you may own.
How does AI debt reach your 401(k) through index funds, bond funds and private credit?
Most savers feel diversified because they own several funds. Here are three channels, each more hidden than the last.
Channel 1: cap-weighted stock funds
A cap-weighted fund sizes every holding by the company’s total market value, which means the largest firms take up the most room. In an S&P 500-type index, the top 10 make up about 36%-38%. Sources differ on the timing and definition behind that figure. Nvidia, Apple, Alphabet, Microsoft and Amazon alone account for 27.2%.
Take Curtis, who has $60,000 in an index fund. Nearly $23,000 sits in the top 10, and about $16,000 sits in seven AI-linked names.
Channel 2: broad bond funds
Curtis also holds $40,000 in a broad bond fund. Here are the AI issuers’ weights in it.
| Issuer | Bloomberg US Aggregate weight (31 Aug 2026) |
|---|---|
| Amazon | 0.30% |
| Oracle | 0.30% |
| Meta | 0.20% |
| Alphabet | 0.20% |
| Microsoft | 0.10% |
| Nvidia | 0.10% |
| Total | 1.5% |
That looks small. UBP, however, puts the same six issuers at 4.6% of the US investment-grade corporate index, and at about 8% once wider AI borrowers are included. The difference comes from what each index measures. The Aggregate includes government and mortgage bonds, while the corporate index counts only company debt.
Goldman Sachs adds a twist. Passive bond funds buy more of an issuer as it borrows more, so your fund automatically finances the expansion. Curtis can still exit in one trading day.
Because index weights rise as issuers borrow, your passive bond fund exposure to hyperscalers grows automatically, and AI-tagged bonds already make up roughly 15% of the US investment-grade market, so you may hold more of them than you think.
Channel 3: private credit and semi-liquid funds
A non-traded business development company (BDC) is a fund that makes private loans and lets investors withdraw only at set intervals. Private credit funds have lent about $115 billion to software firms, roughly a fifth of their lending. The BIS found about a quarter of software loans sit in non-traded BDCs, where quarterly withdrawals are typically capped at about 5%.
| Fund | Requested | Paid |
|---|---|---|
| Blue Owl Technology Income Corp. | 39% | 5% |
| Apollo Debt Solutions | 14.7% | About 5% |
| Ares Strategic Income | 13.1% | 5% limit |
Maya put $100,000 into a lending fund promising about 9%, or roughly $9,200 a year.
Maya’s exit She asked for $10,000 back and received $2,500.
Nothing illegal happened, because the cap was written into the fund documents. Her money is still stuck, though. Taken together, there are five routes by which this exposure reaches you:
- Cap-weighted stock funds
- Broad bond funds
- Private credit funds and BDCs
- Pensions and insurers
- Your 401(k)’s overlap across stock and bond funds
Your stock fund and bond fund may lean on the same borrowers. A fund that limits withdrawals can also trap you at the exact moment you most want to leave.
Is this a bubble, and what do railways, telecom and 2008 teach us?
The case against alarm
The reassuring case is a strong one. PIMCO’s Dan Ivascyn said in April 2026 that private credit is not a systemic risk in its current form, even after Apollo, Blue Owl, Ares and KKR limited redemptions. He pointed out that most of the loans are privately negotiated, carry floating rates and are senior secured, meaning they are first in line for repayment. The hyperscalers themselves are profitable and earn real cloud revenue.
The Blue Owl redemption crisis showed the pattern clearly: withdrawal requests ran far above the 5% quarterly cap even as underlying credit losses stayed small, which suggests fear, not defaults, drove the queue.
Senior loans still carry valuation risk, however, and they do not fix the mismatch between illiquid loans and fund shares that promise withdrawals. It helps to separate two kinds of risk. Structural risk is AI debt spreading into indexes, pensions and retirement accounts. Cyclical risk is a cloud slowdown or higher interest rates arriving at the same time.
| Source | Warning | Mechanism |
|---|---|---|
| BIS (Aug 2026) | Private credit exposed to software | Illiquid loans in vehicles offering periodic withdrawals |
| IMF (Apr and Oct 2026) | Valuations and financing amplify each other | Circular equity, debt and revenue commitments |
| S&P (Jul 2026) | Oracle credit pressure | Commitments and customer concentration reduce rating headroom |
| Goldman Sachs (Sep 2026) | AI borrowers growing in bond benchmarks | Passive funds buy more as issuers borrow more |
| Cembalest (Sep 2026) | Borrowing large relative to bond markets | About $320B issued by late August |
| Reuters/LSEG (Oct 2026) | Capex may exceed free cash flow by 2027 | Shift to debt, leases and structured vehicles |
What past booms teach
- Railway mania: creditors had priority and shareholders absorbed the largest losses. The railways still run.
- 1990s telecom and fibre: cables built on borrowed money outlasted many of the bankrupt borrowers who paid for them.
- 2008: investment-grade securities became hard to sell when everyone wanted cash at once.
In each case the technology survived, and the people who could not withdraw were the ones hurt. None of this predicts a collapse. If the loop keeps growing, Curtis does fine and Maya is repaid. The question for you is not whether AI succeeds, but whether you could sell while everyone else is trying to.
What can you do about AI debt exposure in your retirement portfolio?
How Jasmine rebalanced
Jasmine started with Curtis’s portfolio and looked under the hood. Inside her 401(k), she shifted half of her index holding into an equal-weight fund covering those same 500 companies. An equal-weight fund gives every company the same slice regardless of size. Because swaps inside retirement accounts are not taxed until withdrawal, unlike sales in a regular brokerage account, the move cost her nothing in tax.
Her mix is now $30,000 in the plain index, $30,000 in equal-weight and $40,000 in bonds, with cash held separately. She left the bond fund alone, capped illiquid products at a small slice and kept a cash runway so she would never be forced to sell.
| Profile | Top-10 exposure | Bond holding | Exit speed |
|---|---|---|---|
| Curtis | Nearly $23,000 | $40,000 | One trading day |
| Jasmine | About $12,000 | $40,000 | One trading day (cash held separately) |
Your five-step checklist
- Read the top 10 holdings of every fund. Add them up across your stock, bond and target-date funds to see your real concentration.
- Cap anything not sellable in a day. Treat semi-liquid funds as illiquid and check their actual redemption terms.
- Rebalance in tax-advantaged accounts. Your 401(k) or IRA lets you adjust without a tax bill.
- Keep a cash runway. No single company, sector or vehicle should be needed for your near-term spending.
- Watch quarterly redemption-request data. Rising queues at lending funds are an early warning sign.
There are trade-offs. Equal-weight funds add exposure to smaller, more economically sensitive firms and may carry higher turnover and costs, so they are a diversification tool rather than a guaranteed safer option. Target-date funds reduce equity risk as you age, but they do not remove concentration in large tech issuers. You cannot avoid the loop entirely. Your lever is how much sits in one place and how quickly you can leave.
Investors exploring how top-heavy indexes have become can read our deep-dive into record US market concentration, which compares today’s mega-cap weight with the dot-com peak.
This article is for informational purposes only and should not be considered financial advice. Investors should conduct their own research and consult with financial professionals before making investment decisions. Past performance does not guarantee future results. Financial projections are subject to market conditions and various risk factors.
Why exit speed matters more than any AI forecast
AI debt reaches you through stock indexes, bond indexes, target-date funds, pensions, insurers and private credit, even if you have never bought an AI bond.
Maya, Curtis and Jasmine do not differ much in what they believe about AI. They differ in how concentrated they are and how fast they can get out.
Over the coming months, watch for three things: how Meta and Oracle fund their next stages of spending, the quarterly redemption figures from lending funds, and whether capex overtakes free cash flow into 2027.
Your next step is simple. This week, pull up the top 10 holdings of every fund you own and add them together.
—