
Nebius shares closed at $159.17 on 22 October 2026, roughly 47% below their $299.86 June peak. The same stock is still up about 90% for the year. Read the chart one way and Nebius stock looks like a crash; read it the other and it looks like a dip worth buying. Neither reading captures what the market is actually repricing.
The shift started in the bond market. CoreWeave debt now yields above 15%, and that has changed the neocloud debate. The question is no longer whether AI compute demand is real. It is who can afford to fund the build-out.
Nebius reports Q3 earnings on 10 November, which gives management a chance to defend both its growth and its debt story.
Here is a way to weigh financing risk, short interest and large options trades before that print, so you can judge the result on its own terms rather than on headline noise.
Why did the neocloud credit squeeze hit Nebius stock so hard?
The price path shows how quickly sentiment turned:
- Start of 2026: about $84
- June peak: $299.86
- 6 October: close to $250
- 22 October: $159.17, a 36% fall in 17 days
The tension in one line Down roughly 47% from the high, yet still up about 90% year to date.
A brief note on the figures. Lighthouse Canton reported $186.01 and a drawdown of roughly 38% as of 15 October. The gap is timing: the stock kept falling after that date, and the $159.17 close is the more recent print.
How CoreWeave’s bond yields became Nebius’s problem
The selloff makes more sense when you trace it backward. CoreWeave’s 2032 notes were yielding about 14.8% in mid-October, according to TheStreet, and another CoreWeave bond was reported at 15.78%. Credit default swaps (insurance contracts that pay out if a borrower defaults) on CoreWeave sit near 1,038 basis points, after briefly passing 1,140.
Those are distressed-looking prices. When lenders charge that much to fund one neocloud, equity investors start asking what every neocloud’s next loan will cost.
Short sellers moved fast. Per Yahoo Finance and ORTEX data, short interest in Nebius rose from 15.4% earlier in October to about 20% of free float. A Tastytrade Signal vs. Noise segment reported short sellers earned about $6 billion across the neocloud group this month.
That jump in a matter of weeks tells you professional capital is betting against the financing story specifically. The drawdown reflects a deliberate thesis, not just panic, and a 90% annual gain does not mean the risk has passed.
When big ASX news breaks, our subscribers know first
What is the real financing risk behind neocloud debt?
Why GPU debt differs from hyperscaler debt
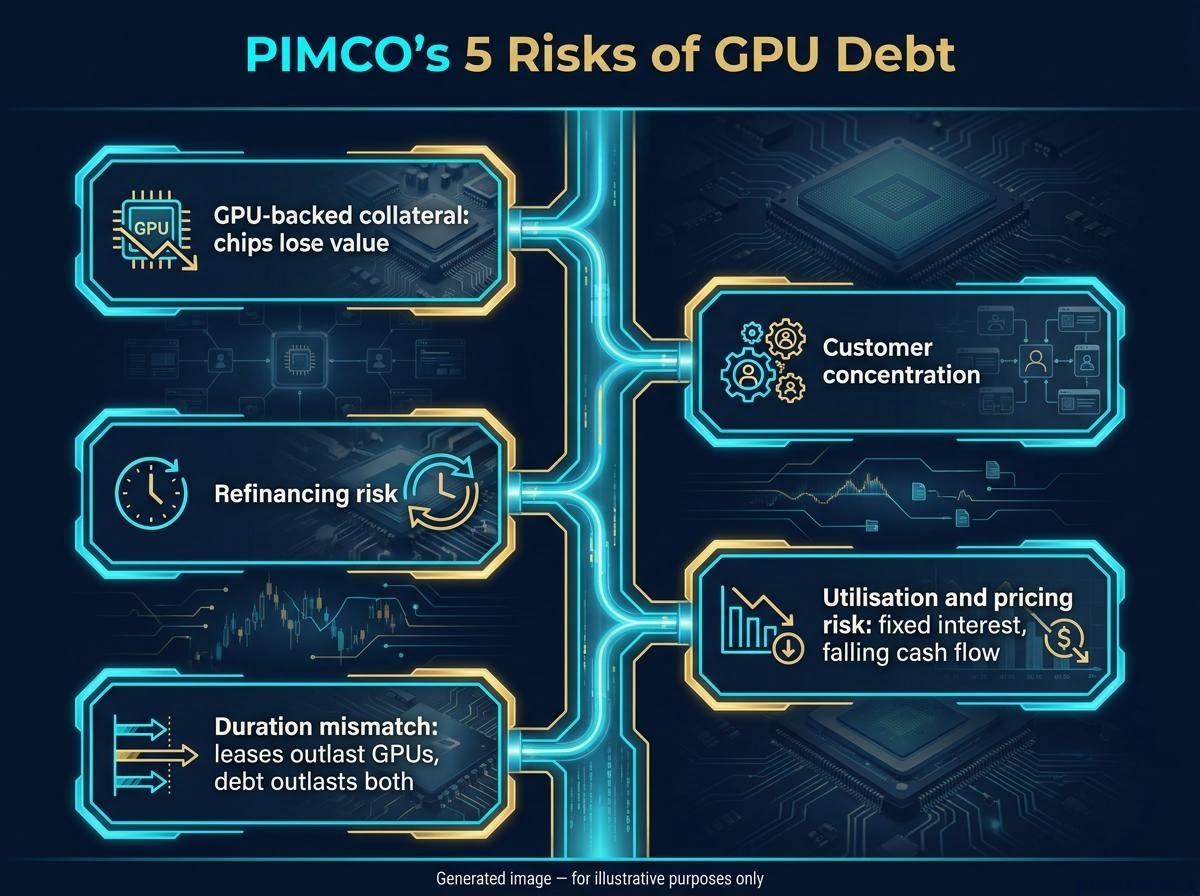
PIMCO describes a chain of linked risks. In plain terms:
- GPU-backed collateral: the chips securing the loan lose value as newer generations arrive.
- Customer concentration: repayment depends on a handful of large customers.
- Refinancing risk: debt may come due after the GPU or contract has lost its economic value.
- Utilisation and pricing risk: if rental rates or usage fall, cash flow drops while interest stays fixed.
- Duration mismatch: leases can outlast GPUs, GPUs can outlast contracts, and debt can outlast both.
PIMCO’s conclusion is that strong demand alone does not make neocloud credit equal to the credit of a hyperscaler such as Microsoft or Amazon. That is the lens to apply to Nebius.
Nebius’s stack and its protections
| Instrument | Size | Pricing or coupon | Maturity or term | Security |
|---|---|---|---|---|
| August convertible notes | $3.45B | 0.5% | 2030 | Convertible |
| August convertible notes | $2.30B | 4.5% | 2034 | Convertible |
| Citi bridge facility | $3.5B | Term SOFR + 2.75%, stepping to 3.50% | 364 days | Senior secured |
| Asset-backed facility | $775M | SOFR + 2.50% | Not specified | Deployed GPUs and an investment-grade customer’s contracted cash flow |
SOFR, the Secured Overnight Financing Rate, is the benchmark US lending rate these loans float above. In total, about $10 billion of convertible debt is outstanding, per TIKR. Debt snapshots of $8.4 billion (end of March) and $8.5 billion (end of June) were taken at different dates, so they are not directly comparable.
The Citi facility is the one to watch. A 364-day maturity makes it a refinancing event, not permanent funding, and the stock fell 7.2% on the day it was announced. Keep it separate from the earlier $775 million facility, which was Nebius’s first secured financing.
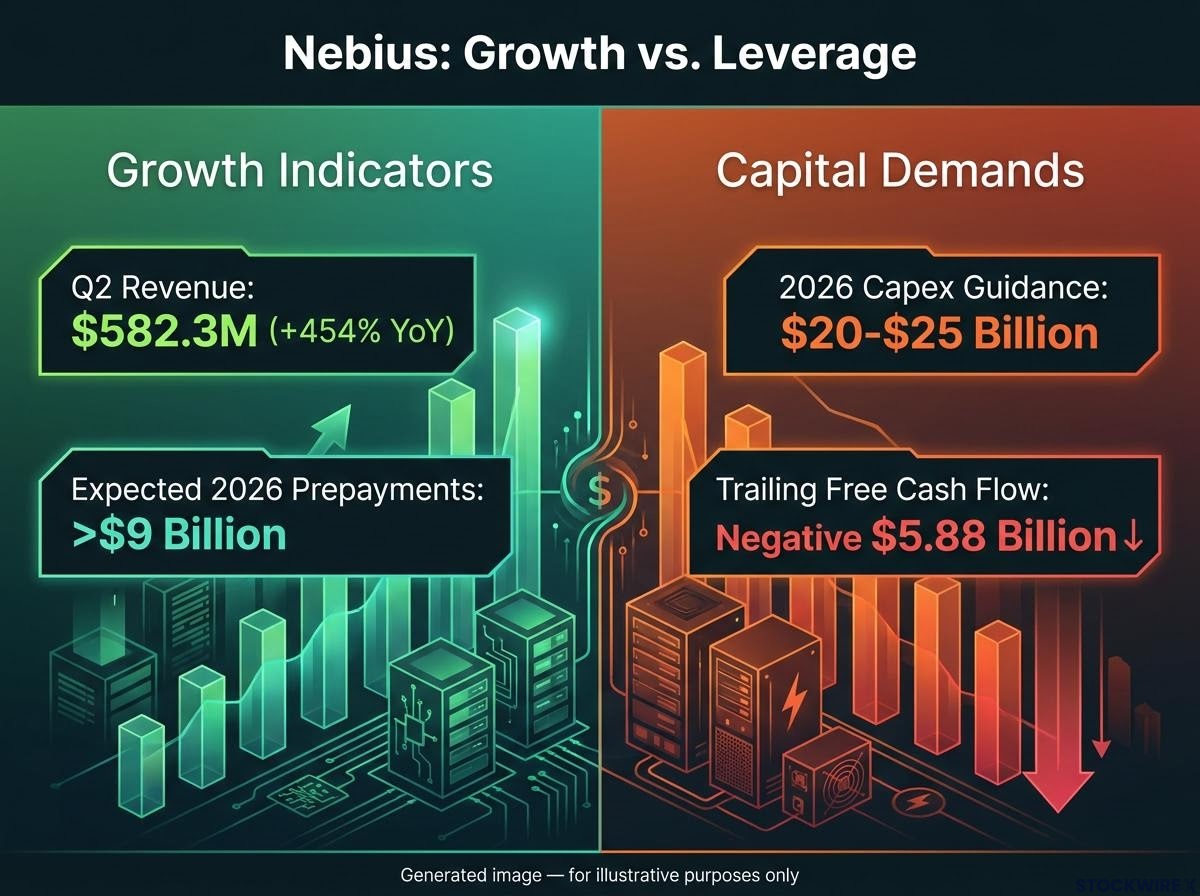
The cushion is real: about $8 billion of cash at Q2 end, and management expects 2026 customer prepayments above $9 billion. But 2026 capex guidance is $20-$25 billion, and trailing free cash flow sits near negative $5.88 billion, per StockAnalysis. That tells you to judge Nebius on whether growth is self-funded, not on its headline cash balance.
Growth versus leverage: how do bulls and bears read the numbers?
The growth is extraordinary. Q2 revenue reached $582.3 million, up 454% year on year, and first-half revenue hit $981.3 million, up 529%. Management guides to $3.0-$3.4 billion of full-year revenue at an adjusted EBITDA (earnings before interest, tax, depreciation and amortisation) margin of about 40%.
Then comes the ramp. Q2 annualises to roughly $2.3 billion, against a year-end run-rate target of $7-$9 billion. Consensus for Q3 is about $905 million, roughly 57% sequential growth.
| Bull case | Bear case |
|---|---|
| 454% Q2 growth and large contracted customers suggest genuine demand | Q2 annualises to about $2.3B versus a $7-$9B run-rate target |
| Over $9B of expected prepayments can fund much of the expansion | Prepayments do not remove the need to build, deploy and run capacity profitably |
| Secured debt is backed by deployed assets and contracted cash flow | The $3.5B bridge matures in 364 days |
| BofA ($310) and Rosenblatt ($304) rate it Buy | Trailing free cash flow near negative $5.88B; Piper Sandler cut to $185 |
The analyst split mirrors the table. Bank of America reiterated Buy at $310, and Rosenblatt initiated at Buy with $304. Piper Sandler sits at Neutral after cutting its target from $237.
Piper Sandler’s caution AI-cloud stocks may stay in a “penalty box” until financing or free cash flow improves.
StockAnalysis counts 22 analysts with an average target of about $281; the original source cited roughly $301.30, a gap explained by different data sets. Ratings run about 13 buys, 5 holds and 2 sells. Bulls also argue Nebius is not a pure merchant GPU lessor, given its contracted customers and prepayments.
Because the average target sits near the all-time high, you should read consensus as a view on long-term demand. It is not a verdict on whether the financing holds over the next two quarters.
What do Burry’s puts and $27 million of closing-minute calls actually signal?
Burry’s bearish structure
Michael Burry shorted Nebius near $211.77 in August and added in September. He then swapped the short for June 2027 puts, and by 11 October had reportedly consolidated most short exposure into Nasdaq-100 and VanEck Semiconductor ETF puts. His thesis: AI infrastructure valuations assume too favourable a refinancing environment, and puts cap losses at the premium paid.
These disclosures are lagged snapshots. You are seeing where Burry was, not necessarily where he is.
How to read the closing-minute calls
On the other side, a Signal vs. Noise options-tape analysis flagged two large call purchases. These figures come from that single source and were not independently confirmed.
| Trade | Contract | Premium | Break-even | Volume vs. open interest |
|---|---|---|---|---|
| Wed 21 Oct, 3:59pm ET | April 2027 $260 calls | $14.13M | $278.13 | About 89x |
| Thu 22 Oct, 3:59pm | March 2027 $230 calls | $12.77M | About $246.09 | About 1.1x |
Combined premium is about $26.91 million, and both contracts span the November report. The March break-even needs only a return to early-October levels; the April one sits below the June high. A closing-minute call buy could mean:
- Speculation on a sharp move or earnings volatility
- A hedge against an existing short or put
- A roll of existing option exposure
- Market-making or one leg of a spread
- Squeeze positioning, since 20% short interest means dealer hedging can amplify a rally through the strikes
The defensible read is potentially bullish but inconclusive. Gross premium is not net exposure, so treat a headline trade as one input alongside borrow costs, catalysts and guidance credibility, never as a signal to copy.
What to check before 10 November
- Q3 revenue against roughly $905 million
- Prepayments against the $9 billion expectation
- Citi facility terms and refinancing plans for the bridge and convertibles
- Cash remaining after expansion, and capex against $20-$25 billion
- Power and GPU deployment progress, plus customer concentration
- Adjusted EBITDA against actual free cash flow
- Whether CoreWeave yields and CDS stabilise or worsen
TIKR cited 12 November, but 10 November is the most consistent calendar date; confirm with the company. CoreWeave shows how fast equity enthusiasm can become a financing problem, and past telecom build-outs followed a similar path. GPU obsolescence leaves neoclouds more exposed than those earlier cycles.
Weighing the debt, the shorts and the calls before the next print
Demand looks real. Funding cost is the swing factor, and positioning on both sides is conflicted rather than conclusive.
Weight the three lenses accordingly. Financing risk deserves the most attention because it decides whether growth survives a tighter credit market. Short interest tells you where sceptical capital sits. Large options trades are the noisiest input of all.
The test for 10 November is simple. If growth is funded by customer-backed cash flow, the reaction may hinge on execution. If it needs repeated borrowing on costlier terms, you should expect the market to keep treating Nebius as a credit story.
This article is for informational purposes only and should not be considered financial advice. Investors should conduct their own research and consult with financial professionals before making investment decisions. Past performance does not guarantee future results. Financial projections are subject to market conditions and various risk factors.