
The UK economy just posted its strongest private-sector reading in eight months, and the pound fell anyway. The flash Composite PMI hit 53.1 this morning, comfortably beating the 51.8 forecast. Yet GBP/USD slipped to around 1.3380 on Friday 23 October, which challenges the idea that good data always means a stronger currency.
The rest of the morning’s news explains much of the gap. Retail sales fell 0.4% month on month, worse than the 0.1% fall expected. Money markets already price a November Bank of England hike at close to full probability, and the US dollar bounced after four straight daily losses.
That combination makes today a useful lesson in how currency markets weigh conflicting signals at once.
This walkthrough gives you three tools for the GBP/USD outlook. You will learn how to read a PMI properly, how to separate what was already priced in from what genuinely surprised, and how to place EMA and RSI readings in context rather than treating them as instructions.
Why did sterling slip when the UK data looked strong?
On the surface, the move makes no sense. A business survey beats expectations by more than a full point, and the currency weakens.
Look at the size of the move first. GBP/USD fell about 0.1% to roughly 1.3380, down from 1.3418 yesterday. Sterling was weakest against the yen, down about 0.23%, although some coverage reported sterling briefly rising against the yen after the data. The end-of-session figure is the more specific one. This was a nudge, not a repricing.
Then look at what the market already knew. Several forces were pulling in different directions:
- The hike was already priced. With a November rise close to fully expected, a strong PMI added little extra.
- Retail sales missed. A -0.4% monthly fall against -0.1% expected was a clean negative surprise.
- The growth signal was mixed. Strong firms and weak shoppers do not add up to an unambiguously bullish story.
- The dollar rebounded. After four daily losses, the dollar firmed, and some coverage linked this to global risk-off sentiment and higher oil.
- Cross-market moves were uneven. This suggests part of the move was about the dollar and risk appetite, not a verdict on UK rates.
Once you stack those layers, the paradox fades. A data beat only moves a currency by the amount it exceeds what is already in the price.
Equity and currency markets often pre-price PMI trends well before the survey lands, so the market-moving content of any release sits in its surprise against consensus rather than in the headline level.
The data mix: strong firms, weaker shoppers
| Indicator | Actual | Expected / previous | Read for GBP |
|---|---|---|---|
| Composite PMI (flash) | 53.1 | 51.8 expected / 52.0 previous | Supportive, but hike largely priced |
| Services PMI (flash) | 53.1 | 52.1 previous | Supportive |
| Manufacturing PMI (flash) | 52.8 | 51.9 previous | Supportive |
| Retail sales (September, m/m) | -0.4% | -0.1% expected | Negative surprise |
| Retail sales (September, y/y) | +0.8% | n/a | Slowing consumption |
Markets can read this mix as “higher inflation risk, poorer consumption”, which is not the same as a clean growth story. Andrew Wishart of Berenberg said the weak retail sales and confidence figures could be early signs that the energy shock is squeezing households. One weak month may also reflect timing, weather or discounting.
The takeaway for you: before judging any release, ask what was already in the price.
When big ASX news breaks, our subscribers know first
How is the PMI built, and what does 53.1 actually tell you?
On your screen, the number looks like a growth rate. It is easy to read 53.1 as “the economy grew 3.1%“. It means nothing of the sort.
How the index is calculated
A Purchasing Managers’ Index (PMI) is a diffusion index, meaning it tracks how widely a change is spread across firms rather than how large it is. S&P Global surveys purchasing managers and senior executives each month, weighted by company size and sector. They report whether output, new orders, employment and prices are higher, unchanged or lower than the month before.
The formula, with an illustration PMI = % reporting higher + (0.5 × % reporting unchanged) Illustrative round numbers only: if 40% of firms report higher output, 30% unchanged and 30% lower, the PMI is 40 + 15 = 55.
The scale runs from 0 to 100. Above 50 means more firms are improving than deteriorating, and below 50 signals contraction. The composite blends manufacturing and services, weighted by their economic importance.
This release was broad. New orders grew at their fastest pace in 25 months, manufacturing output hit a 25-month high, and employment rose marginally for the first time since September 2024. Chris Williamson, chief business economist at S&P Global, said the economy gained momentum in October, with the fastest growth since February.
Where the PMI can mislead
Breadth is useful, but it has blind spots you should keep in mind:
- Direction, not size: a big jump at one firm counts the same as a small gain.
- Sample effects: it is a survey, so response composition can skew it.
- Private sector only: it does not cover the whole economy as GDP does.
- Revisions and adjustment: flash readings change, and September’s composite moved from 51.7 flash to 52.0 final. Seasonal adjustment can also differ from the ONS.
The UK Statistics Authority notes that gaps between the PMI and GDP do not prove either series wrong, and S&P Global warns that the growth linked to a reading of 50 varies by country. Treat the PMI as an early read on direction, not a GDP forecast.
Why a priced-in Bank of England hike limits the pound’s upside
The PMI’s real influence runs through interest rates, and that is where the “priced in” problem bites.
When money markets put close to full odds on a hike, the currency has largely absorbed it. Only a surprise in the path beyond that decision moves the pound.
Tracking MPC dissent and forward guidance matters as much as the rate decision itself, because a hawkish drift in the vote split shapes how far sterling can rally on a move that is already expected.
The case for a hike
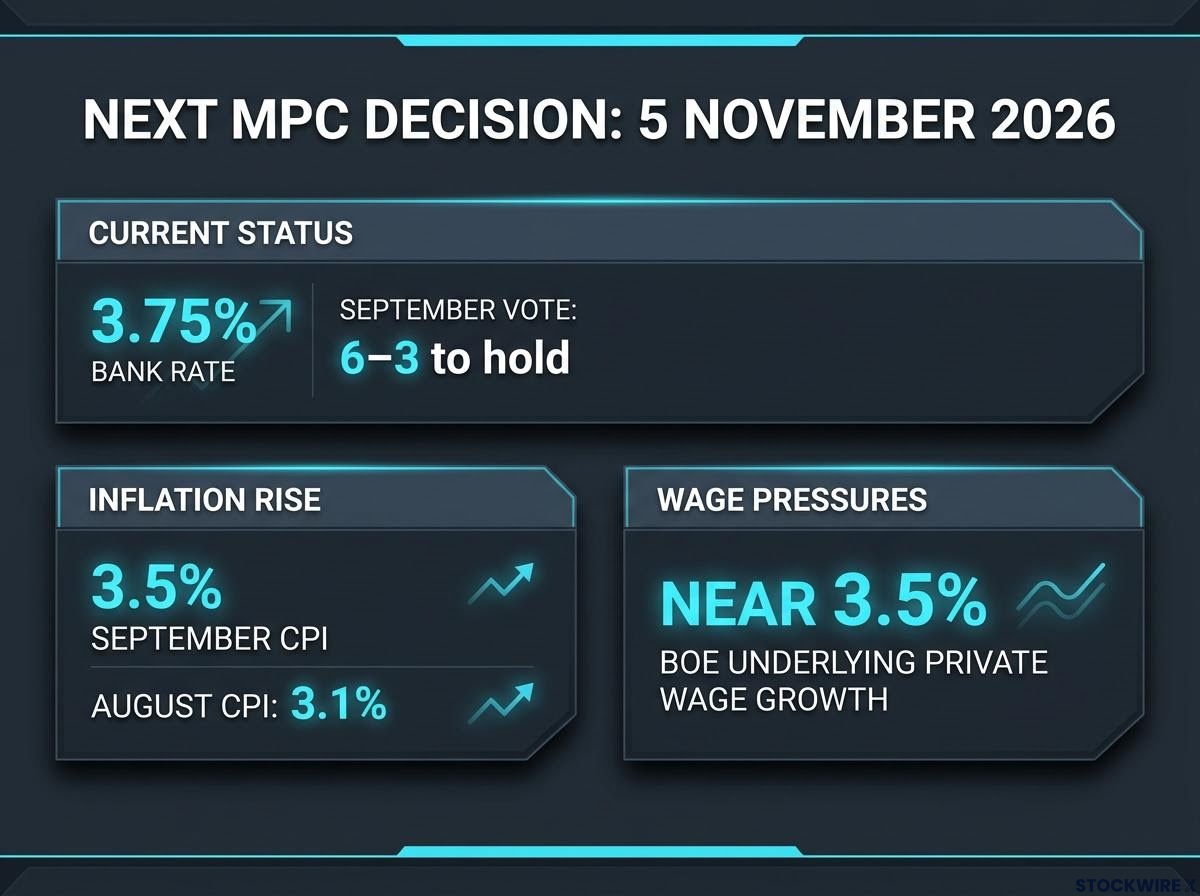
The next Monetary Policy Committee (MPC) decision is Thursday 5 November 2026, alongside a Monetary Policy Report. Bank Rate sits at 3.75%, and September’s vote was 6-3 to hold, with three members wanting a 25 bp rise.
Inflation has since moved up. CPI reached 3.5% in September from 3.1% in August, and private regular pay grew 2.9%, while BoE minutes put underlying private wage growth near 3.5%. Secondary coverage reports Societe Generale strategists calling a November hike effectively assured, citing upside CPI, PPI and wage surprises; the primary note is not publicly accessible.
| Source | Date | View |
|---|---|---|
| Reuters economist poll | 15 October | Majority expect Bank Rate at 4.0% in November |
| Reuters market report | 23 October | Hike a near certainty; 2027 tightening odds rising |
| Catherine Mann, MPC | 1 October | Policy not tight enough |
| Martin Sartorius, CBI | 21 October | Hike “firmly on the table” |
| Scotiabank / RLAM | October | November hike likely unless energy prices fall |
The case for caution
Huw Pill, the BoE’s Chief Economist, questioned on 14 October whether markets were right to price four successive 25 bp hikes. He wanted more evidence that the energy shock was spreading broadly through the economy.
Add today’s weak retail sales and the stagflation risk becomes visible: high inflation alongside fragile household demand. Heavily priced expectations can also leave the pound exposed to disappointment.
For you, the implication is that the November hike’s support for sterling has largely been earned already. The next move depends on what the Bank signals for 2027.
What do the 20-period EMA and RSI say in the GBP/USD forecast?
Charts offer a calmer picture than the fundamentals, at least at first glance.
Reading the levels
A 20-period exponential moving average (EMA) is the average price over the last 20 sessions, weighted towards recent days. The Relative Strength Index (RSI) measures momentum on a 0-100 scale, with readings above 70 often seen as overbought.
| Measure | Level | What it suggests |
|---|---|---|
| Spot | 1.3381 | Current pivot |
| 20-period EMA | 1.3319 | Price above it gives a mildly bullish bias |
| RSI | 56 | Positive momentum, not overbought |
| 100-day SMA (separate assessment) | 1.3390 | Nearby resistance |
| Downside references (separate assessment) | 1.3365, 1.3255, 1.3150 | Possible support zones |
A sustained break below the EMA would suggest fading bullish pressure. The main technical dataset, produced with an AI tool by FXStreet, identified no clear nearby resistance, which makes the setup less reliable than a clean range breakout. Sources also differ on levels.
What could override the chart
Indicators describe price; they do not cause it. A rate decision or a dollar swing can flatten any setup. These are the points worth watching:
- Whether price holds above the 1.3319 EMA
- The 1.3390 area
- The 5 November MPC decision and its 2027 signal
- The next UK CPI release and any flash PMI revision
- Oil prices and the dollar’s direction
The chart says momentum is steady, not that sterling is set to rise. Treat the EMA as a line to monitor, not a signal to act on.
Readers interested in building a repeatable process can use our full explainer on GBP/USD technical analysis, which shows why an RSI reading carries no standalone signal without a failure swing.
What Friday’s mixed signals change, and what they do not
Today’s lesson is that currencies react to surprises, not headlines. A strong PMI, a weak retail print, a priced-in hike and a firmer dollar combined into a small decline.
You can apply the same three-part test to the next release. Read the data against consensus. Read the rate path against market pricing. Read the chart as context, never as a verdict.
The next real test arrives on 5 November, when the guidance on 2027 policy may matter more than the decision itself. Past performance does not guarantee future results, and any projections are subject to market conditions and risk factors.
This article is for informational purposes only and should not be considered financial advice. Investors should conduct their own research and consult with financial professionals before making investment decisions.