
On one recent overnight session, the Nasdaq fell 2.6% and the Dow Jones Industrial Average finished flat. Consumer defensive stocks jumped 3.1% on the same night. A flat Dow looks like a calm day, but underneath it, sector rotation was moving money from one part of the market to another.
The pattern has a clear start date. Since the Nasdaq Composite set a record close of 27,599.79 on 6 October 2026, money has left technology and communication services and gone into healthcare, consumer staples, utilities and insurers. That shift is happening in the US and in Australia.
By 20 October, the Nasdaq sat about 4.26% below that peak. The two markets do not move in perfect step, though. Energy and banks went in opposite directions on either side of the Pacific.
You will come away able to read a sector heat map with more confidence and tell a real rotation from a general sell-off. You will also know which dates and numbers to watch when Australia’s major banks report in November.
What moved after the 6 October peak: defensives up, tech down in both markets
Put the US and Australian sector numbers side by side and the overlap is hard to miss. Heat map data from Mumu, compiled by chief market strategist Tapper Strickland, tracks cumulative moves over the 10 trading days after the Nasdaq peak.
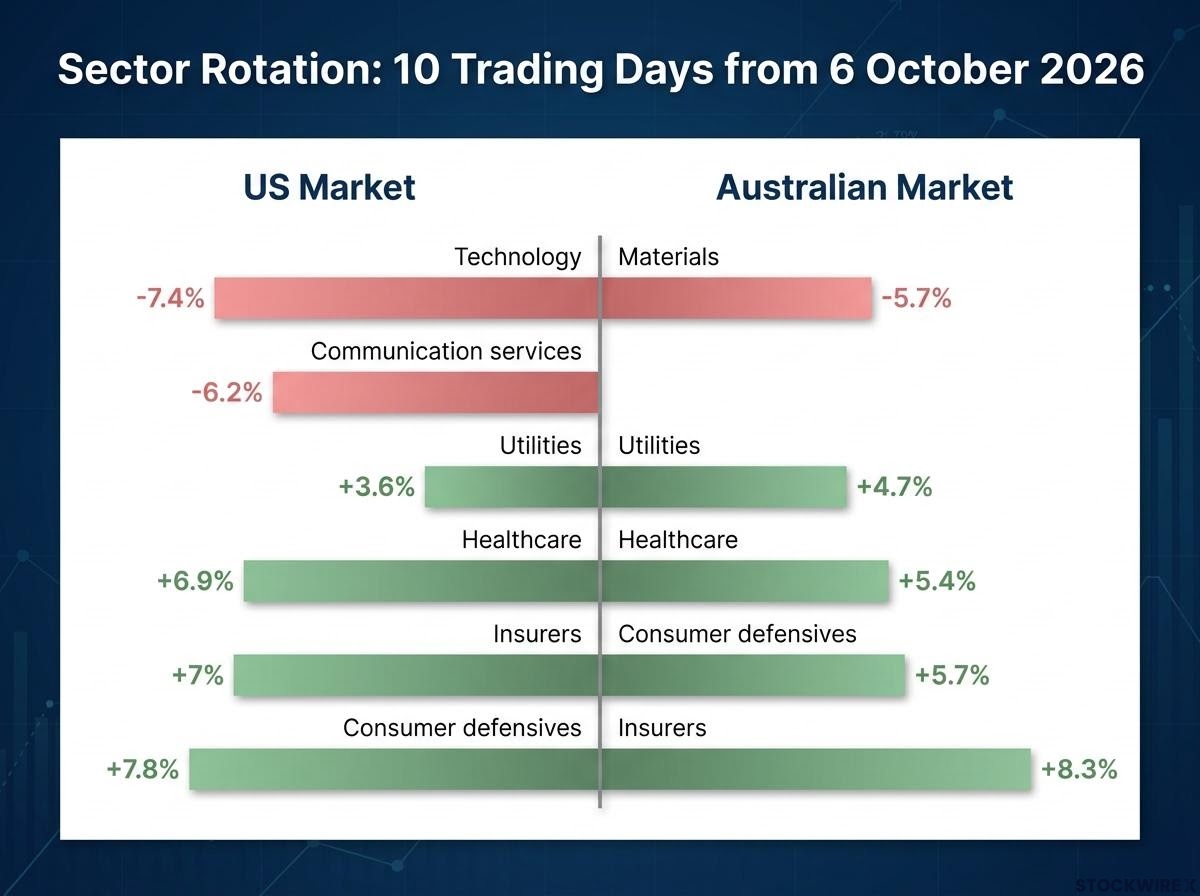
| Sector | US move | Australia move |
|---|---|---|
| Technology | -7.4% | n/a |
| Communication services | -6.2% | n/a |
| Materials | n/a | -5.7% |
| Healthcare | +6.9% | +5.4% |
| Consumer defensives | +7.8% | +5.7% |
| Utilities | +3.6% | +4.7% |
| Insurers | +7% | +8.3% |
Window: 10 trading days from 6 October 2026. “n/a” means no comparable figure was published.
The winners match. Healthcare, consumer defensives, utilities and insurers rose in both markets. Insurers led in Australia at +8.3%, and consumer defensives led in the US at +7.8%.
The losers rhyme as well. US tech and communication services fell hardest, while Australia’s materials sector, hit by weaker iron ore, played the same role.
Weekly data from Morningstar tells the same story. In the week ended 16 October, the Nasdaq fell 4.48% and the S&P 500 1.95%, while consumer defensives gained 5.06%.
Two markets with very different make-ups produced the same defensive leaders. That tells you the driver is global: rates, inflation and worries about AI valuations. If your portfolio leans towards tech, you carried that exposure in both places.
The split between cyclical and defensive stocks explains why healthcare, staples and utilities held up while technology fell; defensives serve essential needs in any economy, while cyclicals track growth and tend to lead on the way down as well as up.
When big ASX news breaks, our subscribers know first
Where the two markets split: energy and banks
Against that matching picture, two sectors broke ranks. In each case, the difference comes from what the local index actually holds.
Energy: oil-led in the US, coal-heavy in Australia
US energy rose 3.4% after the peak, while Australian energy slipped 0.9%. Renewed Middle East tensions pushed Brent crude to about $113 a barrel, which supports the large integrated oil companies and producers that dominate the S&P 500’s energy sector.
The ASX energy sector is not a clean oil bet. Much of it is coal and diversified miners, so a higher crude price does not flow through evenly.
Window check Australian energy was down 0.9% over the full window, yet it rose 1.31% in the week ended 16 October and 1.42% on 13 October. Coal miners climbed 5%-6% on 19 October. The sector’s result depends heavily on which dates you measure.
For comparison, S&P 500 energy gained 4.58% in the week ended 16 October.
Banks: income demand versus rate anxiety
Australian banks rose about 6%, while US banks were flat. In Australia, high dividend yields, large index weightings, relative value and expectations for the November results kept buyers interested. Not every lender joined in: Bendigo Bank fell after a weak first-quarter update.
In the US, bank earnings and hot inflation data raised concerns about rates, credit quality and valuations. Reuters reported that banks and AI-linked stocks weighed on the market during the 14 October sell-off.
“Defensive” is not one trade. The same global backdrop rewards different sectors depending on what each index contains, so a US sector signal will not always carry over to the ASX.
What a flat Dow under a falling Nasdaq is really telling you
How does a headline index stay flat on a day when the Nasdaq loses 2.6% and the S&P 500 drops about 1.2%? The answer starts with how each index is built.
The Nasdaq leans heavily on large tech, semiconductor and communications companies. The Dow holds only 30 stocks, with more weight in industrials, financials, healthcare and consumer names. A few heavy tech losses can drag the Nasdaq down while the Dow barely moves.
Breadth shows what the headline numbers hide. Breadth measures how many stocks are rising or falling, not just where the index ends up. On 14 October, the Nasdaq fell 1.88% to 26,692.87, its largest one-day drop since 23 July, and posted 521 new lows.
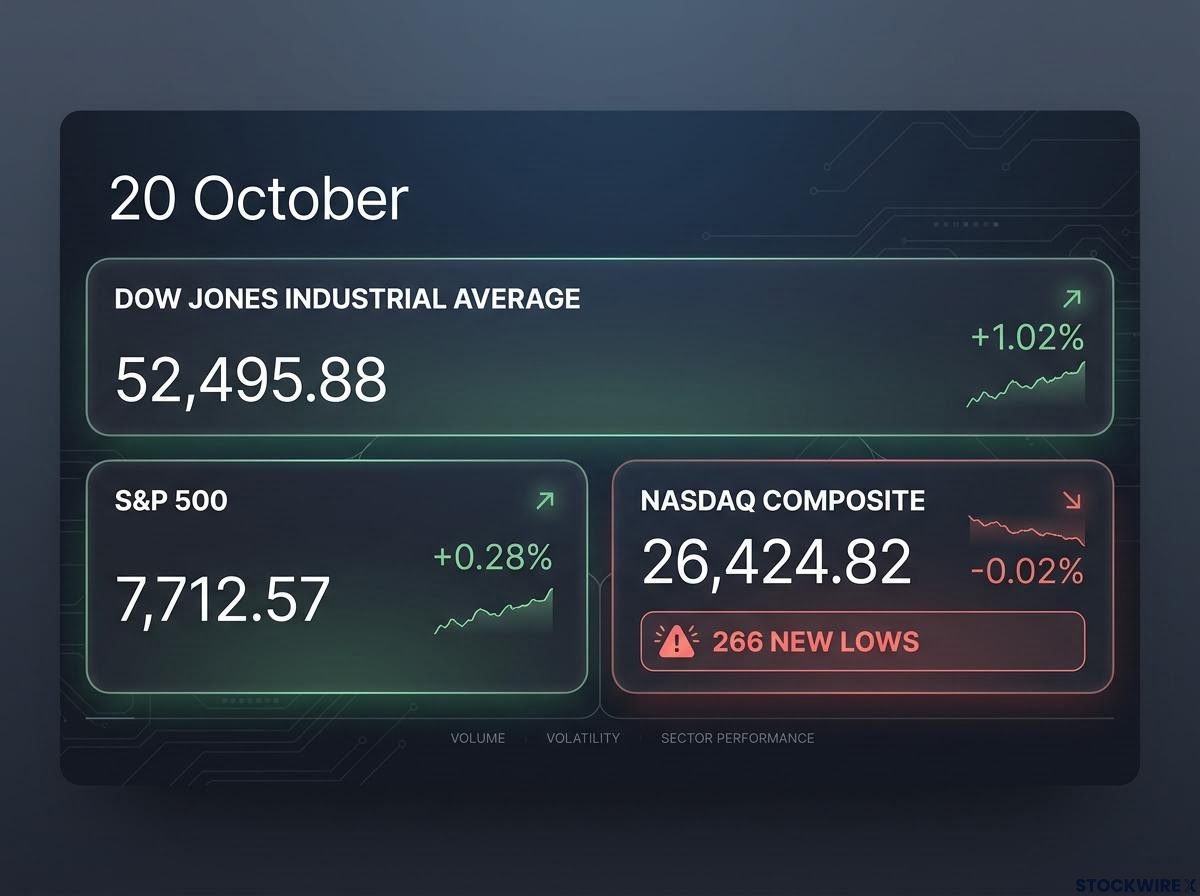
| Index | 20 October level | Daily move |
|---|---|---|
| Nasdaq Composite | 26,424.82 | -0.02% |
| S&P 500 | 7,712.57 | +0.28% |
| Dow Jones Industrial Average | 52,495.88 | +1.02% |
Then came 20 October. The Nasdaq was almost unchanged, yet it still recorded 266 new lows.
The stronger evidence comes from the equal-weight S&P 500, which gives every company the same weight regardless of size. It beat the standard cap-weighted index by 2.25 percentage points in a single week, its best relative week in almost six years. Staples and energy each rose about 5%.
The gap between cap-weighted and equal-weighted funds matters well beyond the US, since nearly half of the ASX 200 sits in just 10 stocks and a domestic index fund carries similar concentration in banks and miners.
- Construction: index weighting decides which stocks move the headline number.
- Breadth: new lows reveal damage that the index level hides.
- Equal-weight: shows whether leadership is spreading beyond a handful of giants.
A near-flat index with hundreds of new lows tells you the headline level is not a safe guide to how your own holdings are doing.
How to read a sector heat map and spot sector rotation
Sector rotation is the movement of investor money between sectors as expectations for growth, interest rates and risk change. A heat map is where most investors first see it: blocks coloured green or red by performance.
The colours can mislead you. A green block can reflect a few large companies rising while many smaller ones fall. The Mumu comparison above covered a 10-trading-day window, but a single session or a shorter window could paint a different picture.
Before you trust what a heat map shows, run through this routine:
- Set the window. Note the start date and the number of days, because results can flip between windows.
- Check advance-decline data. This compares the number of rising and falling stocks.
- Scan new highs and lows. On 14 October, a modest index fall hid 521 new Nasdaq lows.
- Compare equal-weight indexes. If equal-weight beats cap-weight, buying is spreading more widely.
- Look at moving averages and small caps. A falling share of stocks above their moving averages (average prices over a set period), or weak small caps, suggests broad stress.
These checks tell you whether a green sector reflects broad buying or a few heavyweights. That decides whether you treat it as a real trend.
Rotation or risk-off? A quick test
Risk-off means investors selling risky assets broadly, rather than switching between sectors. Real rotation shows defensives rising early and with strong breadth.
Schwab Asset Management, 7 October Schwab warned against calling the move a conventional defensive rotation, citing concentration, weak breadth and large-cap leadership. It noted utilities, staples and real estate were initially among the weaker groups.
That early weakness does not fit a clean defensive story, so treat the rotation label with some caution.
Australian bank reporting season, NAB’s job cuts and the risks to the rotation
The next test for the Australian bank rally is close. Three of the big four report within eight days.
| Bank | Reporting date |
|---|---|
| Westpac | 2 November 2026 |
| NAB | 5 November 2026 |
| ANZ | 9 November 2026, 10:00 a.m. AEDT |
| CBA | Reported in August 2026; next report February 2027 |
Four issues will decide how the results land:
- Net interest margins: the gap between what banks earn on loans and pay on deposits, squeezed by deposit competition and funding costs.
- Bad debts and arrears: loans that go unpaid or fall behind.
- Loan growth: how fast lending is expanding.
- Valuations: how much income-seeking demand is already in the share price.
What NAB’s cuts may signal
NAB plans to cut up to 2,500 roles, about 6% of its workforce. Up to 1,500 will go by the end of 2026, with the programme due to finish by June 2027. NAB cited pressure on credit growth, so the cuts look like both a cost measure and preparation for slower lending.
What could undercut the rotation
The risks reach well beyond banks. Defensive stocks can become expensive when crowds pile in, and oil near $113 could lift inflation and rate expectations. The Australian consumer also looks fragile: Nick Scali reported Australia and New Zealand written orders down 15% year on year, store traffic down about 10%, and first-half revenue there expected to be 11%-14% lower, even as UK orders rose 29%.
Goldman Sachs strategist Ben Snider pointed investors worried about AI towards healthcare and staples. Cboe described the moves as a rotation cycle. History is less tidy: some Dow-over-Nasdaq episodes fade quickly, while others come before a wider correction.
If you hold Australian banks for income, November is where the 6% rally gets tested. NAB’s cuts suggest that margins and credit growth deserve your closest attention.
For readers weighing the income case for banks, our detailed coverage of ASX bank valuations compares forward earnings multiples against European and UK peers.
These statements are speculative and subject to change based on market developments and company performance. Past performance does not guarantee future results.
What the rotation shows, and what it does not prove yet
Both markets favoured defensives after 6 October, which points to global drivers rather than local ones. Energy and banks split for structural reasons, and the calm Dow masked real weakness across Nasdaq stocks.
The evidence is still mixed between a lasting rotation and a broader risk-off move. Bank results, oil prices and interest rates are the variables likely to settle the question over the coming weeks.
Before you act on any sector heat map, check breadth and equal-weight data to see whether the move is broad or narrow. Treat crowded defensive valuations with care, because shelter bought at a high price offers less protection.
This article is for informational purposes only and should not be considered financial advice. Investors should conduct their own research and consult with financial professionals before making investment decisions.