When CoreWeave lost about a quarter of its value in the week ending 16 October 2026, Microsoft and Meta slipped only about 1% each, while ASML was still reporting very strong demand. If AI demand had cracked, the whole group would have fallen together. The AI stock selloff was not the simple “AI is over” moment it looked like on the screen.
The damage was still real. Reuters reported that nearly $2 trillion had been erased from US chipmakers’ market value since the prior week. The Nasdaq Composite fell about 4.5% and the S&P 500 about 2%.
For you, the hard part is that a falling price tells you nothing about whether you are looking at a bargain or a trap.
This piece covers what actually drove the move, and gives you a valuation lens for judging Nvidia, ASML and Micron at today’s prices.
Why did AI stocks fall by such different amounts?
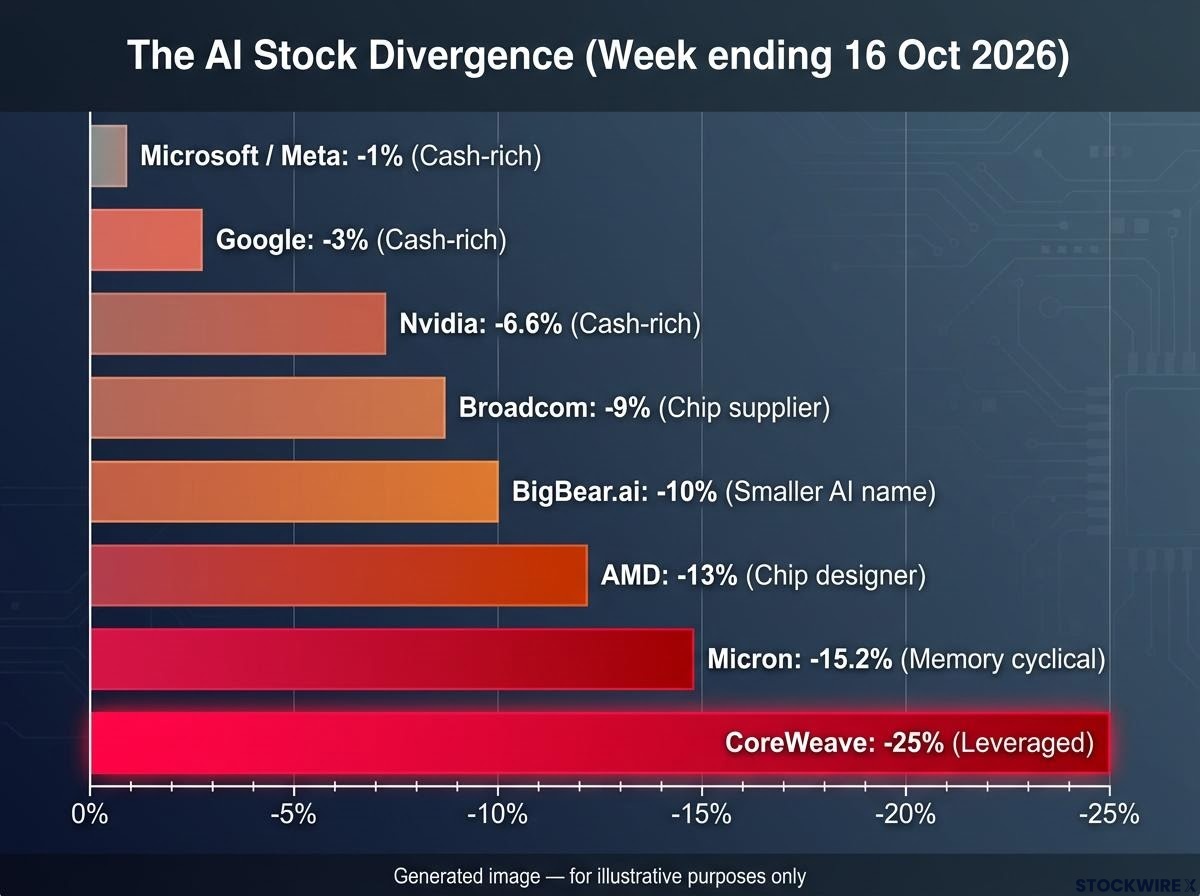
Start with the spread. Over the week ending 16 October, AI-linked names fell by wildly different amounts.
| Security | Weekly move | Balance-sheet profile |
|---|---|---|
| CoreWeave | About -25% | Leveraged |
| Micron | -15.2% | Memory cyclical |
| AMD | About -13% | Chip designer |
| BigBear.ai | About -10% | Smaller AI name |
| Broadcom | About -9% | Chip supplier |
| Nvidia | About -6.6% | Cash-rich |
| About -3% | Cash-rich | |
| Microsoft / Meta | About -1% | Cash-rich |
Nvidia slid from $229.28 to $214.13. Sources differ on the hyperscalers: single-day reports for 16 October had Microsoft down roughly 2% to 2.5% and Meta down nearly 4%, larger than the weekly framing implies.
The triggers stacked up over about two weeks. Chinese memory maker CXMT showed progress in advanced memory, CoreWeave’s bonds sold off, reports suggested Anthropic’s growth was slowing, and hotter inflation, higher oil and rate-hike worries added weight. On 12 October, Broadcom CEO Hock Tan told the DBS Asia Future Forward Conference that capital could become the biggest constraint on AI expansion, even as he said demand could exceed supply through 2029-30.
The leverage proxy Reuters described CoreWeave as a proxy for other highly leveraged AI infrastructure companies.
The dividing line was debt. Ted Mortonson of Baird said investors were tiring of the “Bank of Nvidia,” meaning suppliers helping finance their customers, while John Dinsdale of TechInsights expected investors to separate established wholesale operators from riskier neoclouds.
Keep proportion, too: the Nasdaq typically falls harder than the S&P in downturns, and this was not a bear market. What this tells you is that the market was pricing financing risk, not abandoning AI, so a blunt “sell AI” or “buy AI” reflex misses the point.
When big ASX news breaks, our subscribers know first
How financing stress works, and the terms you need to read it
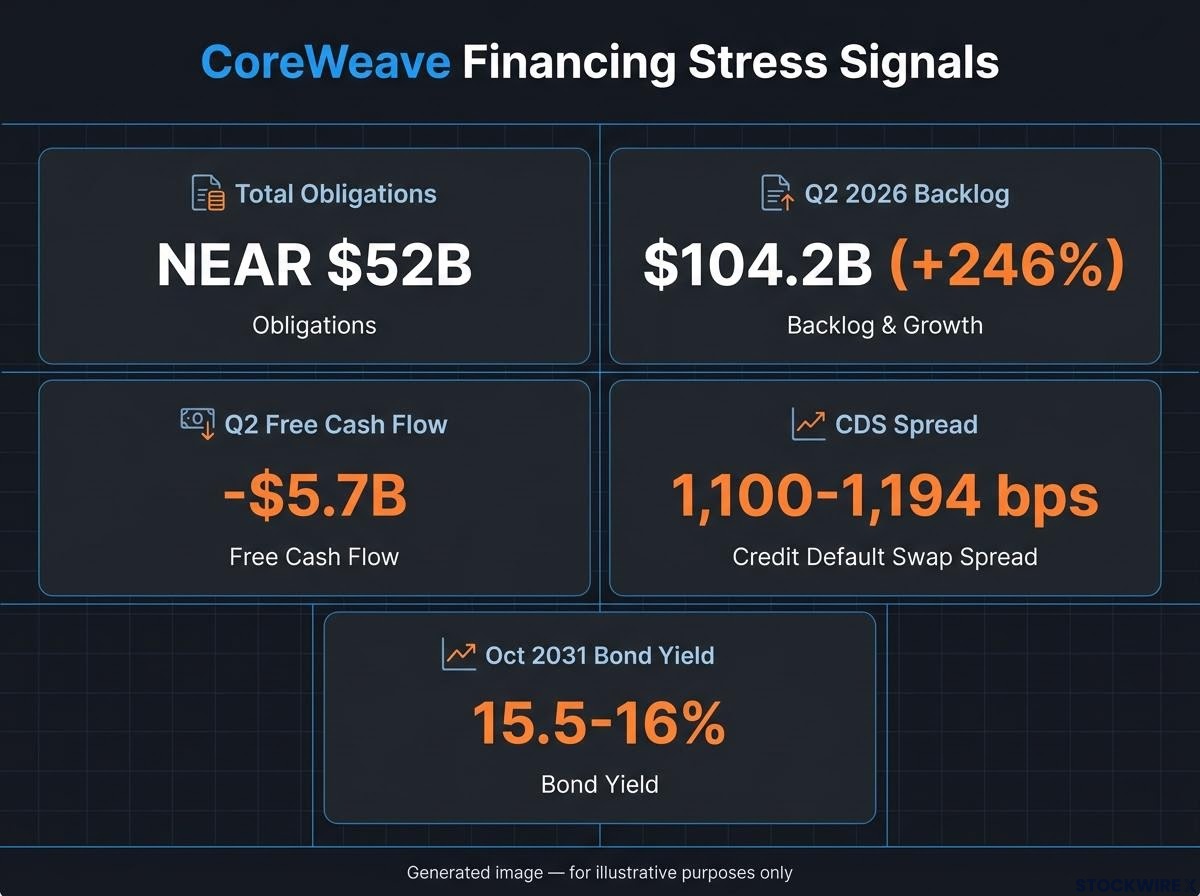
At one point, CoreWeave’s October 2031 bonds briefly yielded about 15.5-16%. A yield that high is lenders demanding to be paid for real fear of not getting their money back.
What the credit signals mean
A credit default swap (CDS) is a contract that pays out if a borrower defaults, and its spread is the yearly cost of that protection in basis points, where 100 basis points equals 1%. CoreWeave’s CDS spread hit a record above 1,000 bps, reaching roughly 1,100-1,194 bps. A neocloud is a newer company that rents out AI computing capacity, usually funded with heavy borrowing.
The mechanism runs in four steps:
- Higher rates raise construction and equipment costs.
- Debt-heavy firms refinance more often, at wider spreads.
- Rising interest erodes the expected return on each data centre, pushing it below the hurdle rate (the minimum return a project must earn to be worth funding).
- Credit stress threatens future borrowing before it touches current revenue.
| CoreWeave metric | Figure |
|---|---|
| Notes, loans and bonds | About $35.6B |
| Total obligations incl. leases | Near $52B (Reuters cited about $50B) |
| Q2 2026 backlog | $104.2B, up 246% |
| Q2 interest expense | $640M vs $267M a year earlier |
| Q3 guided interest expense | $860M-$940M |
| Q2 free cash flow | -$5.7B |
Backlog is work customers have committed to but not yet paid for; realised revenue is money actually earned. CoreWeave’s interest already consumes about a quarter of revenue, so a big backlog does not protect you if interest drains the cash first. Check how any AI company funds its growth before you look at how fast it grows.
The gap between borrowing costs and return on capital is the core issue: HSBC estimates CoreWeave’s average return at 8.9% for 2026-30, well below the 15-16% its bonds yield, so each new debt-funded dollar can destroy value.
Why the biggest spenders held up better
Microsoft and Meta have large cash flows, established businesses, easy bond-market access and less need to keep refinancing new facilities. S&P Global cautions, though, that hyperscalers may carry more AI-linked obligations than reported debt suggests, through guarantees on data-centre projects and smaller AI firms.
Is AI spending paying off? The bull and bear cases
The spending is enormous. Microsoft, Amazon, Alphabet and Meta are projected to spend roughly $720-$745 billion on capex in 2026, while a Reuters/LSEG basket that adds Oracle came to about $730 billion. These are different groups of companies, so the figures are not directly comparable.
Hyperscaler capex reached $130 billion in the first quarter alone, and those four companies issued $121 billion of debt in 2025, about four times the five-year average, which complicates the self-funding argument.
The payoff runs in three stages: suppliers profit first, cloud firms grow but must keep spending, and returns for the businesses actually using AI remain unknown.
The bull case has real momentum. Broadcom’s AI chip sales grew 221%, ASML says customers are ordering into 2029-30, and Micron says orders exceed capacity while it raised planned US investment above $250 billion through 2035. Google Cloud earns about a 35% margin, and the hyperscalers can fund much of the buildout internally.
Then comes the bear arithmetic. Meta generated $32 billion of cash last quarter but kept under $1 billion after capex, and Amazon’s free cash flow turned negative.
The revenue bar Gartner estimates AI data-centre owners need $8.5 trillion of cumulative revenue through 2030 to cover capex, financing costs and a 12% return.
| Bull case | Bear case |
|---|---|
| Most firms have barely begun using AI | Overbuilding on the assumption demand stays exceptional |
| Suppliers earning real money | A few customers drive most spending |
| Orders booked into 2029-30 | Power, land and grid costs rising |
| Hyperscalers can self-fund | Chips depreciate as newer ones arrive |
| Long-lived assets serve many AI generations | Unproven monetisation and refinancing risk |
One analytical framing, not documented by any named October 2026 source, is the telecom fibre overbuild: traffic grew, but pricing collapsed and indebted operators failed. The parallel is financial, not technological. Strong supplier results prove the spending is real, not that the spenders earn adequate returns, so do not treat a supplier’s growth as proof the whole chain is profitable.
What valuation models say about Nvidia, ASML and Micron
All three are strong businesses. The question is what their prices already assume. The scenario figures below come from one presenter’s low, middle and high model, shown to illustrate method; they are not stock advice.
Nvidia
Nvidia’s FY2026 revenue reached $215.9 billion, up 65%, with Q4 at $68.1 billion, up 73%, and gross margins above 70%. The stock trades at about 42x free cash flow and 27-28x earnings. The model’s outcomes span $150, $540 and about $750, implying about 21% a year in the middle case at $217, but only about 5% in the low case. Risks include customer concentration, in-house chips and exclusion from China.
ASML
ASML posted Q3 sales of €11.7 billion, net income of €5.0 billion and a 57.5% gross margin, guiding to €44-€45 billion for 2026. It trades at 57x free cash flow and 54x earnings. Model outcomes of $550, about $940 and about $1,585 imply just 2.6% a year in the middle case at $1,670, though the presenter concedes the assumptions may be conservative. No October 2026 analyst price target was located; export limits and cyclicality are the main risks.
Micron
Micron’s fiscal 2026, which ended 3 September according to the company release, delivered revenue of $133.19 billion against $37.38 billion, a gross margin of about 81% and GAAP net income of $84.97 billion. UOB Kay Hian puts it at about 6x estimated 2027 earnings, a multiple that may reflect expectations that memory profits will normalise in a historically boom-and-bust industry. With model outcomes of $315, $640 and $1,260, a price of about $925 needs 17%+ growth for a decade. UOB views CXMT as constrained by scale, lagging technology and negligible exposure to HBM (high-bandwidth memory, the stacked chips used in AI servers).
| Company | Key valuation metric | Model low/middle/high | Main risk |
|---|---|---|---|
| Nvidia | 42x FCF, 27-28x earnings | $150 / $540 / ~$750 | Customer concentration, China |
| ASML | 57x FCF, 54x earnings | $550 / ~$940 / ~$1,585 | Export limits, cyclicality |
| Micron | ~6x est. 2027 earnings (UOB) | $315 / $640 / $1,260 | HBM execution, memory cycle |
The core idea A crash makes a stock cheaper, not necessarily cheap.
The lower prices make these stocks cheaper than last week, but you still need to ask whether you believe the growth already built into forecasts at today’s price.
How to judge a dip without guessing
All of that valuation work comes down to a test you can run on any falling stock this week:
- Check funding strength. Can the company pay for growth from its own cash?
- Separate backlog from realised revenue. Reservations can be renegotiated or delayed.
- Compare the price with your own growth assumptions. Nvidia’s range, from about 5% to about 21% a year, shows how much rides on them.
- Size the position for the downside. A $10,000 position falling 15%, Micron’s weekly move, loses $1,500.
A great story can be a poor investment at the wrong price. A cyclical downturn can arrive even when long-term demand is sound, and hyperscaler spending can support suppliers while giving the spenders weak returns.
Even a company far safer than CoreWeave can overpay for capacity. Valuation tools protect you from both panic selling and overpaying, because whether a dip is an opportunity depends on the price you pay and the assumptions you can defend, not on how far the stock has fallen.
Investors weighing Nvidia’s 27-28x earnings can read our full explainer on Nvidia’s compressed forward multiple, which examines the rate-sensitive buyers behind roughly $40 billion of data centre revenue.
What the selloff changes, and what it does not
Last week’s selloff repriced financing and return on capital. It did not show AI demand disappearing. The market separated cash-rich firms from leveraged builders, and that distinction now matters more than simple AI exposure.
From here, four variables deserve your attention: refinancing costs and credit spreads for leveraged builders, whether hyperscaler capex keeps outrunning cash generation, memory pricing and supply, and whether backlog converts into revenue. Your decision on any of these stocks rests on which of those you are willing to bet on, at what price.
This article is for informational purposes only and should not be considered financial advice. Investors should conduct their own research and consult with financial professionals before making investment decisions. Past performance does not guarantee future results. Financial projections are subject to market conditions and various risk factors.