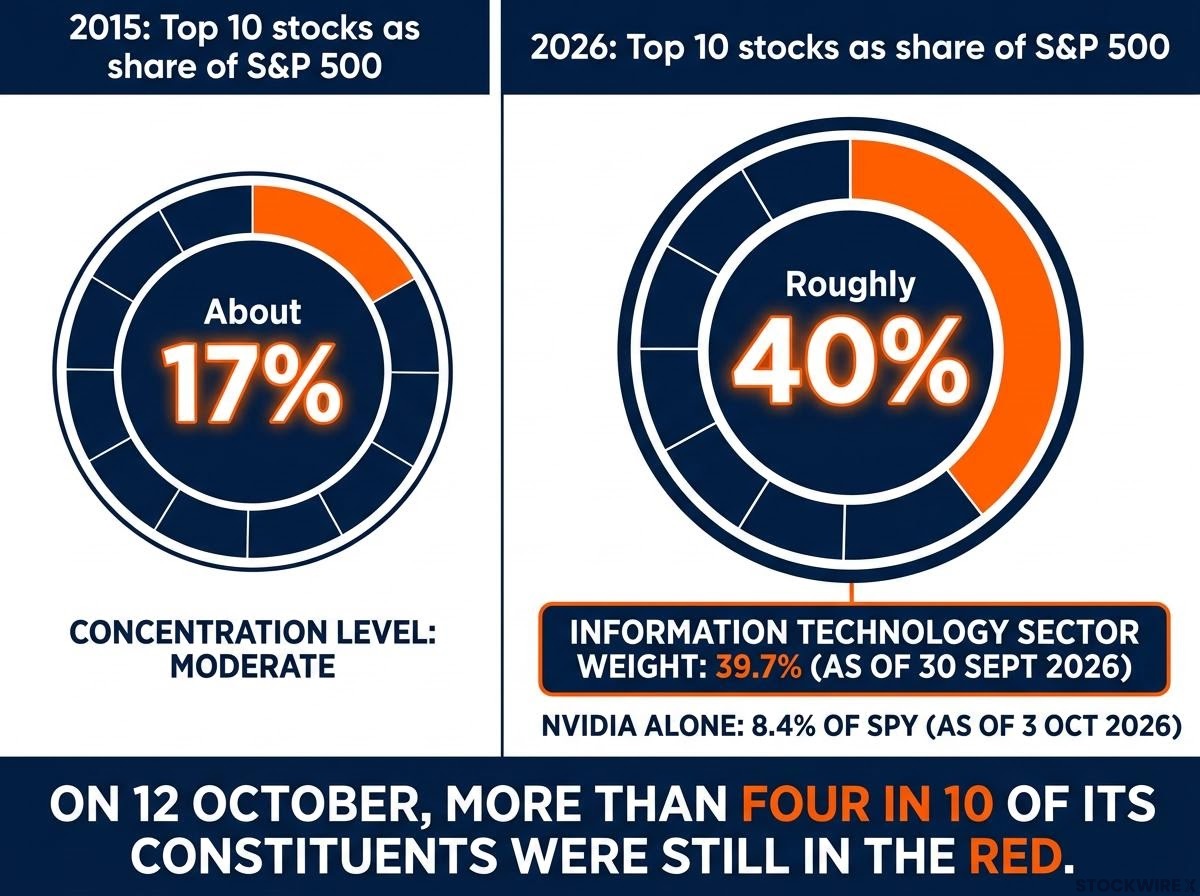
Owning 500 companies sounds like the definition of spreading your bets. Yet information technology made up 39.7% of the S&P 500 at 30 September 2026, according to S&P Dow Jones Indices data. On 12 October, with the index sitting at record highs, more than four in 10 of its constituents were still in the red.
That gap between the headline and what sits underneath is the index fund tech concentration problem. It matters more this week than it did a month ago.
September consumer prices rose 3.7% year over year, and a mid-October report put the futures-implied odds of a December rate hike at 89.5%. Housing indicators have just fallen to multi-year lows. If you hold an S&P 500 fund inside a 401(k), all three threads run through your account.
Here is a way to test how diversified your own holdings really are, along with a candid look at what gold can and cannot do for you while rates are climbing.
Why a 500-stock fund can still be a concentrated bet
The comfortable assumption goes like this: an index fund owns hundreds of companies, so no single theme can sink it. Company count, though, is not the same thing as economic exposure.
The S&P 500 is cap-weighted. That means each company’s share of the index is set by its market value, the total worth of its shares. As winners grow, they take up more of the fund, so your money drifts toward whatever has already run hardest.
Cap-weighting turns rising prices into rising index weight, and that loop is the engine of index concentration risk; when a few names dominate, a single company’s bad day can pull an entire benchmark lower.
The concentration figure Information technology was 39.7% of the S&P 500 as of 30 September 2026, according to Charles Schwab, using S&P Dow Jones Indices data.
The drift becomes clear when you set today beside a decade ago.
| Measure | 2015 | 2026 |
|---|---|---|
| Top 10 stocks as share of S&P 500 | About 17% | Roughly 40% |
| Information technology sector weight | Not available in cited data | 39.7% |
| Top 10 tech stocks as share of tech sector | Not available in cited data | 76.1% |
The 2015 figure comes from Ben Carlson of A Wealth of Common Sense, cited by Yahoo Finance on 14 October. Morningstar found on 3 October that Nvidia alone was 8.4% of SPY, with the ETF’s top 10 holdings above 40%. The concentration stacks: a big slice in tech, and most of that slice in a handful of names.
Then comes the overlap trap. Many savers hold more than one fund that leans the same way:
- An S&P 500 index fund as the core
- A Nasdaq-100 fund such as QQQ
- A technology or semiconductor sector ETF
- A growth or AI-themed fund
What this tells you is that one earnings miss or valuation reset among a few AI-linked companies would hit your 401(k) far harder than the “500 companies” label suggests.
Why this is not the same as a bubble call
Concentration describes risk; it does not predict a crash. Morningstar found in June 2026 that rising concentration has not clearly delivered superior excess returns for the average fund. It also acknowledges that tech’s weight rests on strong earnings growth, so the size reflects real profits as much as enthusiasm.
When big ASX news breaks, our subscribers know first
How rate hikes, housing and AI earnings connect to your index fund
That concentration would matter less if rates were standing still. They are not.
September CPI rose 3.7% year over year, above the 3.6% expected and up from 3.4% the month before, according to CNBC on 14 October. The Federal Open Market Committee (FOMC), the Fed body that sets rates, raised its target range by 25 basis points to 3.75%-4.00% on 16 September. A basis point is one hundredth of a percentage point.
Markets expect more. Futures priced an 89.5% chance of a December hike in a 15 October report, and CNBC put the odds of at least one more increase by year-end above 96%. John Fenick of Fenick Consulting is more measured, estimating 60-70% for the 9 December meeting.
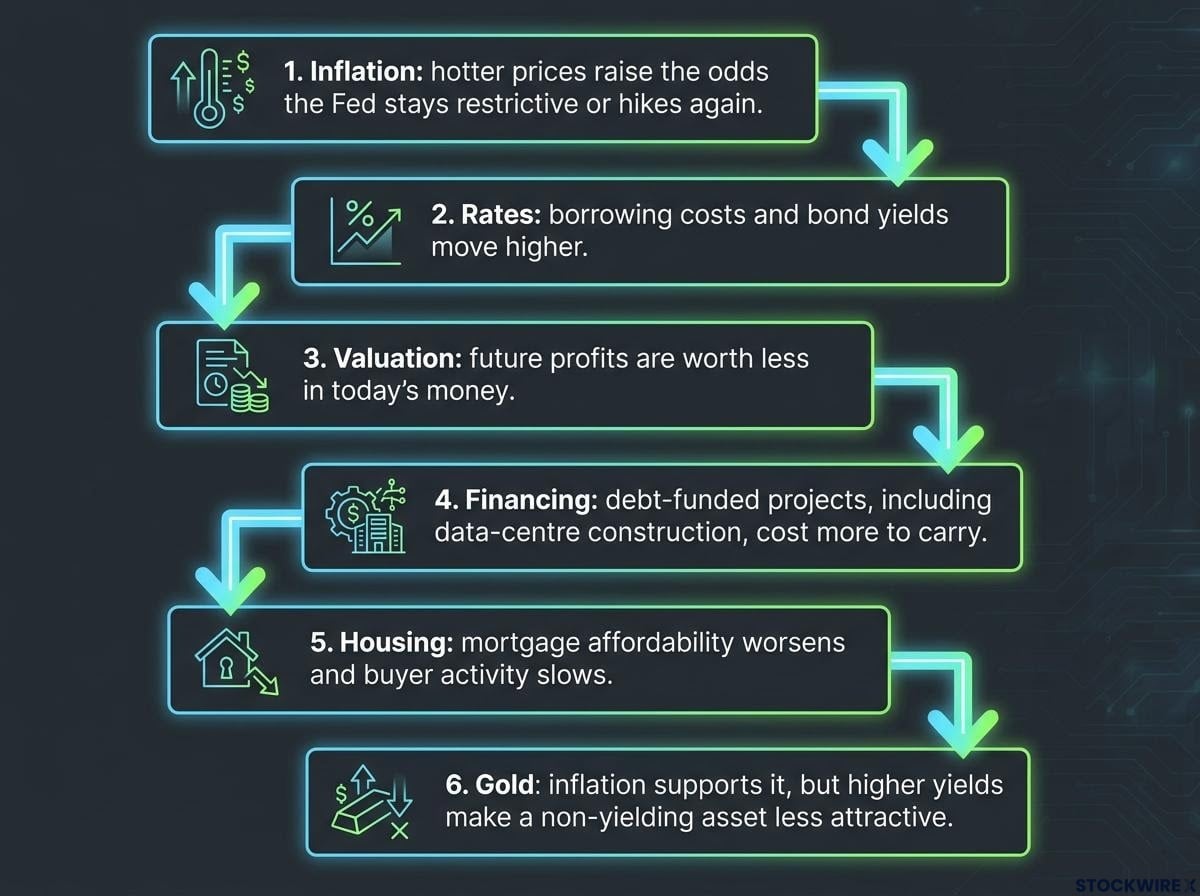
The transmission chain runs like this:
- Inflation: hotter prices raise the odds the Fed stays restrictive or hikes again.
- Rates: borrowing costs and bond yields move higher.
- Valuation: future profits are worth less in today’s money, which hits expensive growth stocks hardest because more of their value sits years ahead.
- Financing: debt-funded projects, including data-centre construction, cost more to carry.
- Housing: mortgage affordability worsens and buyer activity slows.
- Gold: inflation supports it, but higher yields make a non-yielding asset less attractive.
Step four is where AI meets the Fed. Tom Plumb of the Plumb Balanced Fund told Reuters on 16 October that debt-funded data-centre building creates financing and liquidity risks, even as the AI boom produces genuine winners.
“An aggressive rate-hike cycle would be difficult for equities,” was the view of Ross Mayfield, strategist at Baird, speaking to Reuters on 12 October.
Put together, your equity exposure is effectively a leveraged view on both AI earnings and the rate path. A December hike matters to your retirement account even if you never place a trade.
Concentration and rate sensitivity compound rather than simply add together, so a yield-driven de-rating in mega-cap tech would produce an outsized index-level decline compared with a more evenly spread market.
Where gold fits in the chain
Gold sits awkwardly in this picture. Bob Haberkorn of StoneX told Reuters that Treasuries looked more attractive than gold as a safety asset, while Ricardo Evangelista of ActivTrades argued that persistent inflation kept tightening expectations alive even as higher rates dulled gold’s appeal.
Spot gold rose to $4,169.48 an ounce on 15 October and sat near $4,177.14 the next day. By 20 October it had edged lower as traders reassessed hike odds. The metal responds to the same rate signal your stocks do.
What housing weakness is really signalling
The housing numbers released this week look alarming on first read.
- NAHB/Wells Fargo Housing Market Index (19 October): down 3 points to 29, with current sales at 33, expected sales at 32 and buyer traffic at 18.
- NAR pending home sales (20 October): September down 7.3% month on month and 11.3% year on year, to an index of 66.0.
Builder sentiment The index of homebuilder confidence is at its lowest level since June 2012.
Both releases linked the slide directly to higher rates. Weakness here spreads outward into builders, materials suppliers, lenders, brokers and durable-goods makers, which are the cyclical earnings the broader index still relies on. Fenick points to 2008-09 as evidence that housing stress can bleed into equities.
That comparison needs care. Today’s slump is an affordability squeeze driven by borrowing costs, not evidence of a banking system collapsing under bad loans.
There is also a less obvious angle. Cooling housing can eventually pull inflation lower, which may give the Fed reason to stop sooner than futures imply. For you, weak housing is a gauge of how hard the rate squeeze is biting, not an automatic sell signal.
Three market regimes compared: 2008-09, 2016 and 2022
History offers useful channels to watch, though no single precedent fits cleanly. Each shares one ingredient with today, but none shares the whole recipe.
| Period | Mechanism | Equity/gold outcome | Relevance today |
|---|---|---|---|
| 2008-09 | Leveraged banking and housing collapse | Gold up about 21% from December 2007 to February 2009 | Shows housing transmission channels; today’s slump is rate-driven, not a banking failure |
| 2016 | Gradual Fed normalisation | Metals rally ended in August 2016, not recovered until January 2019 (per Fenick) | Index is now more rate-sensitive given far larger tech weights |
| 2022 | Aggressive tightening, slowing growth | S&P 500 down about 19% for the year; gold roughly flat | Closest parallel: stocks and bonds fell together |
In 2008-09, gold did its job as a crisis asset, but the trigger was a leveraged financial collapse that current data does not show. The 2016 episode echoes this year’s miners trade: GDX and GDXJ each gained more than 30% between 3 August and 28 August 2026 before reversing after Fed Chair Kevin Warsh’s Jackson Hole remarks. Today, though, the index carries far more rate-sensitive tech than it did then.
Some accounts frame September’s move as the Fed’s first hike in three years following Warsh’s August remarks. The official record confirms the 16 September increase to 3.75%-4.00%, which is the fact worth anchoring to.
Why 2022 is the uncomfortable fit
The 2022 cycle is the one that should give concentrated holders pause. Equities fell roughly 23% from January to October that year, according to a World Gold Council-based summary, while gold went roughly nowhere. Bonds offered little shelter either.
Fenick argues the Fed has less room than in 2016-2018, with US debt above $40 trillion, and Warsh declined to submit a projection dot. Constraints like that could shorten the cycle. The lesson for you is that gold is a conditional hedge, one that can stall when real yields rise.
A practical framework to test how diversified you really are
The 2022 lesson points to a practical question: how much of your account actually rides on one theme?
The broader market has already hinted at the answer. Reuters reported on 12 October that the S&P 500 was up about 14% year to date at record highs while more than four in 10 constituents were down. By 16 October the index was heading for a weekly loss on rate and AI-financing worries.
Tim Ghriskey of Ingalls & Snyder told Reuters that AI names are drawing investor attention while other parts of the market are neglected. Morningstar warns that index-fund investors are heavily exposed to the AI-spending earnings outlook.
You can run this audit on your own 401(k) this week:
- List every fund you hold, including target-date funds, and look up each one’s top holdings on the provider’s website.
- Add up your tech exposure across funds, counting the same mega-cap names each time they appear.
- Check your bond allocation and how much sits in short versus long-duration funds.
- Look for small-cap, value and non-US exposure, and note whether any of it is meaningful in size.
- Decide whether the result matches the risk you meant to take.
Morningstar suggests bonds, small caps, other fixed-income exposures and non-US or value holdings as ways to broaden a portfolio. Treat those as options to weigh, not instructions.
Equal-weighted alternatives assign every constituent the same share and rebalance regularly, which trims winners instead of letting them accumulate, though they have lagged cap-weighted peers during recent tech-led rallies.
There are fair counterarguments to keep this in proportion:
- Strong earnings may justify today’s tech weights if AI revenue meets expectations.
- The index still holds hundreds of companies; the issue is sector and factor tilt.
- AI financing risk may sit with specific data-centre financiers rather than the whole system, as Plumb suggested.
- Gold is an imperfect hedge that pays no interest.
The goal is knowing your true exposure and choosing it deliberately. Broad diversification will not prevent losses in a macro shock, but it reduces your dependence on one sector or narrative.
This article is for informational purposes only and should not be considered financial advice. Investors should conduct their own research and consult with financial professionals before making investment decisions. Past performance does not guarantee future results, and forward-looking views cited here are speculative and subject to change.
What the data supports, and what it leaves open
The evidence lines up in one direction. With roughly 40% of the S&P 500 in technology and about 40% in its top 10 names, hot inflation, slumping housing and high December hike odds leave a concentrated portfolio especially sensitive to rates and AI earnings.
What the data does not show is a guaranteed crash, or a guaranteed rescue from gold. The metal remains a conditional hedge that weakens when yields climb.
The variables worth watching are the next CPI and PPI releases, the FOMC decision on 9 December, the coming housing data and any AI earnings or financing news. Use the time before then to review what you actually own, and make sure your exposure is a choice rather than a default.
Investors exploring how to build protection beyond one asset can use our dedicated guide to building an inflation hedge portfolio, which lays out a layered structure.