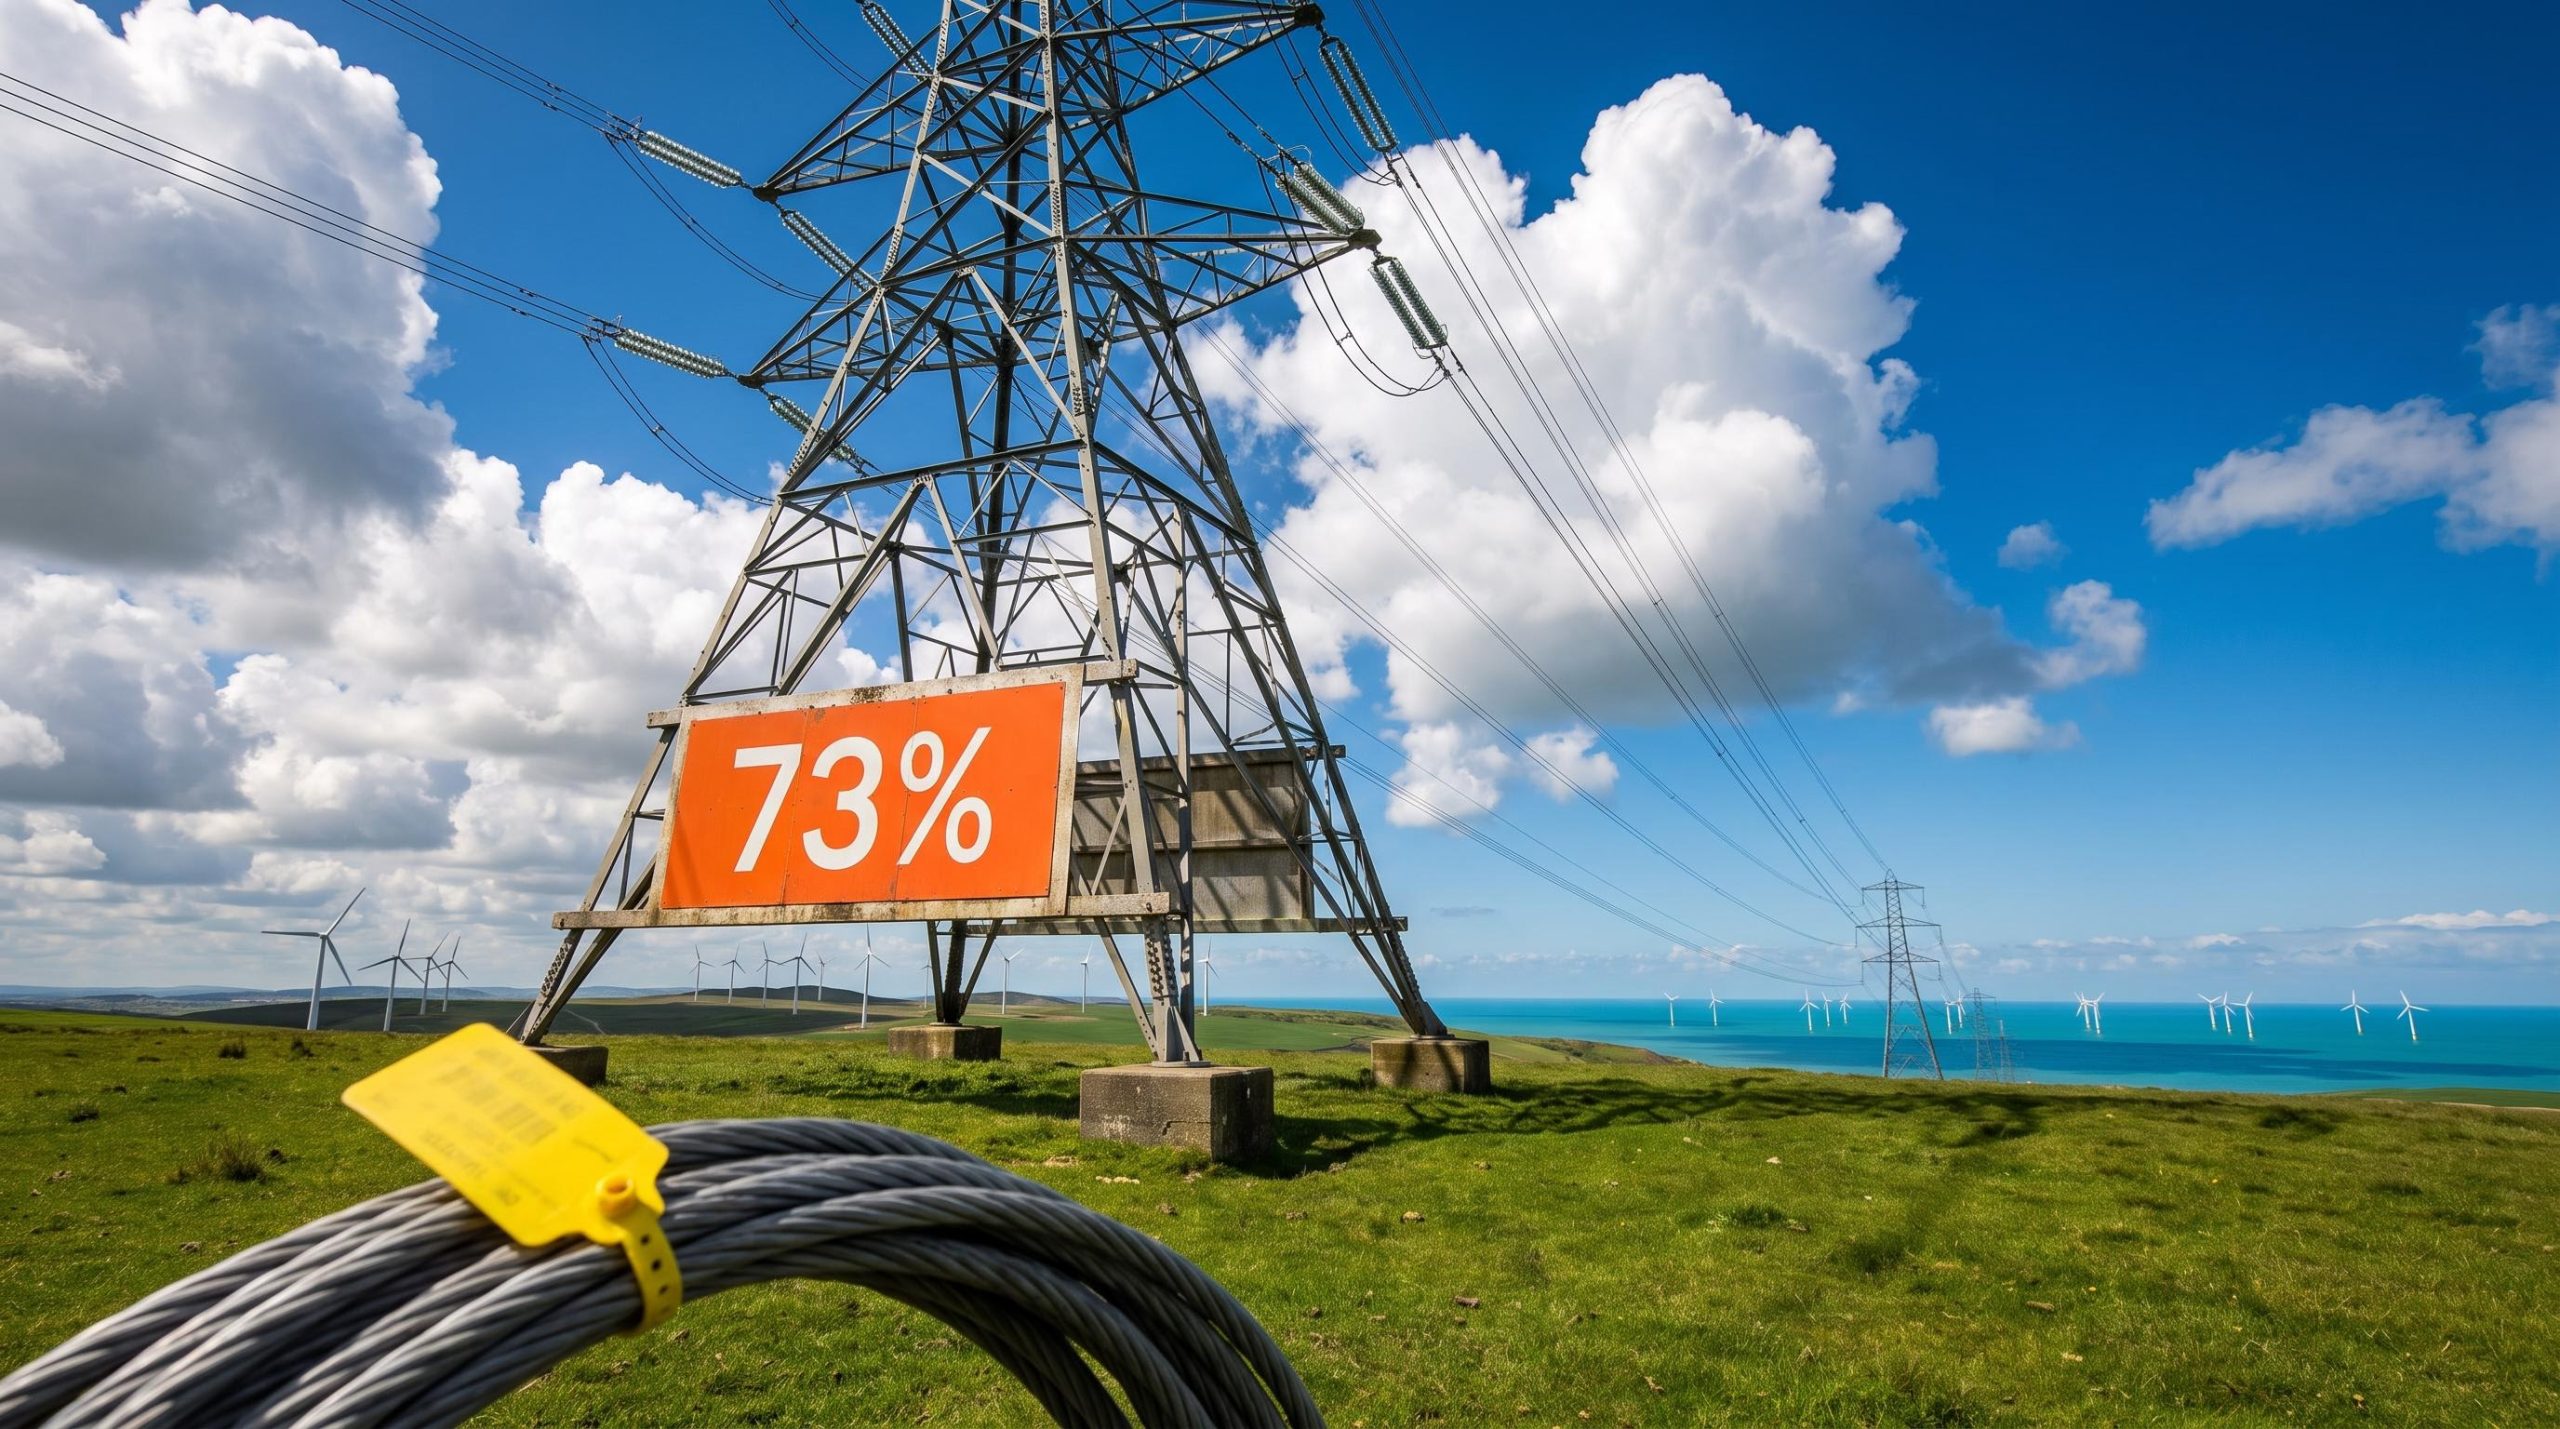
The UK’s clean-power story is usually told as a generation story: build more turbines, add more solar, and the job gets done. GlobalData’s latest outlook for the UK power market points somewhere else. Installed capacity is forecast to nearly double by 2035, with renewables making up 73% of the fleet, yet the firm’s own conclusion is that hitting those numbers depends on wires and market rules more than on procuring new generation.
That shift matters for anyone with money in the sector. Capital is moving into offshore wind, nuclear, transmission and flexibility assets. The asset in short supply is no longer ambition but capacity that can actually connect, get financed and get built.
The forecast is also only a forecast. It describes a plausible outcome, not a guaranteed construction schedule.
Here is where the real constraint sits, how the main funding models move risk around, and which parts of the investment case look firmest.
Does 73% renewables mean the UK power market is ready for the build-out?
On paper, the outlook is striking. In its report on UK power to 2035, GlobalData sets out a fleet transformed within a decade:
- Installed capacity nearly doubling between 2025 and 2035
- Renewables reaching 73% of installed capacity
- Renewables supplying roughly two-thirds of gross generation
- Offshore wind, solar PV, onshore wind and new nuclear driving most of the change
Gas stays in the system for flexible balancing, while nuclear provides firm low-carbon output. GlobalData analyst Attaurrahman Ojindaram Saibasan frames the challenge as converting a large pipeline into operating assets, and the firm’s update published this month keeps the near-doubling forecast intact.
GlobalData’s updated conclusion (October 2026) Delivery depends on faster grid connections, transmission expansion and market reform, not simply on procuring more generation.
Look closer and two quiet distinctions appear. The first is between capacity share and generation share: 73% versus about two-thirds.
Nameplate capacity is the maximum a plant can produce, and wind and solar rarely run at full output. That gap tells you the 73% figure overstates what the system will actually deliver, so treat it as a ceiling on ambition rather than a measure of output.
The second distinction sits underneath the headline. Demand is expected to rebound as transport, heating and industry electrify, while older nuclear stations retire before their replacements arrive. The forecast assumes projects clear connection, planning, financing and supply-chain hurdles along the way.
When big ASX news breaks, our subscribers know first
Offshore wind after AR7: has the pricing reset fixed delivery?
The most recent auction looked like vindication. On 14 January 2026, the Department for Energy Security and Net Zero (DESNZ) announced the results of Allocation Round 7 (AR7), describing it as a record offshore wind round.
| Technology | Capacity | Strike price (2024 prices) | Delivery years |
|---|---|---|---|
| Fixed-bottom, England and Wales | 6.9 GW (nine projects) | £91.20/MWh | 2028/29-2030/31 |
| Fixed-bottom, Scotland | 1.4 GW (one project) | £89.49/MWh | 2030/31 |
| Fixed-bottom, total | 8.4 GW | £90.91/MWh blended | 2028/29-2030/31 |
| Floating offshore wind | Not separately stated | £216.46/MWh | 2030/31 |
A strike price is the guaranteed price per megawatt-hour a project receives under its contract. For AR8, due to begin later in 2026, the fixed-bottom ceiling stays at £113/MWh. That figure is the maximum a bid can reach, not what anyone has been awarded.
Why did prices need to rise at all? Earlier projects stalled because costs moved faster than the contract framework:
- Inflation in turbines, steel, vessels, cables and construction services.
- Higher interest rates lifting the cost of financing long builds.
- Scarce installation vessels, subsea cables and turbine components.
- Longer connection and consenting timelines adding spend and inflation exposure.
- Fixed-price contracts leaving developers holding post-award cost increases.
- Revenue uncertainty from curtailment, transmission charges and possible market redesign.
Projects bid on stale assumptions became unfinanceable, and some were withdrawn, delayed or re-bid. Aurora Energy Research, in December 2025 work commissioned by RWE, argued offshore wind could be bought at up to about £94/MWh without raising consumer costs. That result depends on gas prices, demand, curtailment and connection dates, so it is a modelled outcome rather than a bill guarantee.
A strike price near £91/MWh tells you developers can finance projects again. It does not protect a contract from delay, negative-price or basis risk, and any of those can still sink a well-priced project.
Why the grid, not generation, is the binding constraint
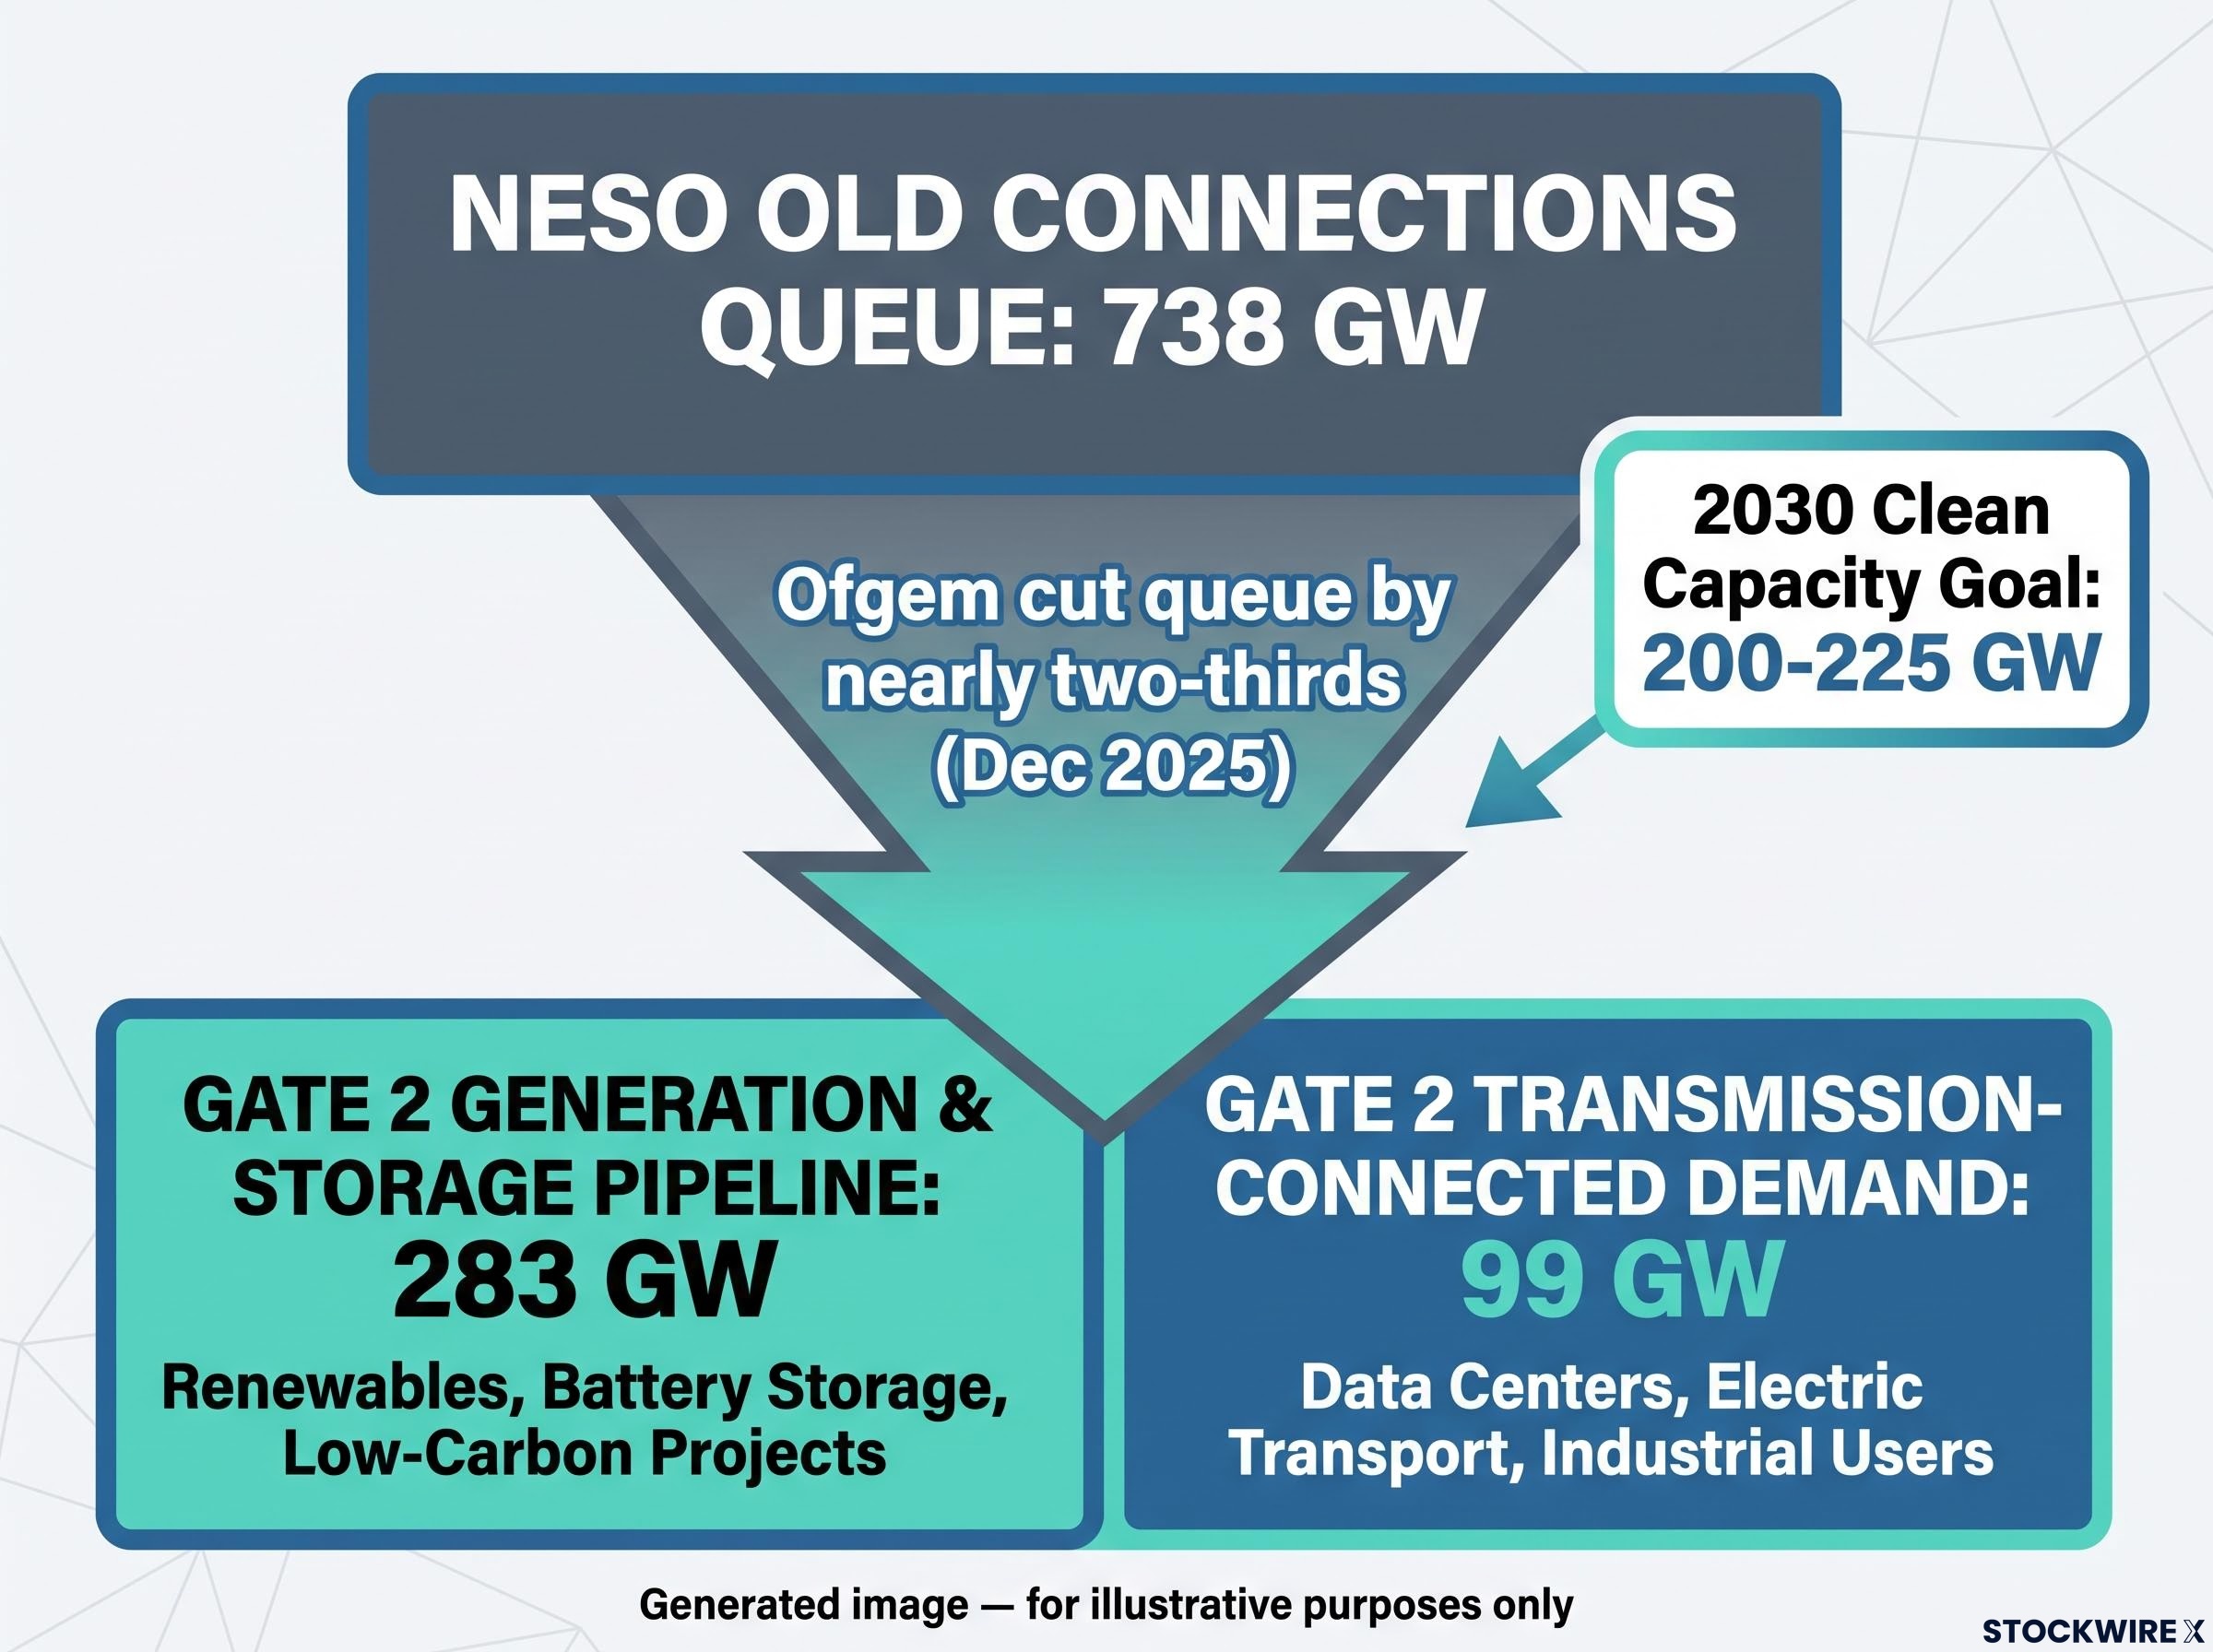
If price was the first problem, connection is the bigger one. Before reform, the National Energy System Operator (NESO) connections queue stood above 738 GW, against only 200-225 GW of clean capacity considered necessary for the 2030 goal.
The queue and Gate 2
The old system processed applications largely first-come, first-served, so speculative projects clogged the line. Ofgem approved reform in April 2025, introducing a Gate 2 test: projects must be sufficiently advanced and aligned with strategic plans to win a firm connection date.
The NESO connections reform process, approved by Ofgem in April 2025, replaced first-come, first-served processing with a Gate 2 test, aiming to strip out unviable projects from a queue that stood above 738 GW and prioritise those aligned with clean power goals.
The result is a much smaller list. NESO selected about 283 GW of generation and storage plus about 99 GW of transmission-connected demand, and Ofgem said in December 2025 that the queue had been cut by nearly two-thirds. Keep the figures separate: 738 GW was the old queue, 283 GW is the pipeline chosen to progress.
| Gate 2 phase | Network | Offer window |
|---|---|---|
| Phase 1 | Transmission and large embedded | Mid-May to mid-September 2026 |
| Phase 1 | Distribution | Early July to mid-November 2026 |
| Phase 2 | Transmission and large embedded | Early September 2026 to mid-January 2027 |
| Phase 2 | Distribution | Mid-October 2026 to mid-March 2027 |
Because a project earns nothing without a firm connection date, the offers now flowing through these windows are your most direct signal of which pipeline projects are genuinely investable.
Who pays for the wires
The funding figures describe different scopes. Ofgem’s RIIO-3 price control set £24.2bn of initial funding for 2026/27-2030/31, including a further £1.3bn under a “use it or lose it” mechanism, within a wider programme expected to reach roughly £80bn. Ofgem later reported a broader £28bn package, while the National Audit Office counted £17.7bn approved upfront of about £70bn potentially required.
The tension is real. Underbuild networks and generators sit idle; overbuild before generation and demand locations are certain, and consumers fund underused assets. Gate 2 handles this by filtering the queue rather than reinforcing the grid for every proposal.
How CfDs and the Regulated Asset Base shape the investment case
Every large power project raises one plain question: who carries the risk while it is being built? The UK uses two models to answer it.
A Contract for Difference (CfD) is a long-term deal that pays a renewable generator a fixed strike price. When wholesale prices fall below it, the generator is topped up; when they rise above it, the generator pays back the difference. Revenue becomes predictable, but the developer still funds construction.
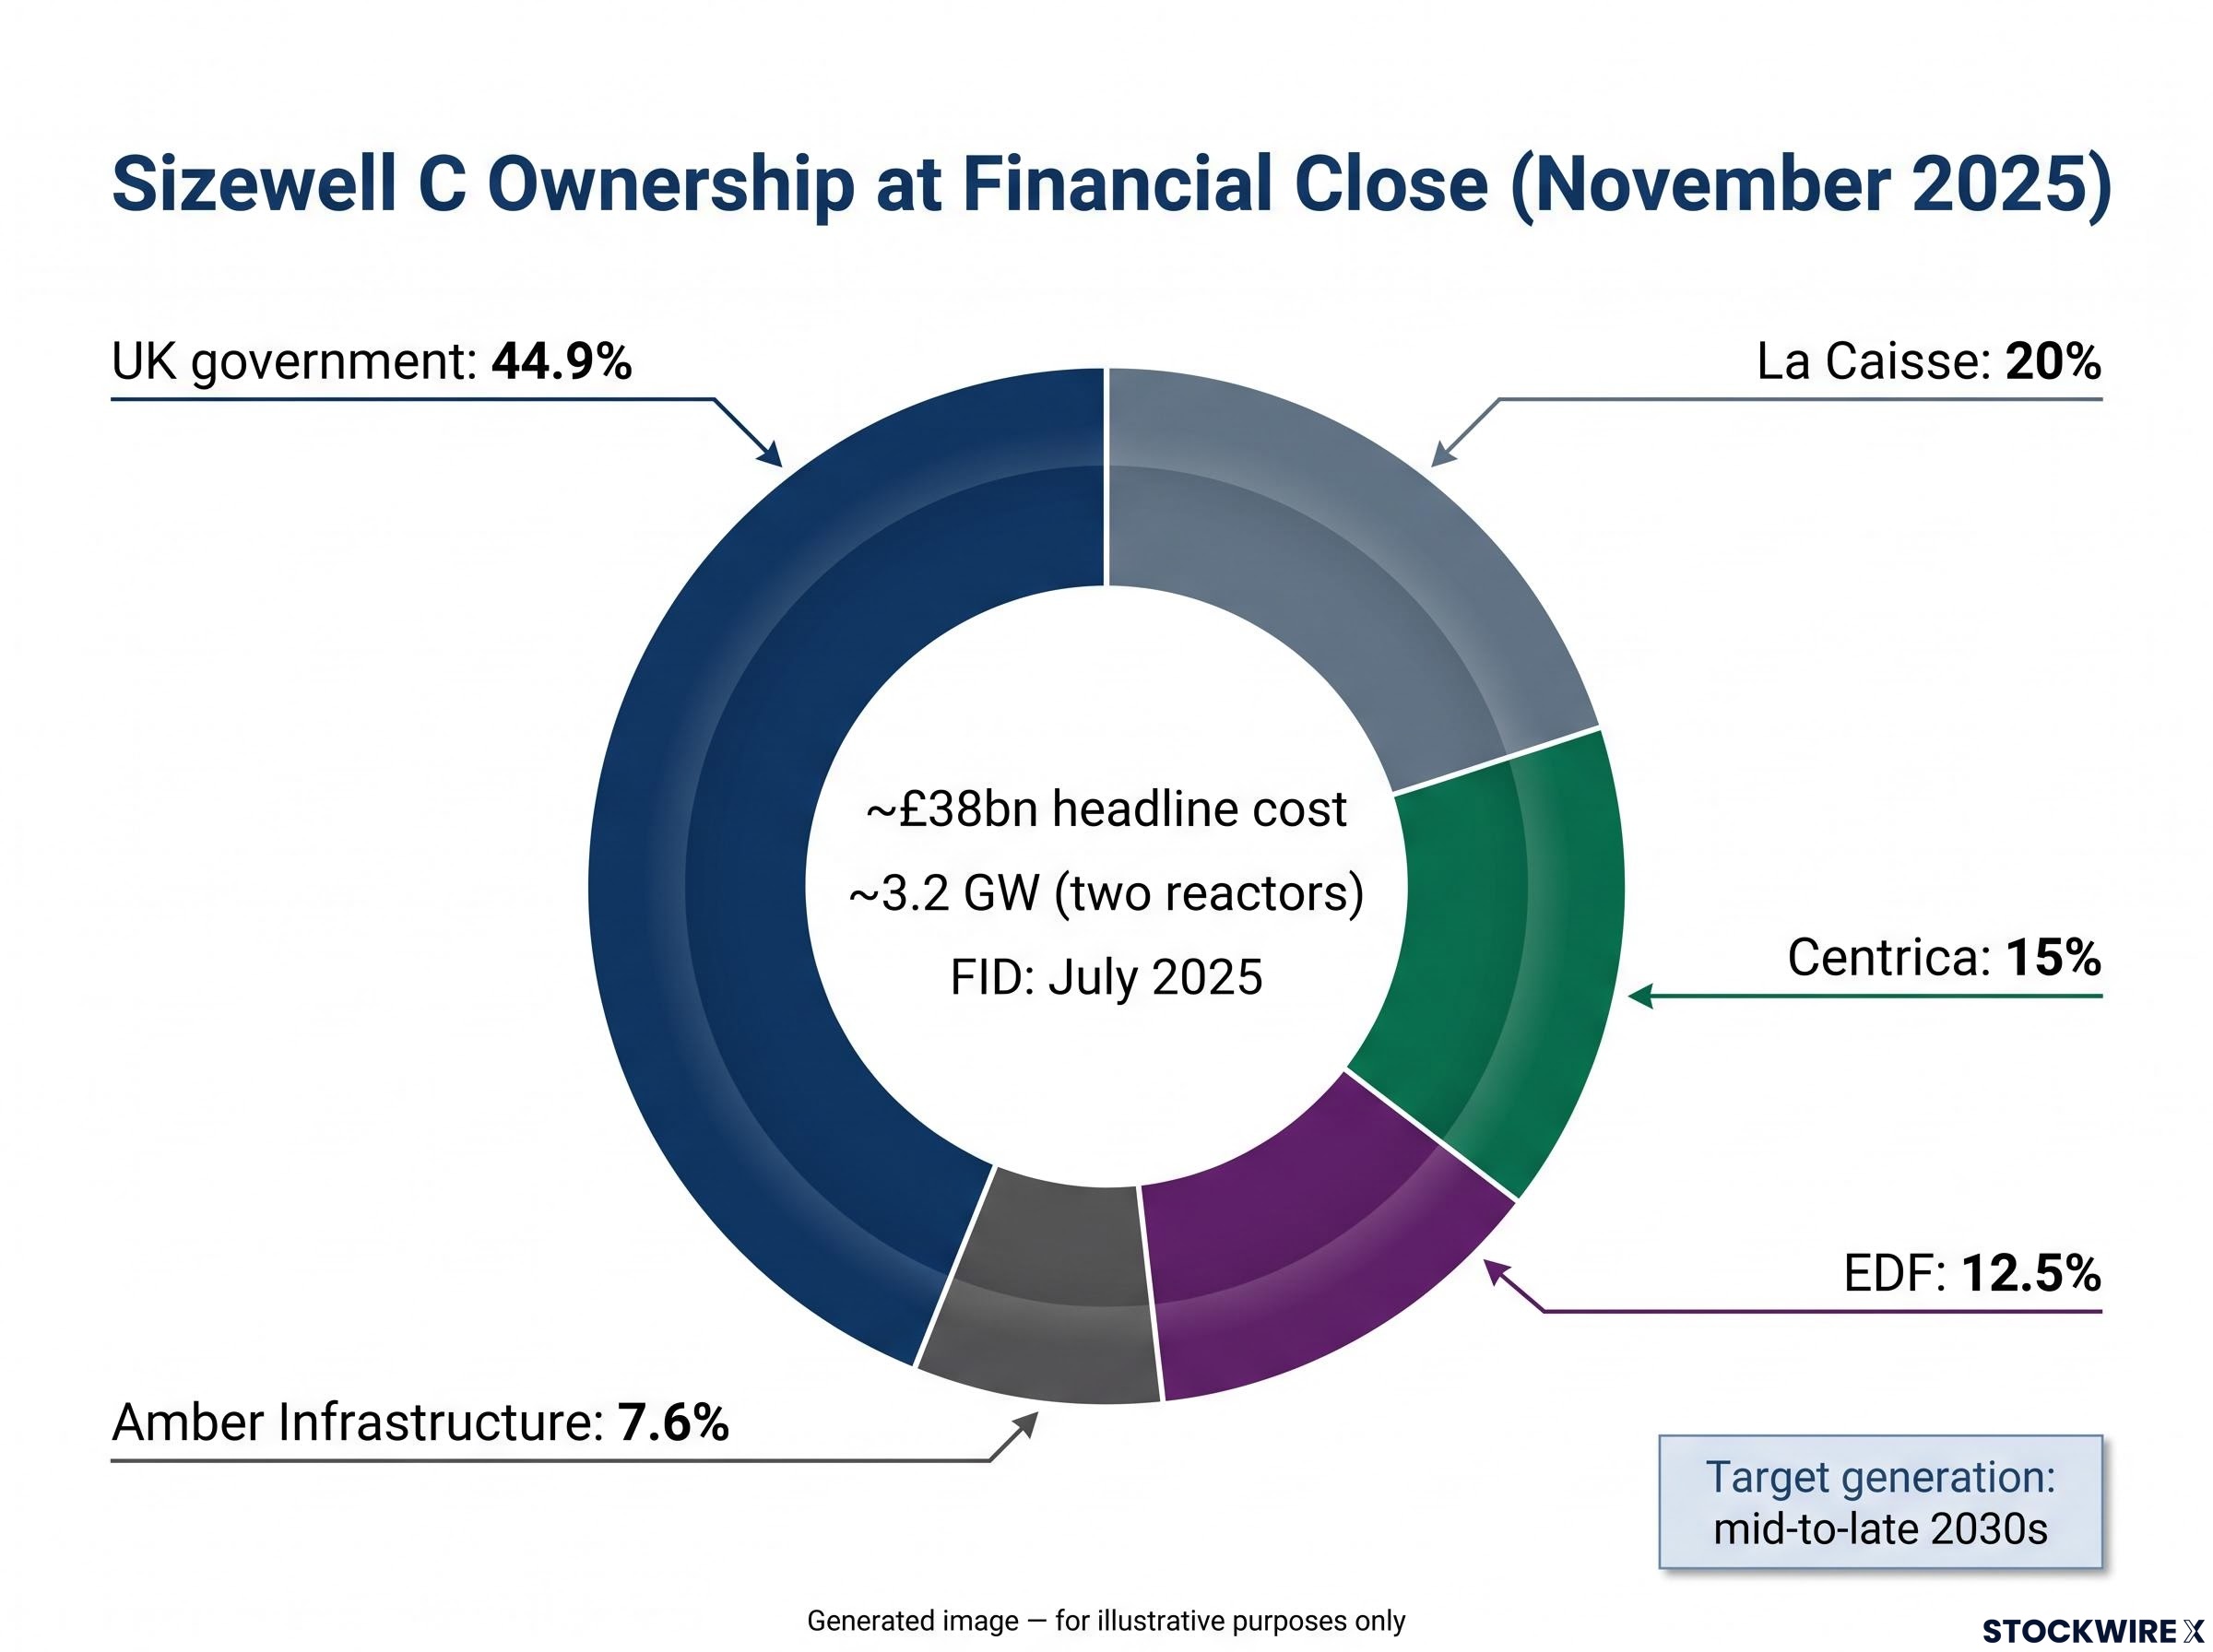
The Regulated Asset Base (RAB) model lets a project recover approved revenue from consumers during construction, before it produces any power. Sizewell C is the worked example: final investment decision in July 2025, financial close in November 2025, about 3.2 GW from two reactors, a headline cost of about £38bn and generation targeted for the mid-to-late 2030s.
| Feature | CfD | RAB |
|---|---|---|
| Who funds construction | Developer and its lenders | Investors, with consumers paying during the build |
| Revenue basis | Fixed strike price once operating | Approved revenue from construction onwards |
| Main risk | Cost inflation, delay, curtailment | Overruns shared with consumers and the state |
| Typical technology | Offshore wind, solar, onshore wind | New nuclear |
Sizewell C’s ownership at financial close shows how heavily the state is involved:
- UK government: 44.9%
- La Caisse: 20%
- Centrica: 15%
- EDF: 12.5%
- Amber Infrastructure: 7.6%
RAB cuts expensive construction-period debt and may lower the weighted average cost of capital, which is the blended return a project must pay its lenders and shareholders. Sizewell C is meant to benefit from copying the design of Hinkley Point C, yet Hinkley’s first power has slipped to no earlier than 2030 after a two-year delay announced in January 2024. Repeat design does not remove execution risk, and Rolls-Royce SMR, chosen as preferred bidder for small modular reactors at Wylfa, will face similar scrutiny.
Under RAB, consumers may pay before receiving electricity. That makes nuclear as much a political and public-finance exposure for you as a construction one: risk is redistributed, not removed.
Pricing evidence from outside the UK points the same way: long-dated corporate contracts are now valuing firm output at a premium, and European nuclear power investment is increasingly framed around life extensions and new builds that supply that scarce, schedulable capacity.
Market design, flexibility and the risks investors still carry
Locational pricing and flexibility
One major uncertainty has gone. In its 10 July 2025 update on the Review of Electricity Market Arrangements (REMA), the government kept a single GB-wide wholesale price and rejected zonal pricing, which would have set different prices by region.
Supporters of zonal pricing argued it would cut constraint costs and steer generation and demand to sensible locations. Opponents warned of revenue uncertainty and higher financing premiums, and the government sided with them through Reformed National Pricing, which relies on network charges, connection terms and spatial planning for locational signals. Removing zonal pricing resolves one question but not the cost of location, so you still need to price network charges, curtailment and connection timing into any UK asset case.
Flexibility fills the gaps but does not replace firm capacity. Interconnectors link the UK to France, the Netherlands, Belgium, Norway, Denmark and Ireland, yet imports depend on neighbours’ weather and markets. Storage handles intraday swings well but cannot cover long windless spells, and while Ember argues more renewables cut gas dependence, others warn that retiring gas too quickly could weaken security of supply.
Investor risk screen
| Risk | Implication |
|---|---|
| Consumer bills | CfD, network and RAB charges may lift bills before wholesale savings arrive |
| Consenting delays | Contract holders may miss milestones, raising costs or forcing re-bids |
| Grid delivery | Gate 2 filters the queue but does not guarantee on-time capacity |
| Curtailment and network charges | Revenues can shift even without zonal prices |
| Nuclear overruns and RAB socialisation | Delays become public-finance and political risks |
| Interest rates | Modest moves materially change costs for capital-heavy projects |
| Supply-chain concentration | Limited turbine, cable and vessel capacity drives delay and re-pricing |
| Policy execution | NESO, Ofgem and DESNZ reforms must move consistently |
Read together, these risks point one way. Financeable capacity has a credible connection, predictable revenue and manageable exposure to curtailment and construction inflation; nameplate ambition has none of those guarantees.
What the 2035 forecast changes, and what it does not
The direction is policy-backed, but delivery rests on grid connections, revenue certainty and construction discipline. Before judging any headline, run three checks:
- Is the price a ceiling (£113/MWh) or an awarded price (about £91/MWh)?
- Is the volume the old queue (738 GW) or the selected pipeline (283 GW)?
- Is the share capacity (73%) or generation (about two-thirds)?
The markers to watch are close. Gate 2 offers run through mid-March 2027, AR8 opens later this year, and Sizewell C’s construction progress will test the RAB model. Judge any UK power exposure on deliverability, not ambition.
This article is for informational purposes only and should not be considered financial advice. Investors should conduct their own research and consult with financial professionals before making investment decisions. Past performance does not guarantee future results. Financial projections are subject to market conditions and various risk factors.