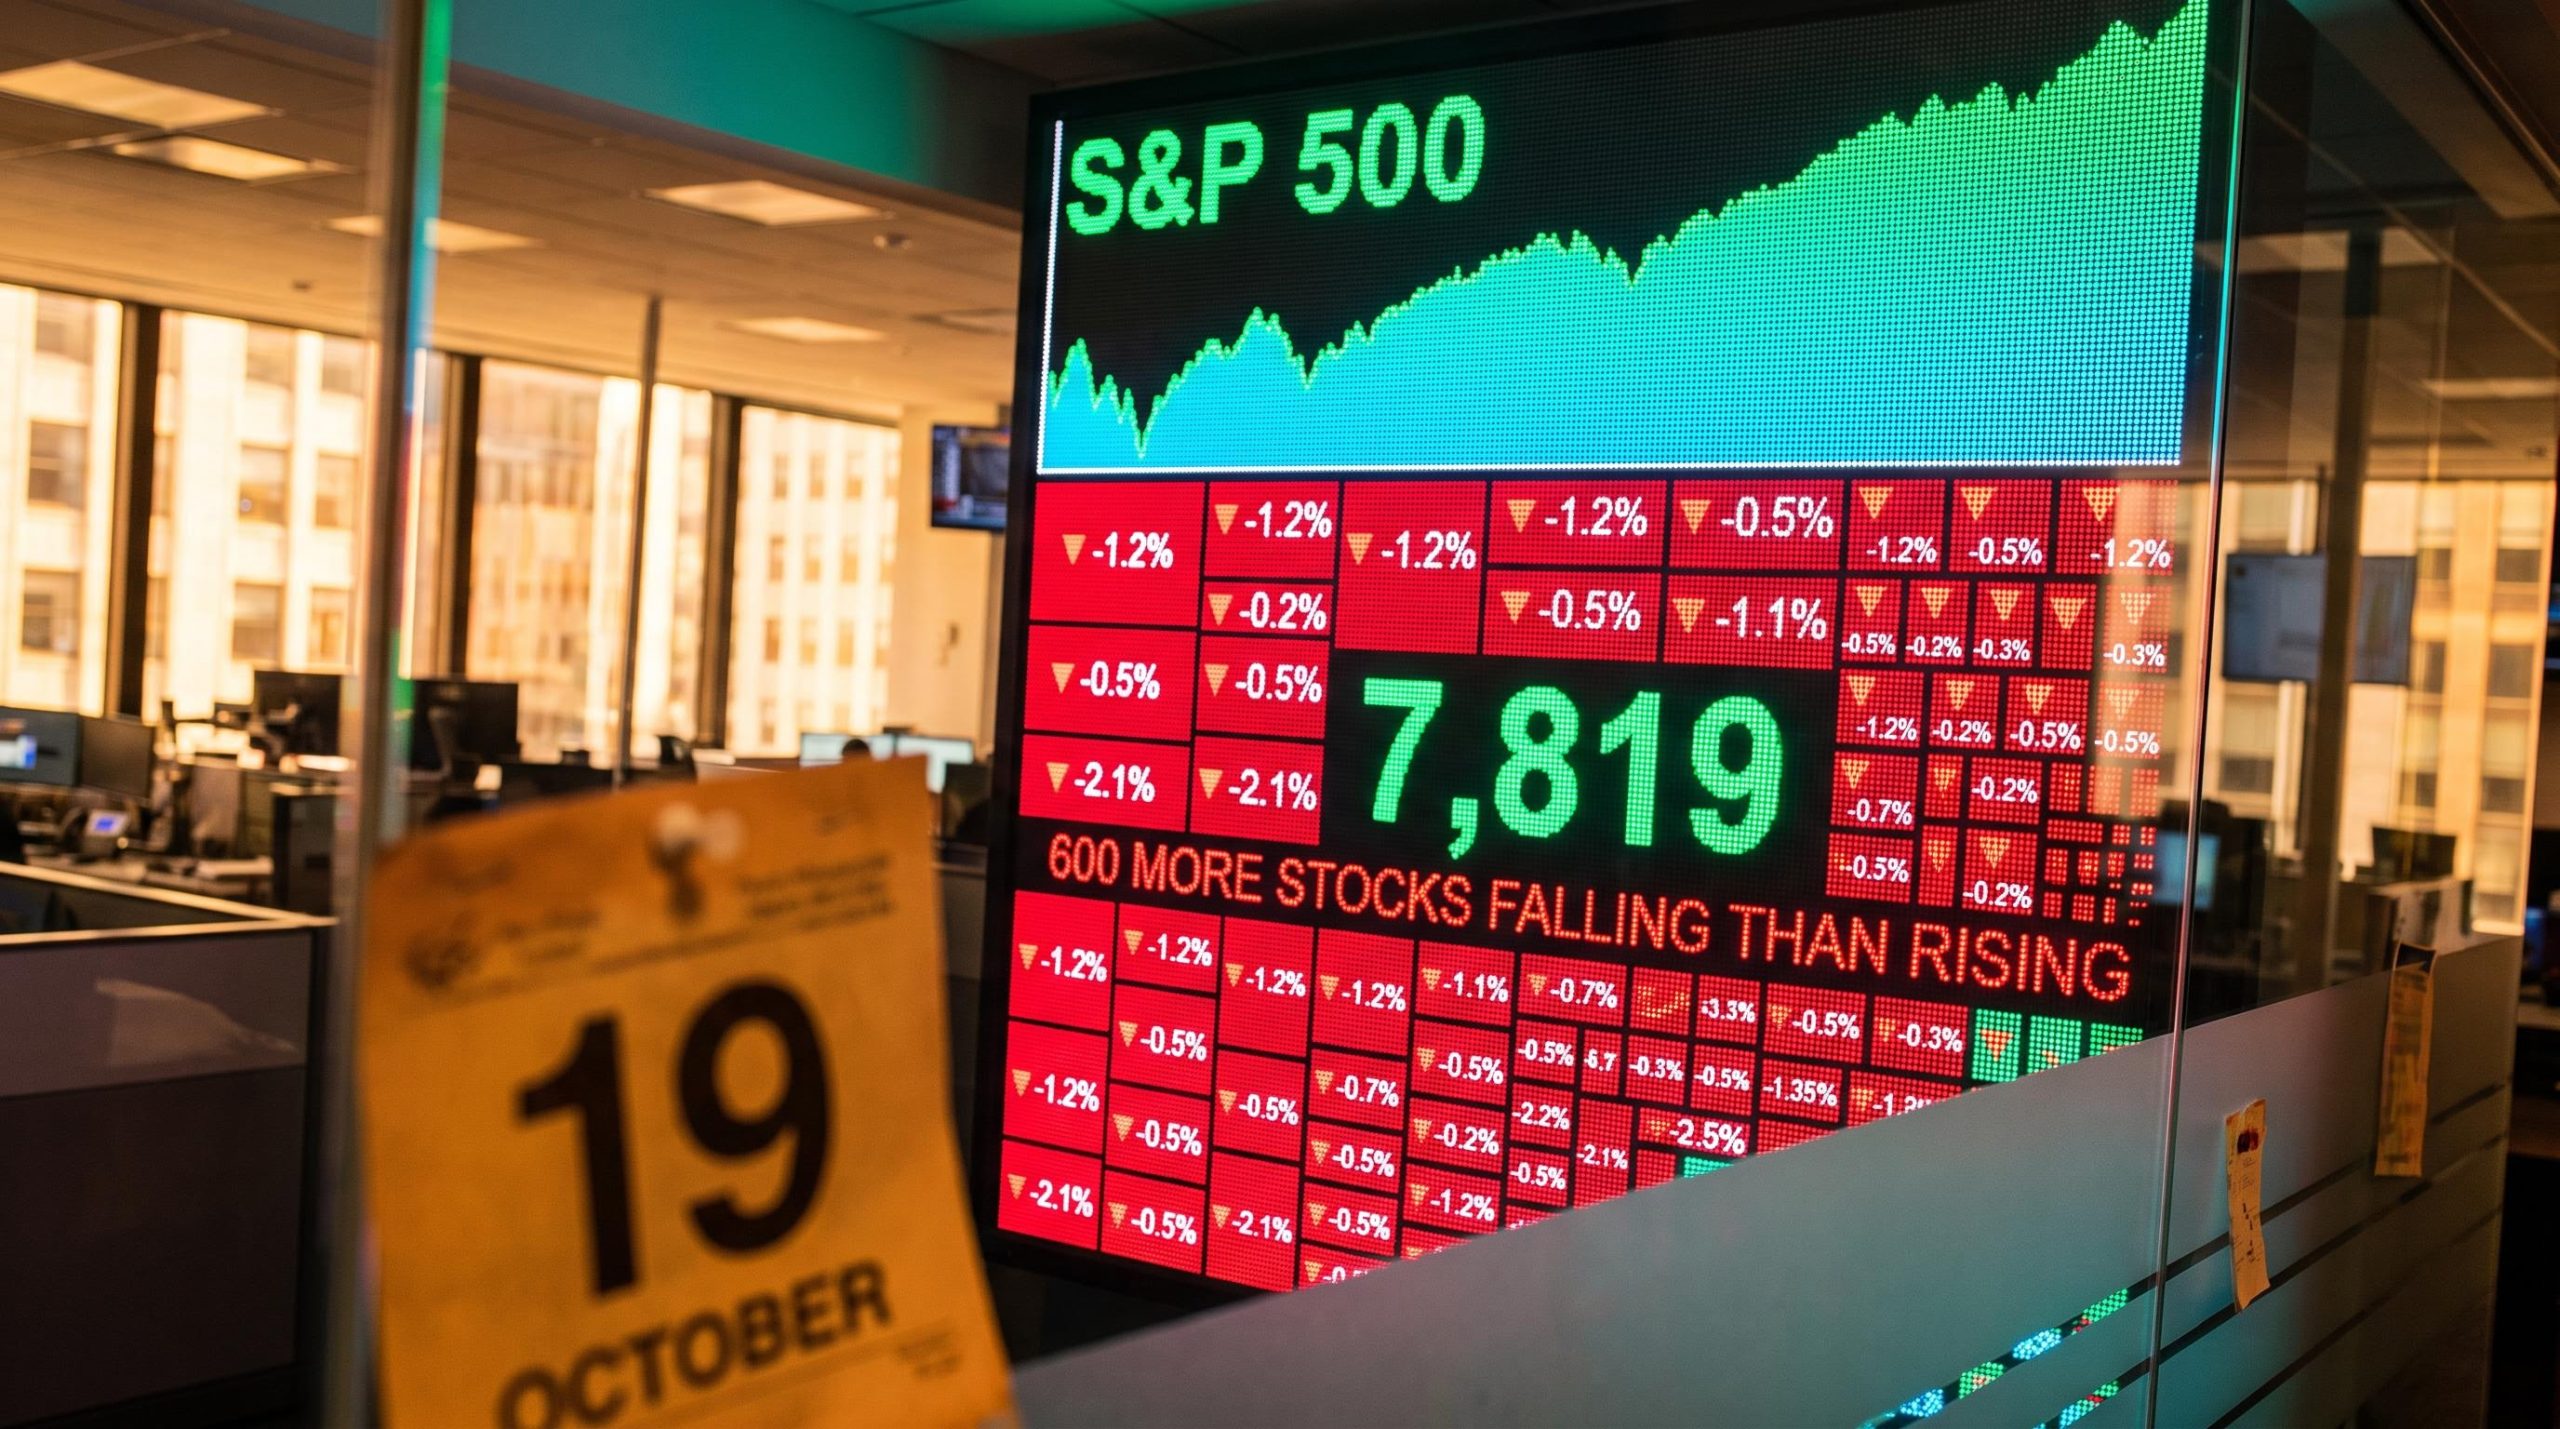
The Australian dollar spent Monday doing almost everything bulls could ask for. A hawkish signal from the Reserve Bank of Australia (RBA) and a better-than-expected China growth print pushed AUD/USD toward 0.6980. Yet the International Monetary Fund (IMF) puts the currency roughly 17% overvalued, which raises an awkward question for any AUD/USD forecast: how much of the good news is already priced in?
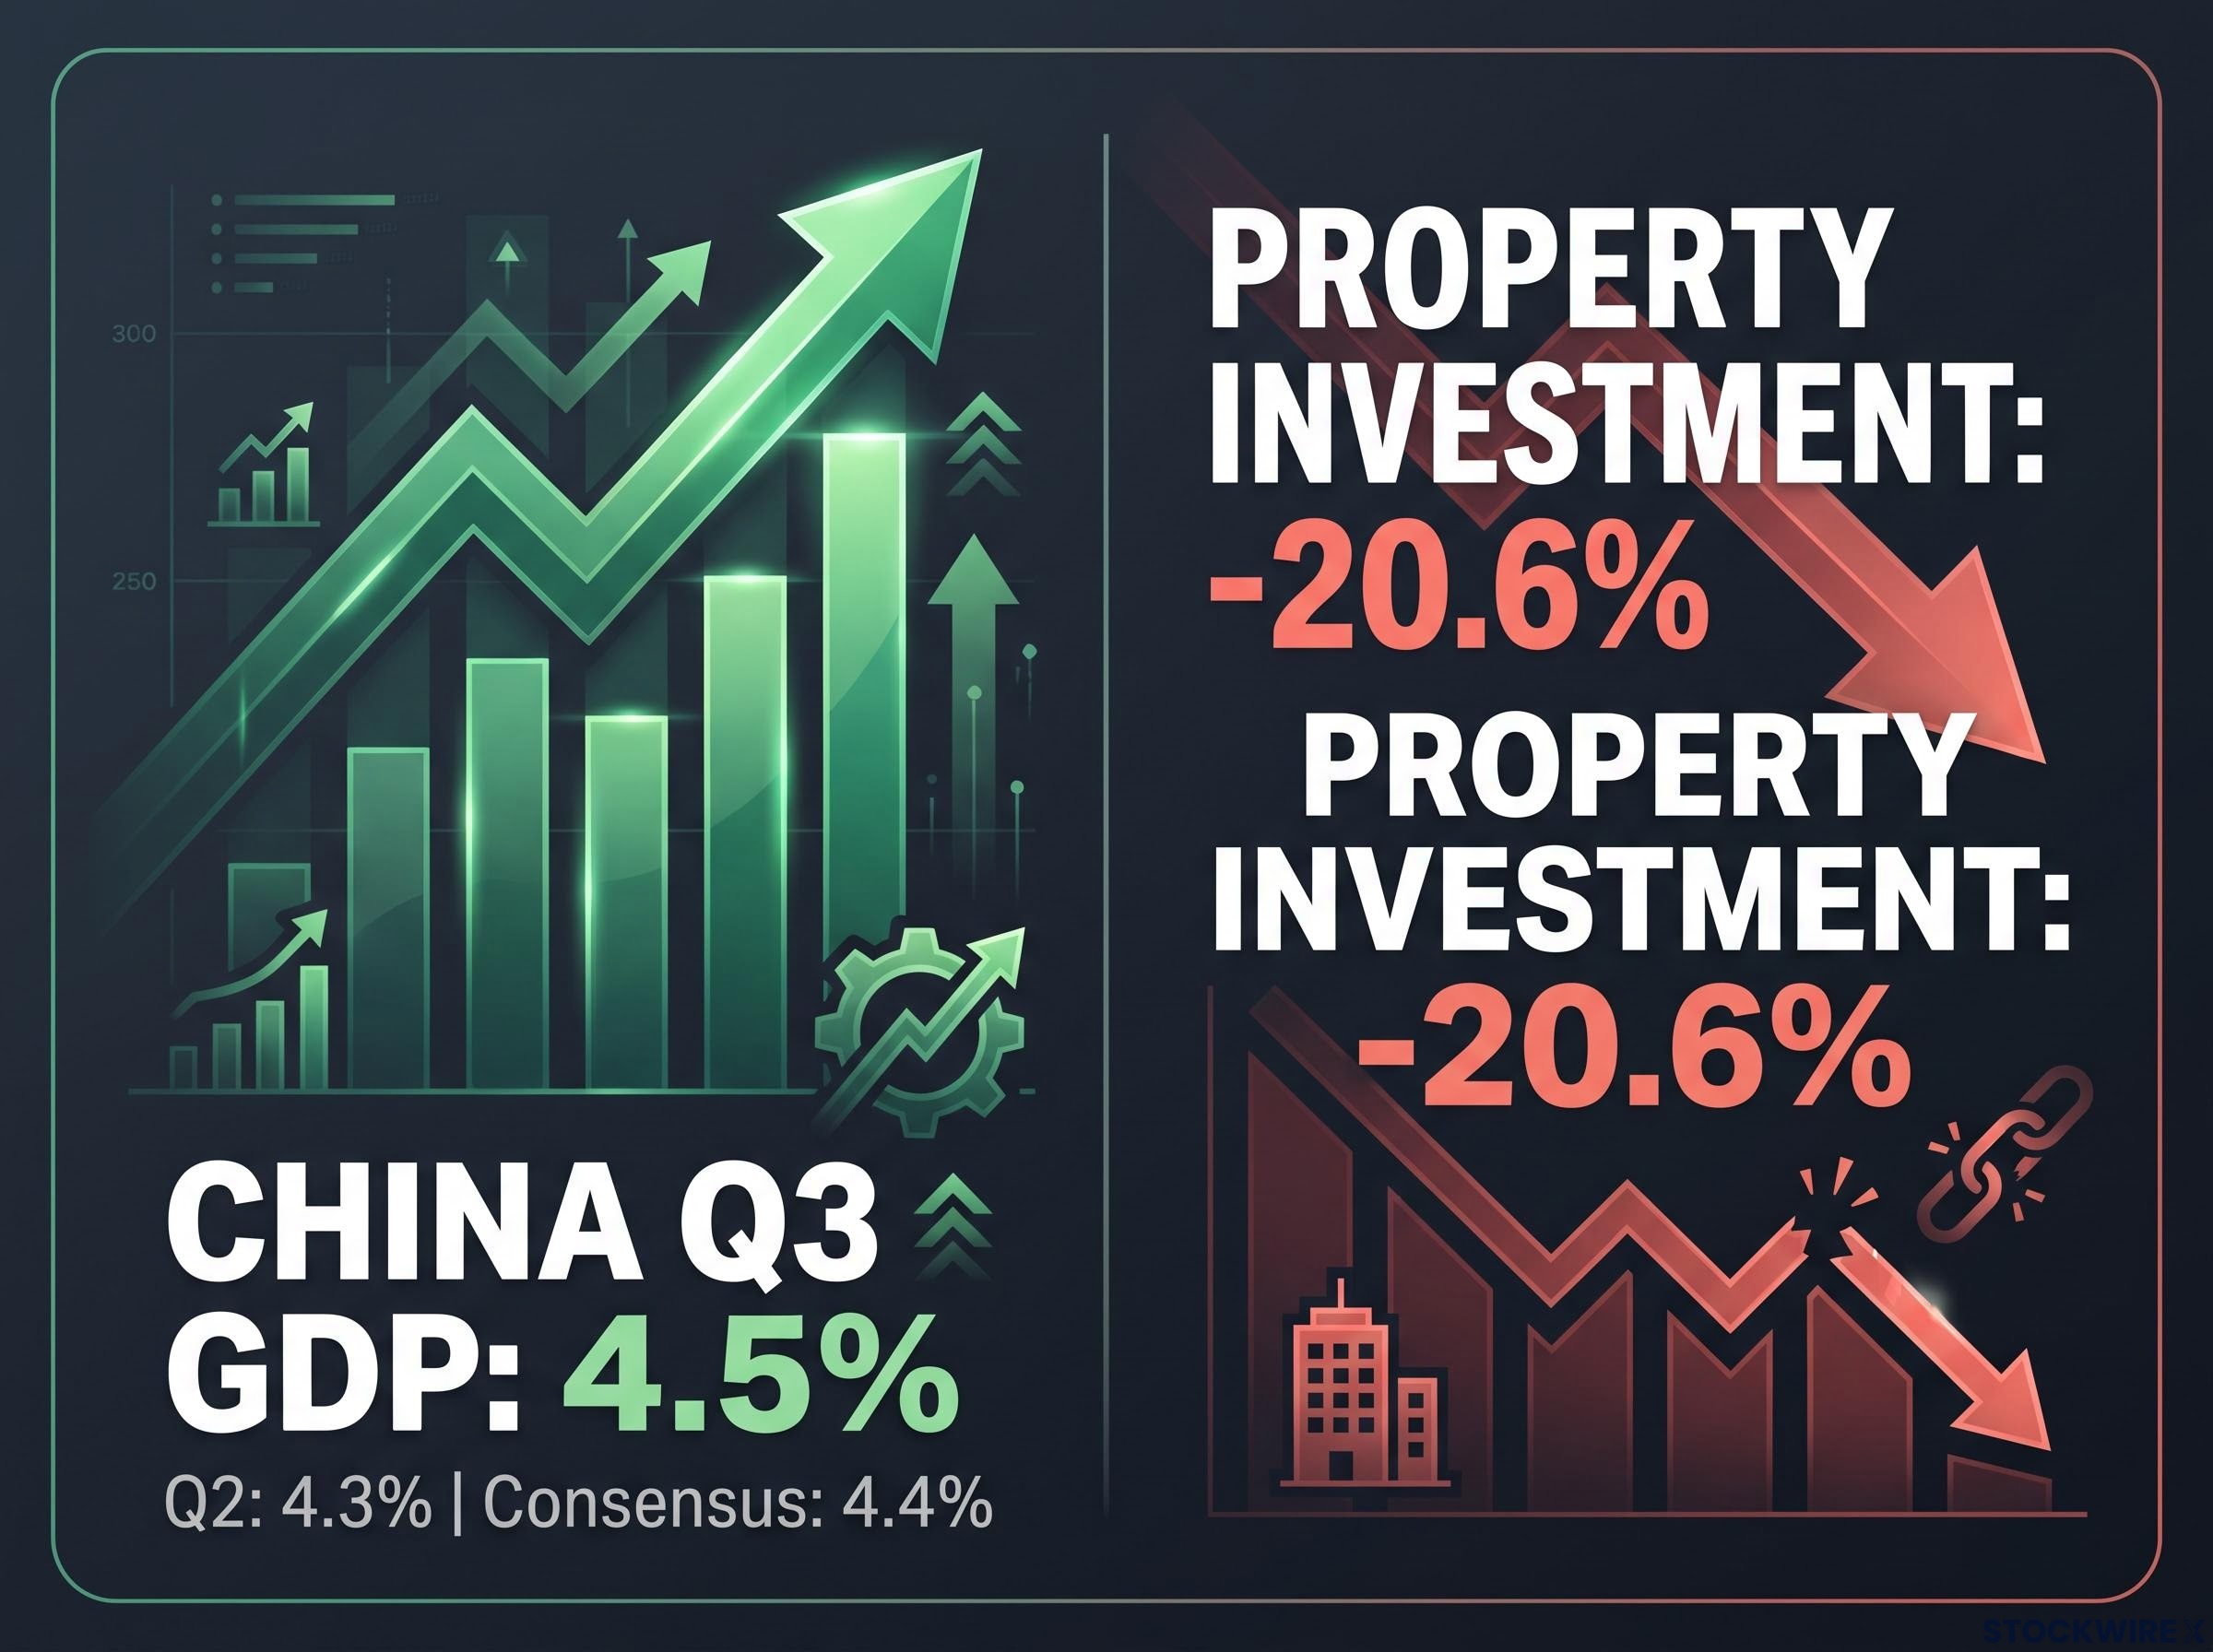
On 19 October 2026, the pair gained about 0.51% after RBA Assistant Governor Christopher Kent said there is “reasonable evidence” that neutral interest rates are rising. Hours earlier, China reported Q3 GDP growth of 4.5% year-on-year, ahead of the 4.4% consensus.
The 0.70 handle has been here before. Last time, stronger US inflation and Fed-hike pricing overwhelmed positive Australian and Chinese headlines and pushed the pair back down.
Here is how to judge whether the Aussie can hold the top of its range. The neutral rate, China, valuation and the chart each tell part of the story, and together they form one picture.
What does a rising neutral rate mean for the Australian dollar?
The neutral rate is the interest rate setting that neither boosts nor restrains the economy. It cannot be observed directly. Economists estimate it, and those estimates move.
That matters because the RBA cash rate target sits at 4.60%, after a unanimous 25 basis point rise at the 28-29 September 2026 meeting. A basis point is one hundredth of a percentage point. On its own, 4.60% sounds high. Whether it actually restrains spending depends on how far it sits above neutral.
CommBank economist Stephen Halmarick reported that the bank’s real-time neutral estimate has climbed to about 3.85%, roughly 0.65 percentage points higher than a year ago. So the same 4.60% cash rate now delivers less restraint than it would have twelve months earlier.
Christopher Kent, RBA Assistant Governor There is “reasonable evidence” that neutral rates are rising in Australia and overseas.
If neutral is higher, the RBA has less room to cut without reviving inflation, and more reason to hold or hike. For a currency, that is supportive. A central bank that stays restrictive for longer tends to keep yields attractive to foreign investors, which keeps demand for the currency firm.
RBA forward guidance can move yields and the currency without any change in the cash rate, which is why a single phrase on neutral rates from a senior official carries so much weight with FX traders.
What this tells you is simple: stop reading 4.60% as obviously “high”. The question currency markets are pricing is the gap above neutral, and that gap is narrower than the headline suggests.
Why neutral rates may be rising
The RBA and CommBank point to several forces, each adding demand for funds or loosening financial conditions:
- Government deficits: persistent borrowing absorbs global savings and lifts the return needed to balance saving and investment.
- AI, data-centre and green-transition investment: heavy capital spending increases demand for investment funds.
- Strong risk appetite: easier financial conditions mean a higher policy rate is needed for the same restraint.
- Capacity pressure: strong demand against supply limits may require a wider gap between rates and inflation.
None of these is certain, and neutral remains an estimate. Still, the direction of the argument favours a central bank that is slow to ease.
When big ASX news breaks, our subscribers know first
How do China’s growth and US rate dynamics pull on a commodity currency?
A hawkish RBA explains only half of Monday’s move. The other half came from Beijing, and the force pushing back came from Washington.
The China channel
China is Australia’s largest trading partner and its key buyer of commodities such as iron ore. When Chinese growth surprises upward, markets expect stronger commodity demand, better Australian terms of trade (the price of exports relative to imports) and more appetite for cyclical currencies like the Aussie.
The Q3 numbers delivered on the headline. Growth reached 4.5% year-on-year, up from 4.3% in Q2, with quarterly growth of 1.2% against 0.9% previously. Year-to-date growth stands at 4.6%.
The detail is less flattering. Property investment fell 20.6%, a weak signal for construction-related iron-ore demand. Westpac called the result a positive surprise but warned that record surpluses, weak domestic demand and excess capacity mean broader stimulus is still needed. Growth led by exports and surpluses gives Australian resources less direct support than a construction boom would.
The rate-differential channel
A rate differential is the gap between interest rates in two countries. Money tends to flow toward the higher yield, so a wider gap usually supports the higher-yielding currency.
The Federal Reserve lifted its target range to 3.75%-4.00% in September and officials have kept a hawkish tone. Australian two-year yields sit near 4.92% against about 4.74% in the US, an edge of roughly +18 basis points. Westpac argues markets are overpricing future Fed hikes and expects only one more, which would tend to limit sustained US dollar strength.
The Fed rate hike in September came without forward guidance, so inflation prints now drive US rate expectations and, through them, the dollar side of AUD/USD.
| Driver | Latest reading | Effect on AUD | Caveat |
|---|---|---|---|
| China Q3 GDP | 4.5% y/y vs 4.4% consensus | Supportive | Property investment down 20.6% |
| RBA cash rate | 4.60% | Supportive | November decision contested |
| Fed target range | 3.75%-4.00% | Restraining | Hike pricing may be stretched |
| Two-year differential | About +18 bp | Mildly supportive | Thin cushion if US yields rise |
The read you should take from this is that China’s beat helps the Aussie only as far as it turns into commodity demand. An 18 basis point yield edge leaves little room for error if US expectations shift.
Expensive but not broken: weighing the 17% overvaluation call
That thin cushion makes the valuation debate more than academic. If the Aussie is genuinely stretched, a small shock could do outsized damage.
IMF estimate The Australian dollar is about 17% overvalued on a real effective exchange-rate basis.
The real effective exchange rate measures a currency against a basket of trading partners, adjusted for inflation. On that yardstick, the IMF sees the Aussie as expensive versus medium-term fundamentals.
Other yardsticks are gentler. Kent described the real trade-weighted dollar as only “marginally above” long-run equilibrium estimates. Brown Brothers Harriman (BBH) strategist Elias Haddad argues AUD/USD is consistent with real and nominal two-year rate differentials, and sees limited near-term downside.
| Source | Reading | What it implies |
|---|---|---|
| IMF | About 17% overvalued | Eventual depreciation unless fundamentals improve |
| RBA (Kent) | “Marginally above” equilibrium | Elevated, no immediate correction required |
| BBH (Haddad) | In line with two-year differentials | Limited near-term downside |
Strategists are similarly split on outcomes. A multi-bank survey puts the median end-2026 target near 0.70, with a range from 0.67 at Citi to 0.75 at Scotiabank. Even the next RBA meeting is contested: CommBank forecasts a November hold with rising hike risk, while ANZ and Westpac are reported to expect a hike.
“Overvalued” depends on the measuring stick. What turns valuation from background noise into a trigger is a shock: weaker risk appetite or falling commodity prices. For you, a large valuation gap informs how much risk to carry, not when a move will arrive.
Reading the chart: where fundamentals meet 0.6900-0.7000
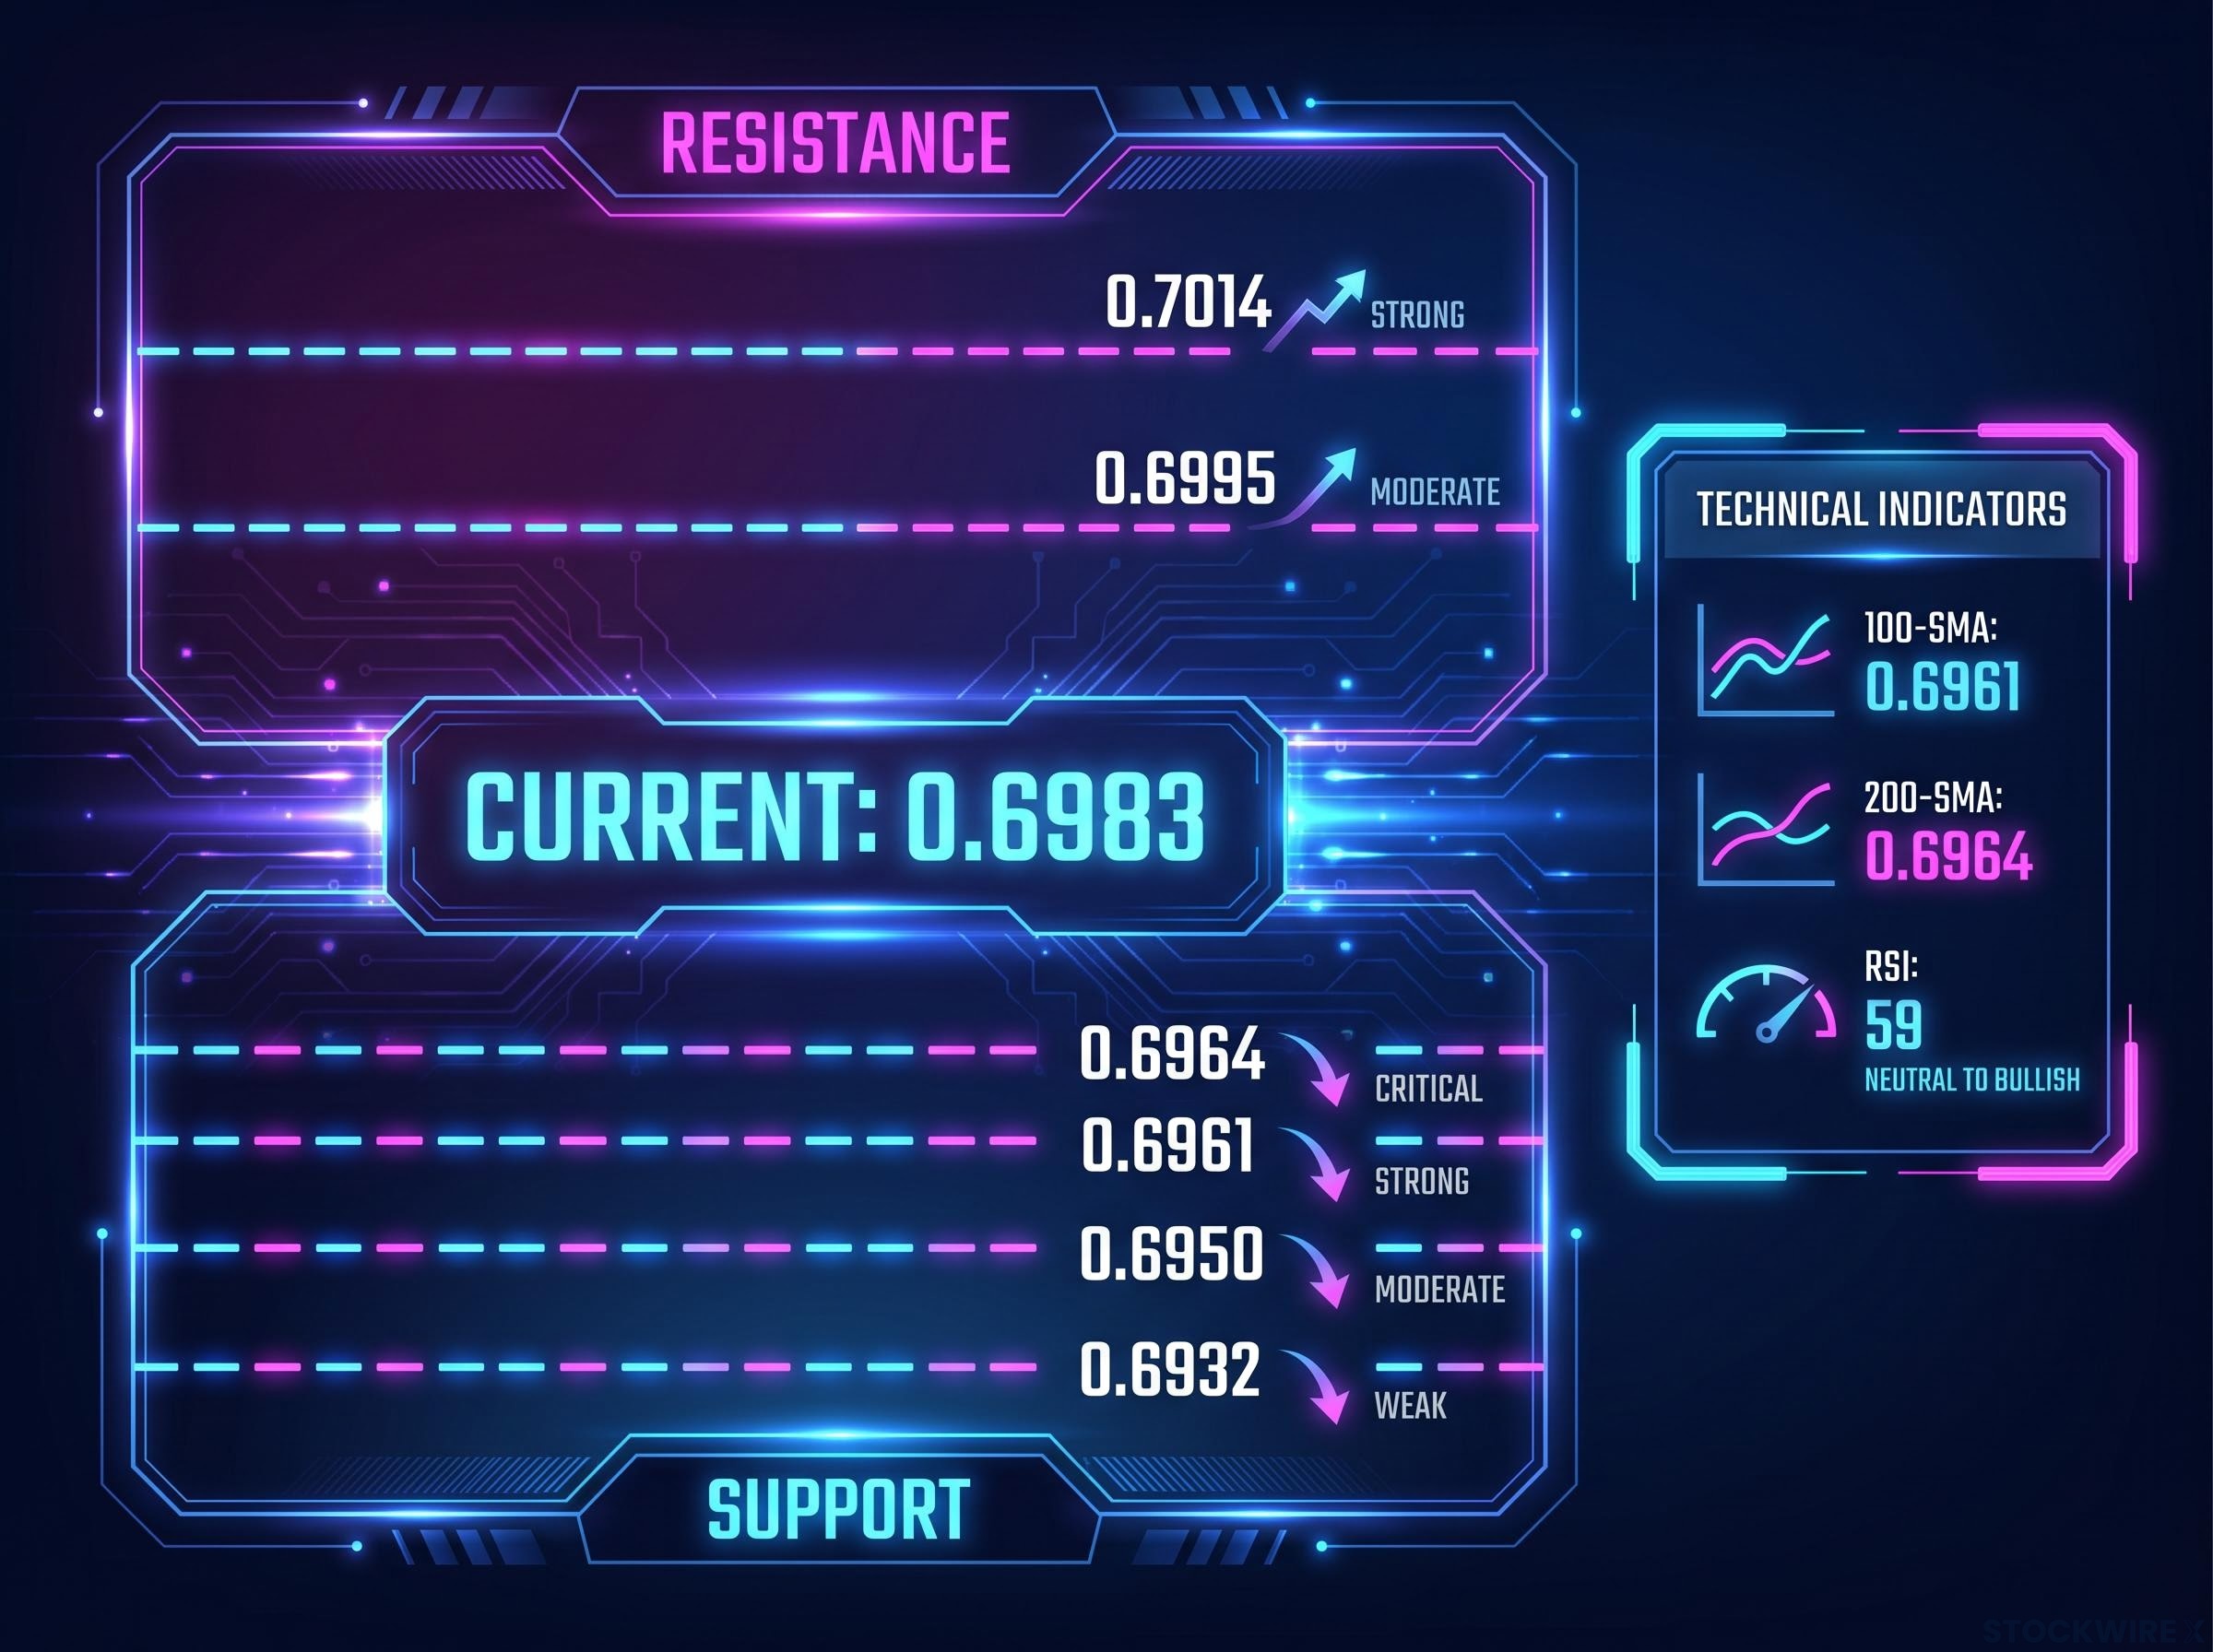
The price chart maps the same debate. On a one-hour basis, the pair traded near 0.6983, pressing the top of a three-week range of roughly 0.6900-0.7000.
A moving average smooths recent prices to show trend. The pair sits above its 100-period simple moving average (0.6961) and 200-period average (0.6964), a short-term bullish sign. The Relative Strength Index (RSI), which measures momentum on a 0-100 scale, reads near 59: firm, but not overbought.
Resistance is a level where selling has tended to appear; support is where buying has.
- Resistance: 0.6995, 0.7014
- Support: 0.6964, 0.6961, 0.6950, 0.6932
The 0.7000 ceiling carries history. The last rejection came after stronger US inflation lifted Fed-hike expectations, overwhelming positive local news.
What would confirm each scenario
- Upside break: a sustained move above 0.7000, targeting 0.7014, would likely need further RBA hawkishness, Chinese follow-through and softer US yields.
- Rejection and drift: repeated failure near 0.7000 opens a path toward 0.6900 via 0.6950 and 0.6932, likely triggered by hot US inflation, Fed-hike repricing or a confirmed RBA pause.
Treat 0.7000 as the point where the fundamental story faces its test. A quick dip toward 0.6950 would fit the existing range rather than signal a change in trend. Other risks remain, including a US dollar reversal, fragile China data and growth damage from rates held higher for longer. These technical signals are short-term and guarantee nothing.
Earlier in the year the pair faced similar breakout conditions, requiring a weekly close above resistance, regional Asian FX strength and a softer US yield reaction before a range break could be trusted.
What the data changes for the Aussie, and what it does not
A rising neutral rate and China’s upside surprise give the Aussie genuine support. A slim yield edge and a contested valuation cap how far that support can carry it.
The evidence points to a pair that is well supported inside its 0.6900-0.7000 range. A decisive break likely depends more on US rate expectations than on anything Australia delivers.
Rising Treasury yields have overridden solid Australian data before, and August’s PMI episode showed how a firmer dollar index can cap the pair even when domestic fundamentals point higher.
The variables worth tracking:
- The RBA’s November decision and its language on neutral rates
- US inflation data and Fed signals
- China property figures and any stimulus announcements
- A daily close above 0.7014 or below 0.6932
This article is for informational purposes only and should not be considered financial advice. Investors should conduct their own research and consult with financial professionals before making investment decisions. Past performance does not guarantee future results. Financial projections are subject to market conditions and various risk factors.