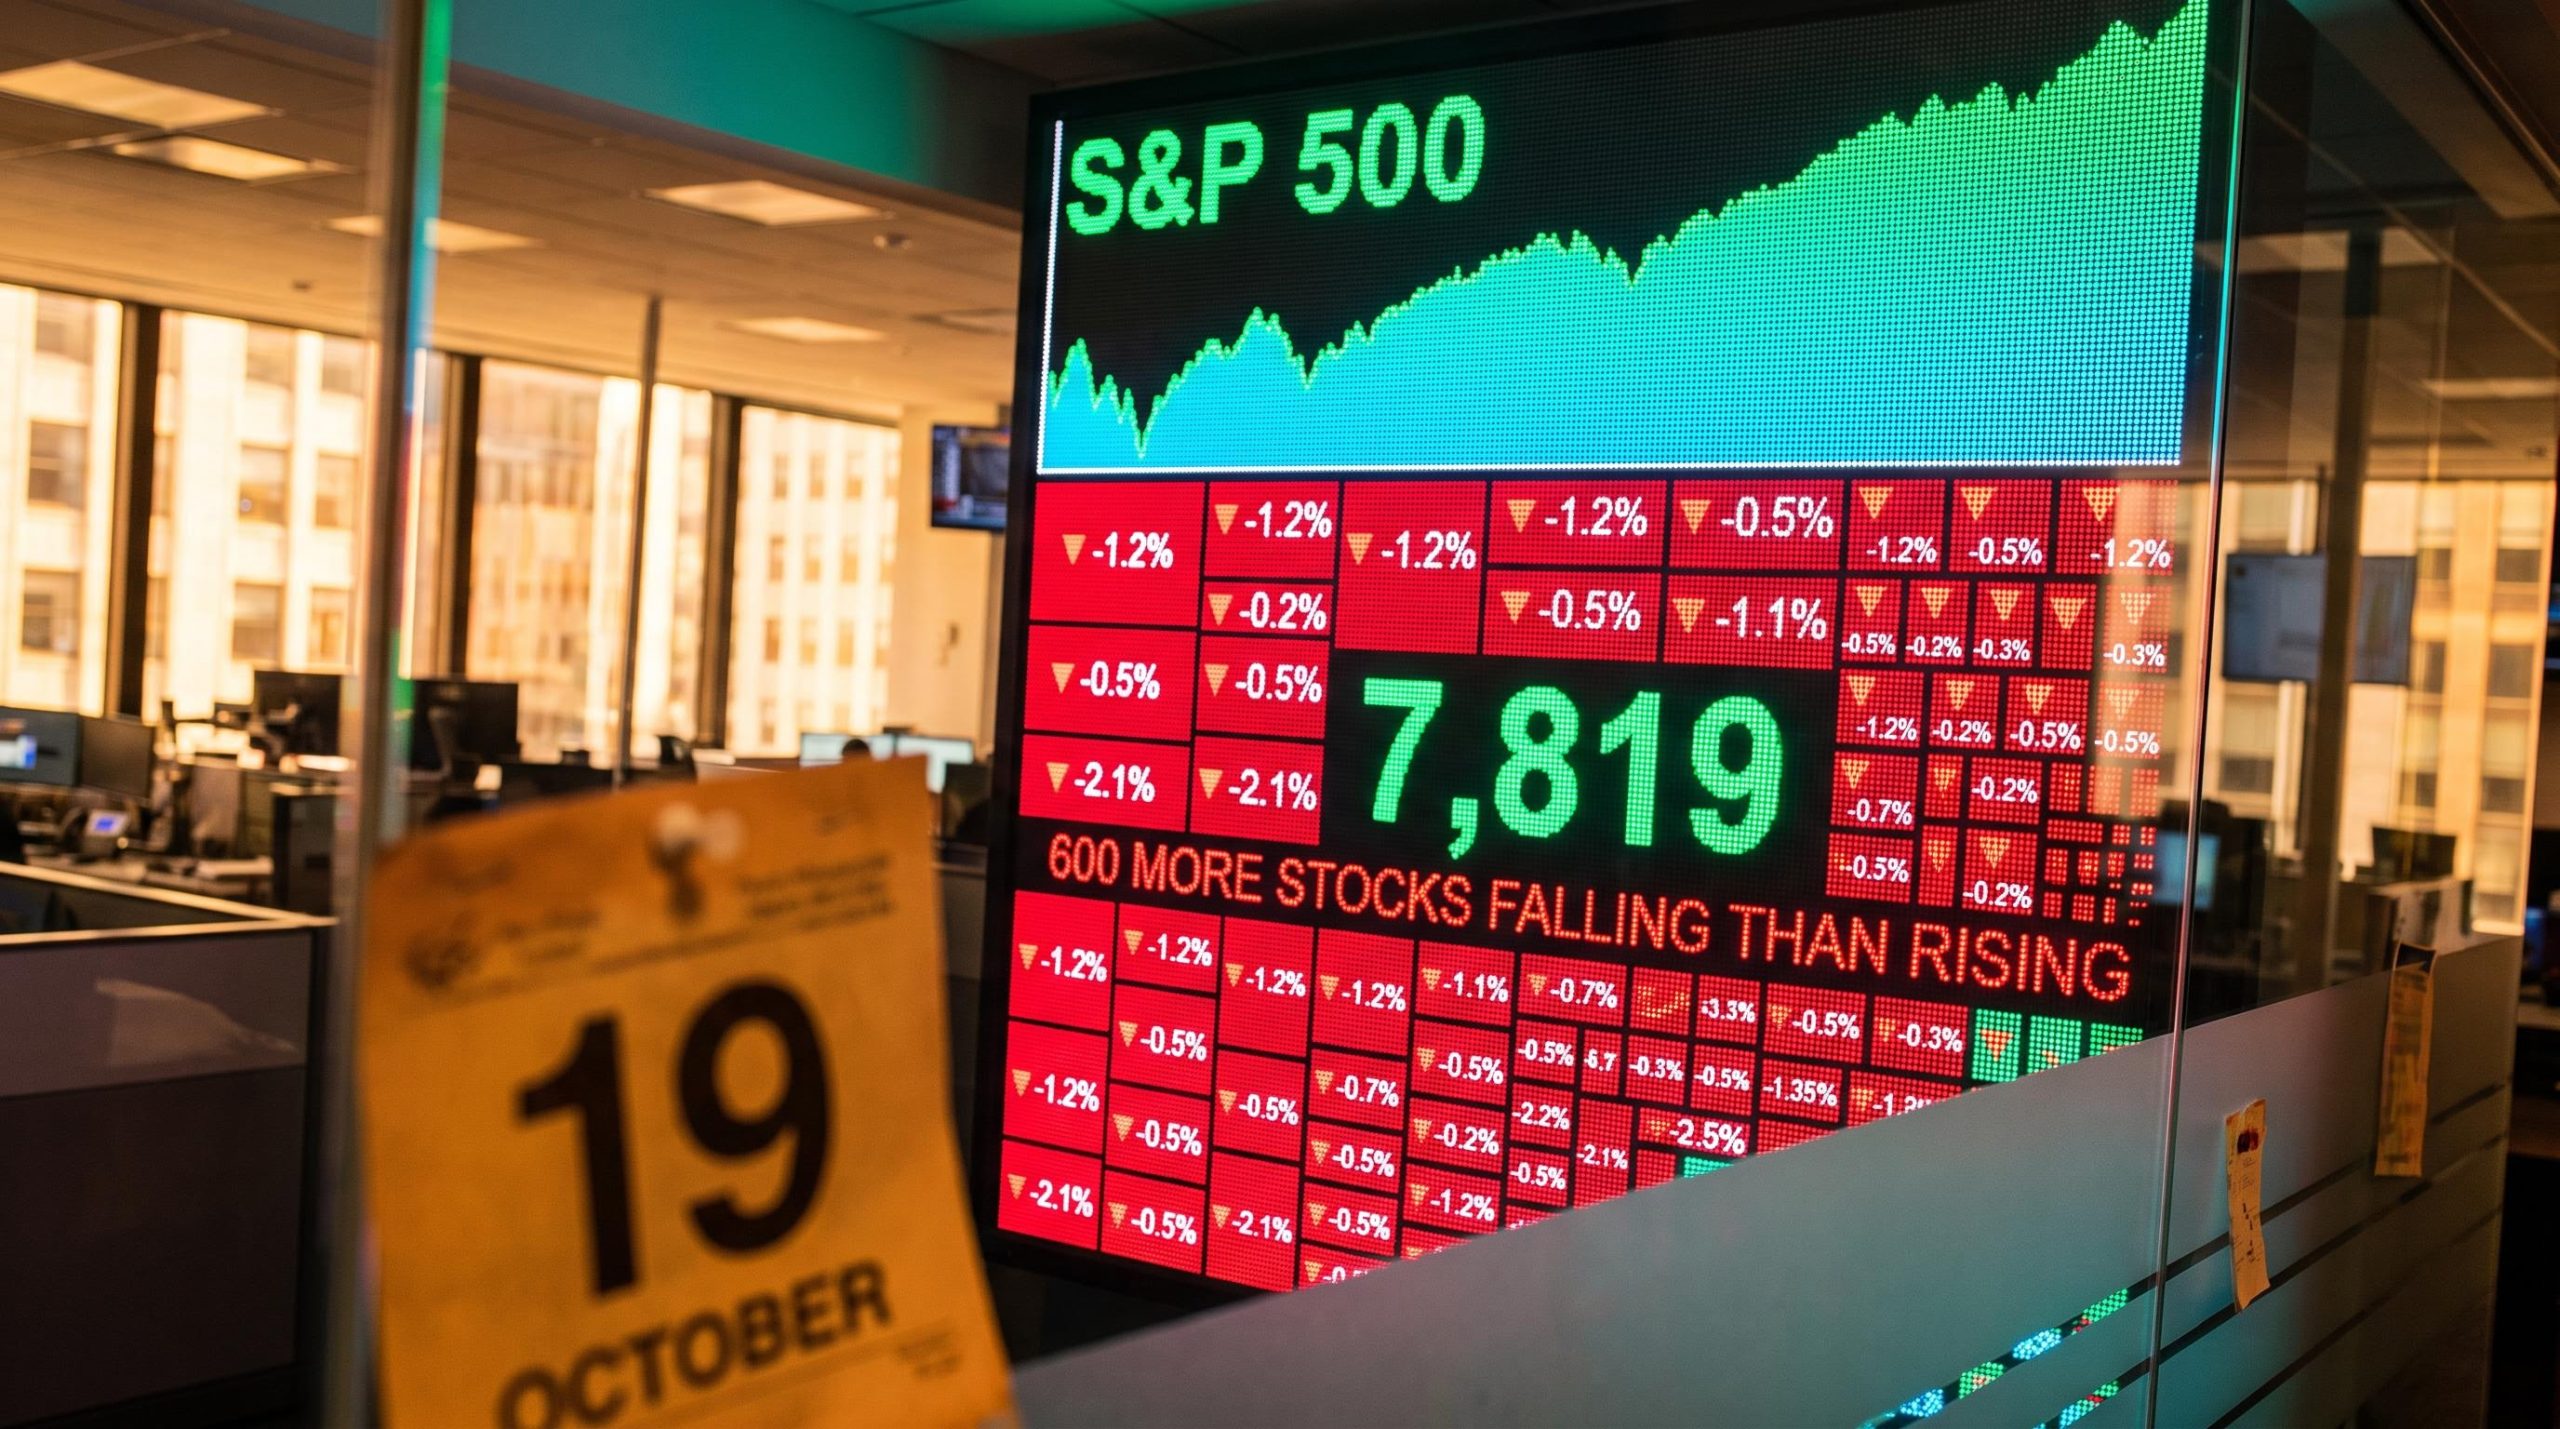
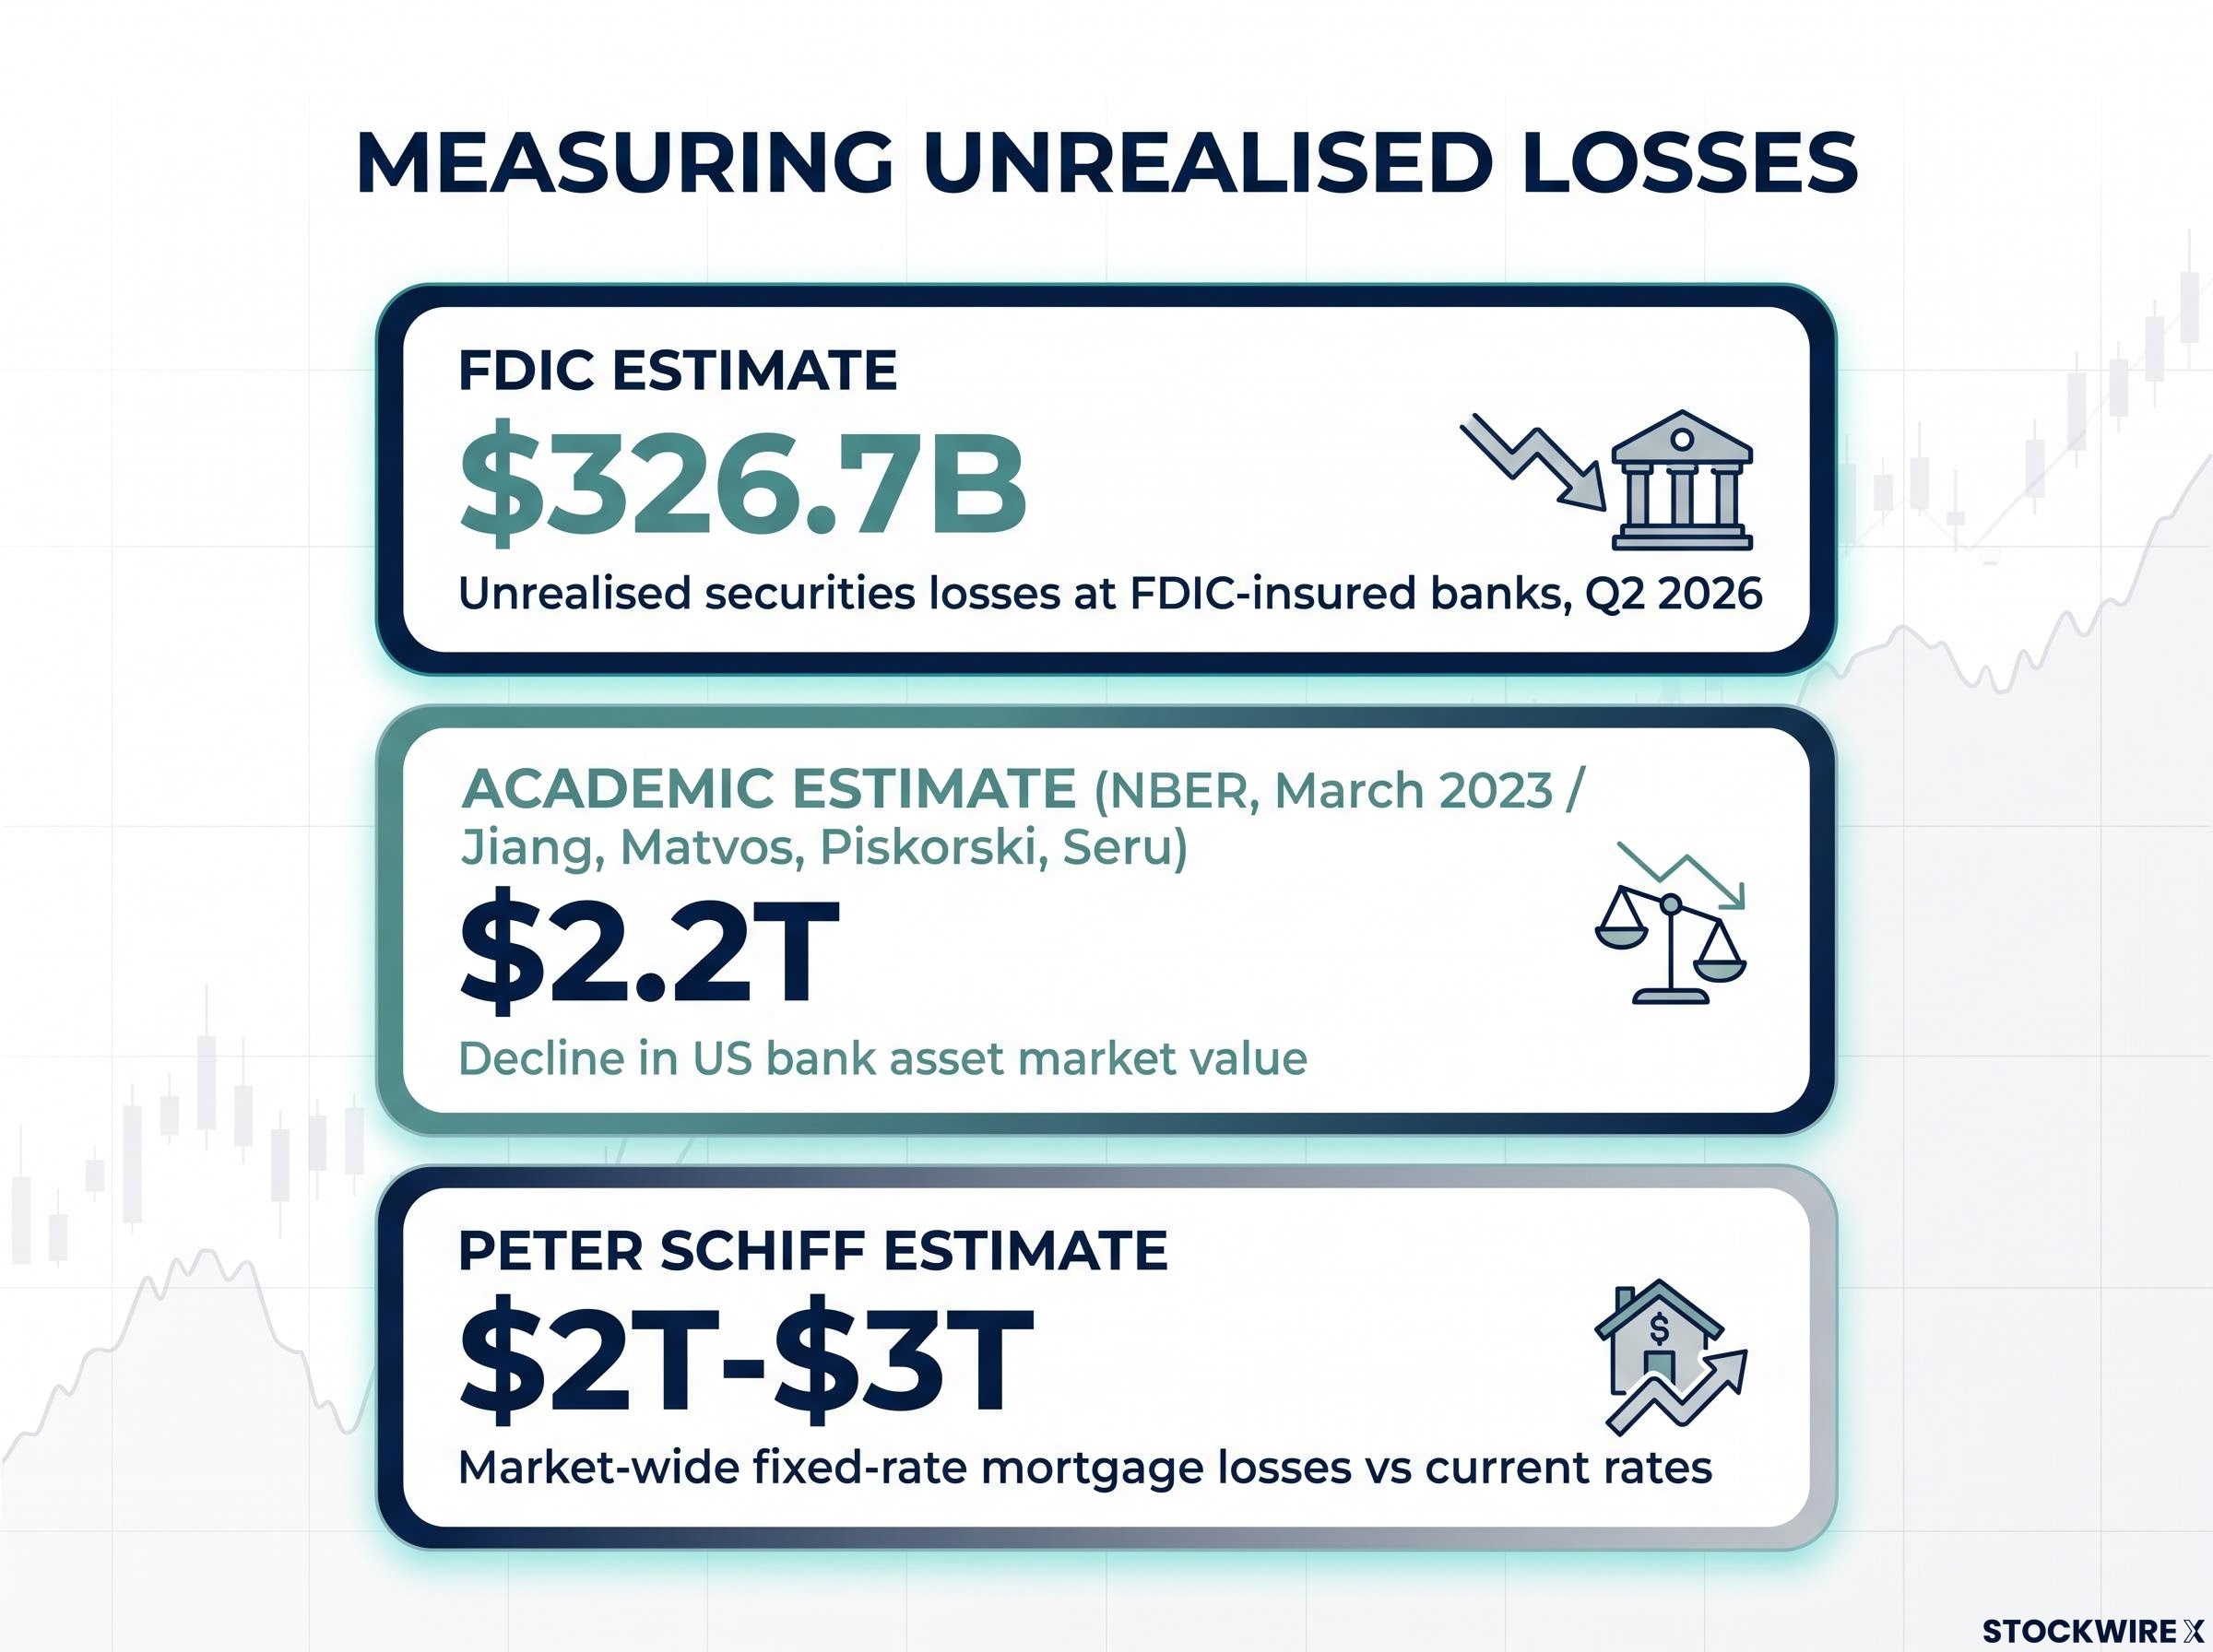
The Federal Deposit Insurance Corporation (FDIC) puts unrealised losses on securities at US insured banks at $326.7 billion for Q2 2026. Peter Schiff, the economist and long-time market bear, says unrealised losses on existing mortgages sit nearer $2 trillion. You have just been handed one alarming number and one more modest one, and nothing in the headlines tells you which describes the real risk to bank balance sheets.
The question matters right now. Freddie Mac put the 30-year fixed mortgage rate at 7.40% on 15 October 2026, and the failures of Silicon Valley Bank (SVB) and Signature Bank in 2023 still shape how depositors react to stress.
Whether banks are more fragile than they were in 2008 is a live debate again. Panic could push you into poor decisions about your deposits or bank shares. Dismissing the issue could leave you blind to a real weakness.
After this, you will be able to tell a paper loss from a realised one and spot the conditions that make it dangerous. You will also be able to weigh Schiff’s argument against the mainstream reading on its merits.
Why do rising rates create unrealised bank losses in the first place?
Start with a single bond. Say a bank bought a 10-year Treasury when new bonds paid low interest. Rates then climbed, so new bonds now pay far more, and no buyer will pay full price for the old, lower-paying one.
How a bond loses value when rates rise
The longer the bond has left to run, the bigger the price drop. That sensitivity is called duration, which measures how much a bond’s price changes when interest rates move. Long-dated fixed-rate Treasuries, mortgages and mortgage-backed securities (MBS), which are bonds made from bundles of home loans, carry high duration.
Your exposure to rate moves comes down to bond duration: each year of duration costs roughly 1% in price for every 1 percentage-point rise in rates, which is why long-dated Treasuries and mortgages carry the biggest paper losses.
The sequence runs like this:
- Interest rates rise.
- Prices of existing fixed-rate bonds fall.
- The bank keeps holding the bonds.
- The loss stays unrealised, meaning it exists on paper only.
- A forced sale turns it into a realised loss.
AFS versus HTM: where the loss lives
Banks sort securities into two buckets, and the bucket decides whether you ever see the loss in their capital.
| Category | Accounting treatment | Effect on capital | Q2 2026 loss |
|---|---|---|---|
| Available-for-sale (AFS) | Carried at fair (market) value | Losses generally flow through and can affect capital | $109.8B |
| Held-to-maturity (HTM) | Carried at amortised cost (purchase price adjusted over time) | Losses generally do not reduce capital unless sold or impaired | $216.9B |
HTM losses equalled about 10.5% of those securities’ amortised cost, up slightly on a $325.1 billion total in Q1 2026. The New York Fed has pointed out that HTM losses can still limit a bank’s ability to sell or pledge securities when it needs cash. No separate MBS-only figure is available; the totals cover all non-equity securities.
The lesson for you is simple. “Unrealised” describes accounting treatment, not safety, and a bank’s reported figures may understate what its assets would fetch today.
When big ASX news breaks, our subscribers know first
What is Peter Schiff actually claiming, and how does it compare with 2007-2010?
That gap between book value and market value is the foundation of Schiff’s case. Taken on its own terms, his argument has a clear internal logic.
The claim
In figures he reportedly posted on X, Schiff argues banks are more fragile than in 2008. His key estimates:
- About $2 trillion in current unrealised losses on existing mortgages
- About $8 trillion of fixed-rate mortgages with roughly 25 years left, averaging 4.6% against about 7.5% today
- About $3 trillion in losses if mortgage rates reach 8.5%
- Banks bailed out in 2008 are bigger now and, in his view, in worse shape
He adds that these losses arise without any defaults, and that defaults would only deepen them.
The 2007-2010 comparison
Schiff’s sharpest point is an asymmetry. In the last crisis, rates fell, which pushed up the value of performing mortgages and handed banks large mark-to-market gains (increases in value based on current prices).
Schiff’s contrast Defaulted-mortgage losses in 2007-2010 came to about $450 billion, offset by over $1 trillion in unrealised gains on non-defaulted mortgages. Today, he estimates about $2 trillion in unrealised losses with no such cushion.
These are Schiff’s own estimates, and the research does not independently verify them. Even so, his core insight holds: rates move asset values in both directions. The open question for you is how much of that value actually sits on bank balance sheets.
Why do the $326.7 billion and $2 trillion figures differ so much?
Set the numbers side by side and they look irreconcilable. One is roughly six times the other. The tension eases once you see that they measure different things.
| Measure | Figure | What it covers | Who holds it | Source |
|---|---|---|---|---|
| Unrealised securities losses | $326.7B | AFS and HTM securities, Q2 2026 | FDIC-insured banks | FDIC |
| Market-wide mortgage losses | $2T-$3T | Fixed-rate mortgage value versus current rates | All holders | Peter Schiff |
| Decline in bank asset market value | $2.2T | Bank assets marked to market prices | US banks | Jiang, Matvos, Piskorski and Seru (NBER, March 2023) |
The academic estimate gives Schiff’s concern real weight. Erica Jiang, Gregor Matvos, Tomasz Piskorski and Amit Seru found the median bank’s unrealised loss was about 9%, the worst 5% of banks lost about 20%, and aggregate losses equalled about 96% of system capital before the tightening cycle.
The NBER working paper behind the $2.2 trillion estimate shows why your bank’s asset values can differ sharply from its books: it marks assets to market prices and finds losses comparable to the system’s total book equity.
Mainstream analysis still parts ways with Schiff on several points:
- Much of the mortgage stock sits with government-sponsored enterprises (GSEs) such as Fannie Mae, securitisation vehicles, insurers and pension funds, not insured banks.
- Many originators and servicers hedge duration with derivatives, so par balance against current rates is not any one institution’s net loss.
- A market-value loss is not a default loss; a performing mortgage held to maturity still pays in full.
- The $450 billion and $2 trillion figures are not like-for-like, because one reflects defaults and the other reflects rate moves.
The consensus view is that Schiff has identified a real duration problem, but not a direct measure of imminent bank losses. When you see any large loss number, ask who holds the assets and whether they must sell.
What did SVB and Signature show about when paper losses turn real?
Whether a bank must sell is exactly what the 2023 failures tested. In both cases, losses alone did not decide the outcome; funding did.
The researchers above describe the run as a chain:
- Rising rates cut the value of long-duration assets.
- Depositors realise the bank may not recover book value in a sale.
- Uninsured depositors (those above the $250,000 insurance limit) withdraw.
- The bank sells or pledges securities, realising losses.
- Solvency weakens.
- More withdrawals follow.
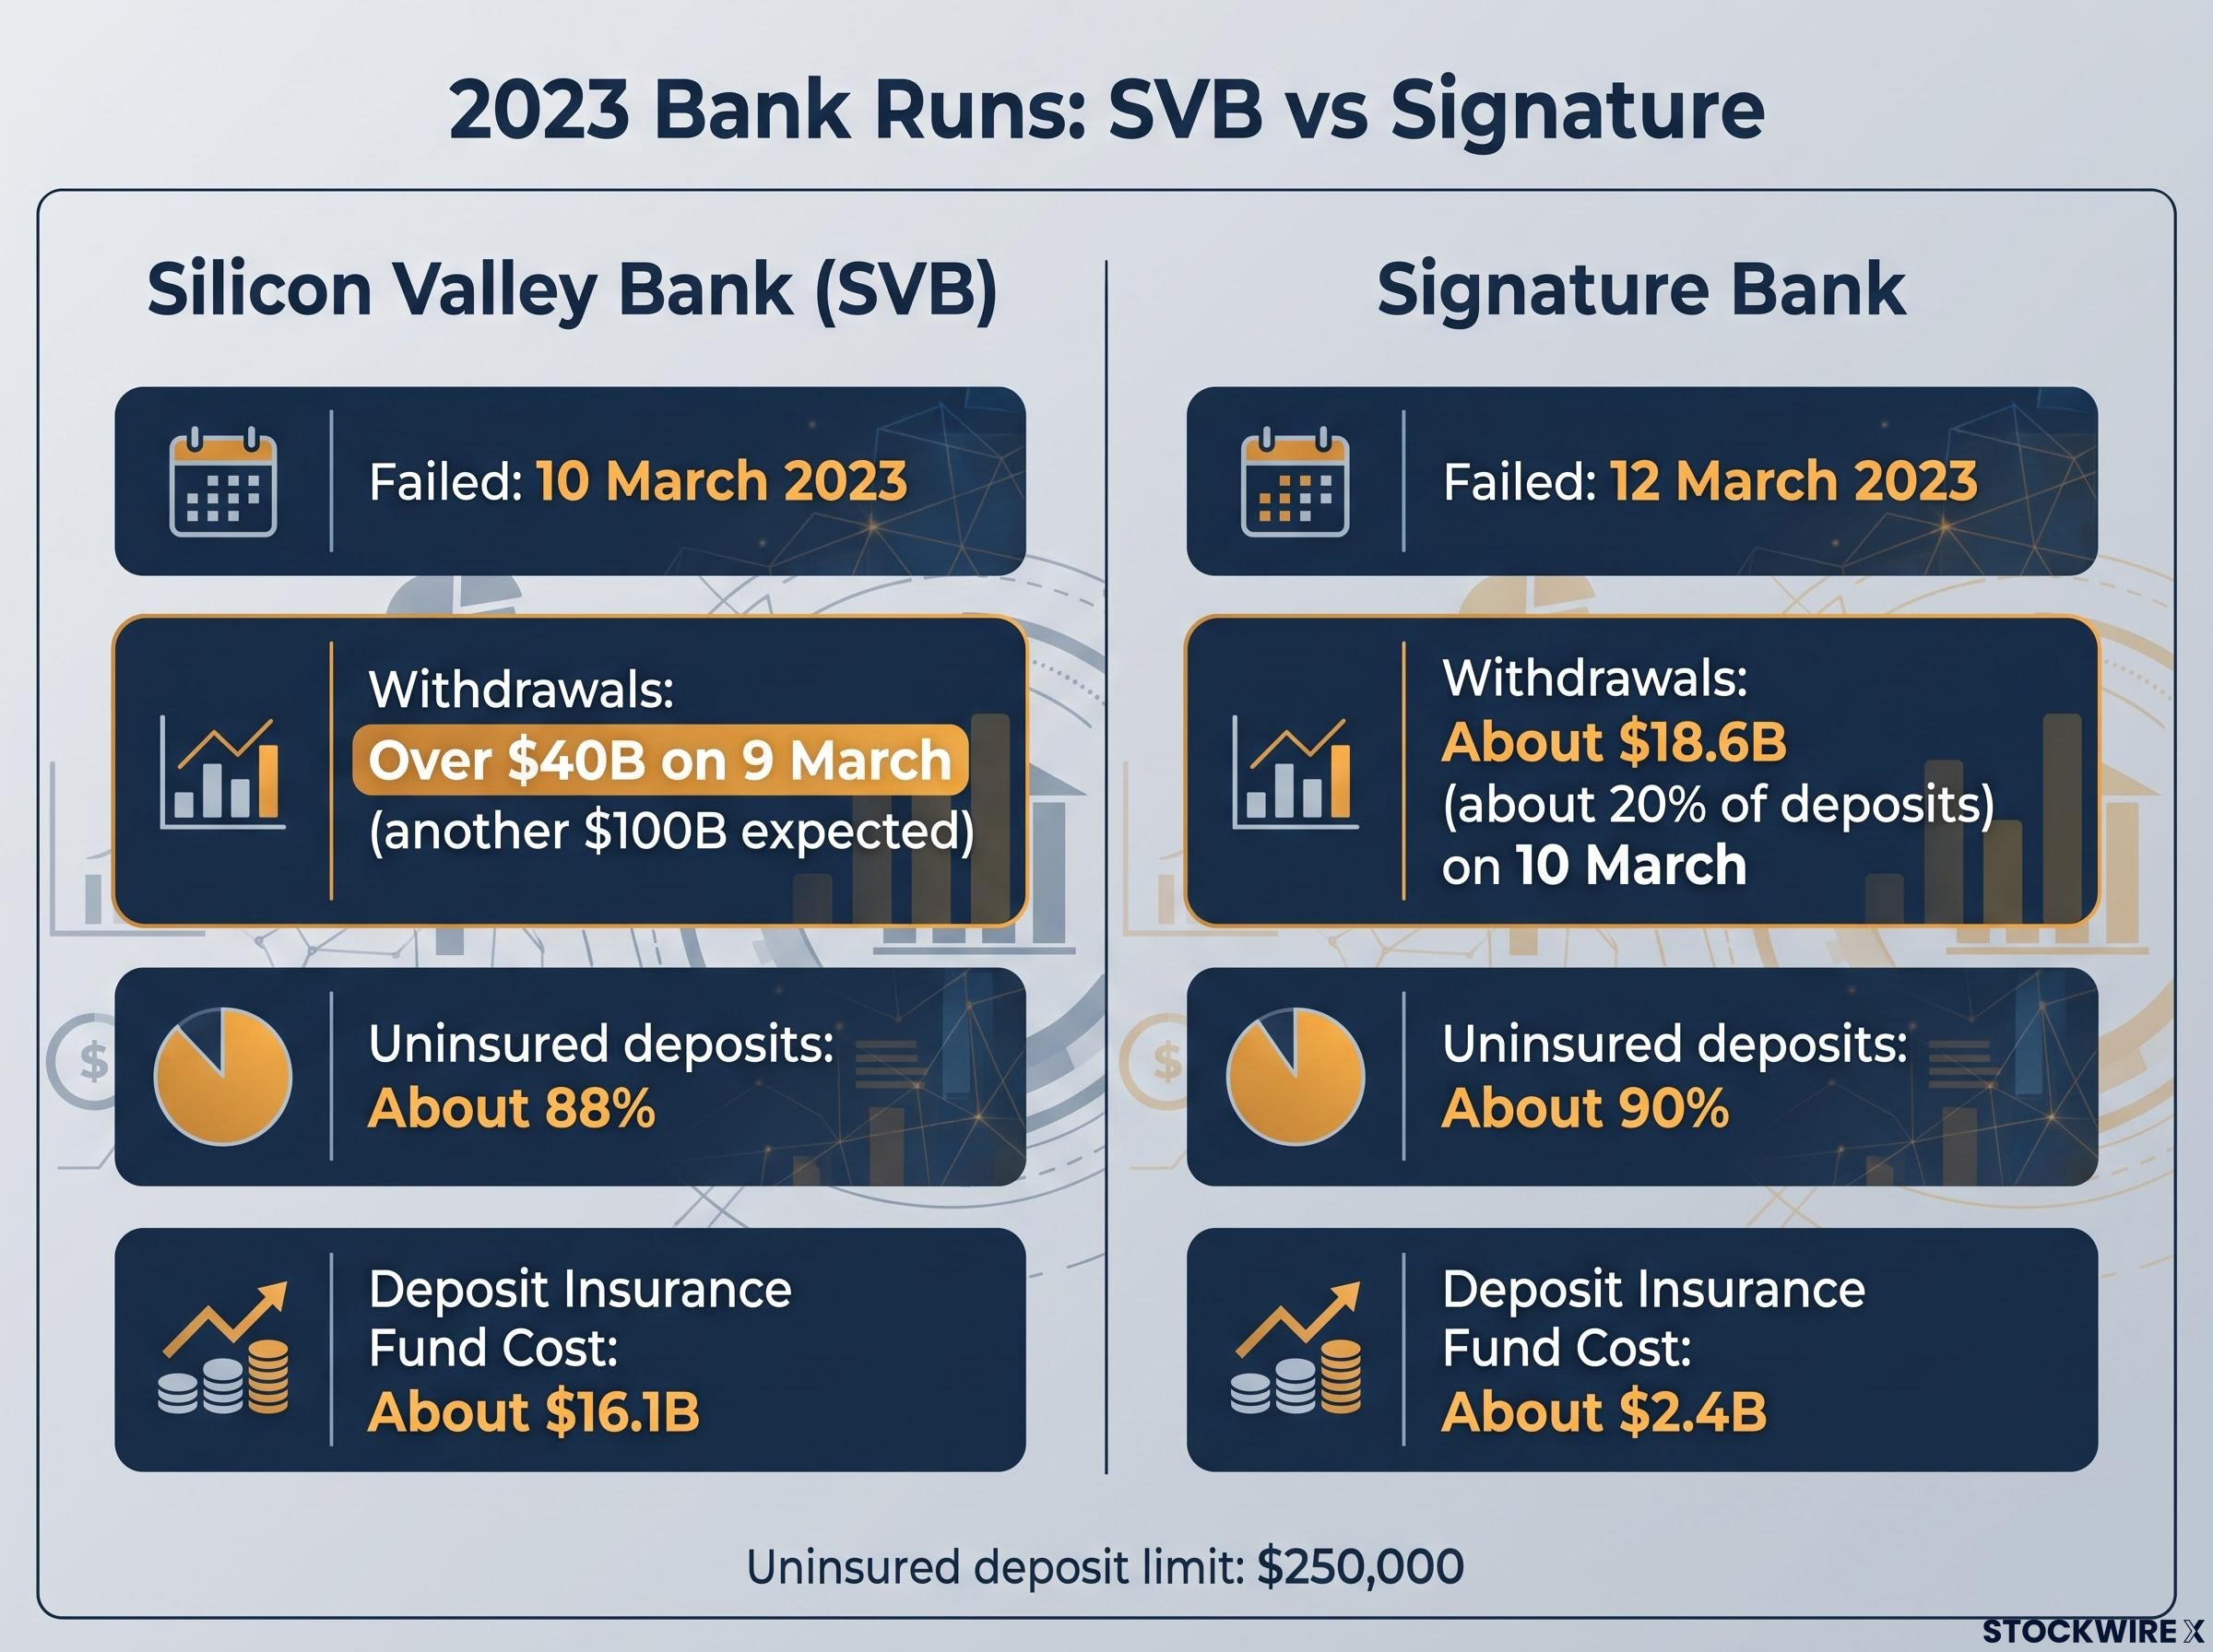
| Factor | SVB | Signature | Shared lesson |
|---|---|---|---|
| Failure date | 10 March 2023 | 12 March 2023 | Runs moved within days |
| Withdrawals | Over $40B on 9 March, another $100B expected | About $18.6B (about 20% of deposits) on 10 March | Speed overwhelmed liquidity |
| Uninsured deposits | About 88% | About 90% | Concentrated funding was flighty |
| Estimated cost to Deposit Insurance Fund | About $16.1B | About $2.4B | Costs spread across the system |
The Federal Reserve’s 2023 Financial Stability Report cited poor interest-rate and liquidity risk management, concentrated uninsured deposits and the speed of withdrawals. Fed research found banks with larger securities losses and more uninsured deposits saw bigger outflows, although borrowing under the Bank Term Funding Program (BTFP) helped replace them.
Your picture of the 2023 failures is incomplete without stress test design: the Fed’s standard scenario assumed falling yields, so the rising-rate losses that hurt SVB sat outside what regulators were measuring.
That is why both camps cite 2023. Schiff is right that failing banks are forced to realise losses, but the official record weights funding structure heavily. For you, the warning sign is the combination, so check a bank’s deposit base as closely as its securities book.
Is the Fed really trapped between inflation and bank stability?
If funding is the trigger, the Federal Reserve’s response becomes the next question. Schiff argues that rate hikes damage banks, and bank failures would force the Fed to cut rates even as inflation worsens.
The Fed tradeoff
Schiff also says the 1.3% September producer price gain equals about 17% annualised wholesale inflation. That is his own calculation and has not been independently assessed. The Fed’s target range currently sits at 3.75%-4.00% (set 16 September 2026), well below the 7.40% mortgage rate.
The Fed’s toolkit, and its limits:
- Discount window: a standing source of loans, though banks need collateral and must be operationally ready.
- Emergency lending authority: can contain liquidity stress in a crisis.
- Deposit-guarantee powers: the 2023 systemic-risk determination protected all depositors at SVB and Signature, which may ease run incentives but raises cost and moral-hazard concerns.
- BTFP: lent against securities at par rather than market value, but expired in March 2024.
- The limit: these tools ease liquidity problems, not solvency losses or inflation.
The mainstream read The system is vulnerable in specific institutions and funding structures, but the evidence does not establish a systemwide insolvency event on the scale of 2008.
The housing link
Higher mortgage rates lock in owners with cheap loans, so fewer homes change hands. Yet fixed-rate borrowers face no automatic payment rise, unlike the adjustable-rate boom before 2008.
The Fed faces a genuine tradeoff, so watch rate decisions for signs of bank stress. “Trapped”, though, overstates the case.
Weighing the fragility claim: what to watch beyond the headline numbers
The unrealised loss overhang is real. Still, 2008 was a collapse in credit quality, while today’s risk is concentrated in duration, liquidity and depositor confidence. The savings-and-loan crisis offers a caution: delaying loss recognition did not erase the losses, and accounting comfort is not the same as economic health.
To judge the risk yourself, monitor:
- Uninsured deposit shares at the banks you use or own
- Tangible capital levels
- The FDIC’s quarterly unrealised loss figure
- The 30-year mortgage rate
- Fed policy signals and emergency lending activity
Uninsured deposit shares matter more today because roughly 43% of domestic deposits sit above the insurance limit, and tools such as stablecoins and money market funds make moving that money far easier than in 2023.
Treat Schiff as one informed viewpoint, not a verdict. His math points at a real pressure, and the mainstream evidence tells you where that pressure is most likely to break through.
This article is for informational purposes only and should not be considered financial advice. Investors should conduct their own research and consult with financial professionals before making investment decisions. Past performance does not guarantee future results. Financial projections are subject to market conditions and various risk factors. These statements are speculative and subject to change based on market developments.