More than 40 commercial ships cleared the Strait of Hormuz in a single 24-hour stretch this week, according to US Central Command (CENTCOM). The West Texas Intermediate (WTI) crude oil price barely flinched and held weekly gains near $96 a barrel. If the waterway is moving oil, why is the market still paying up for it?
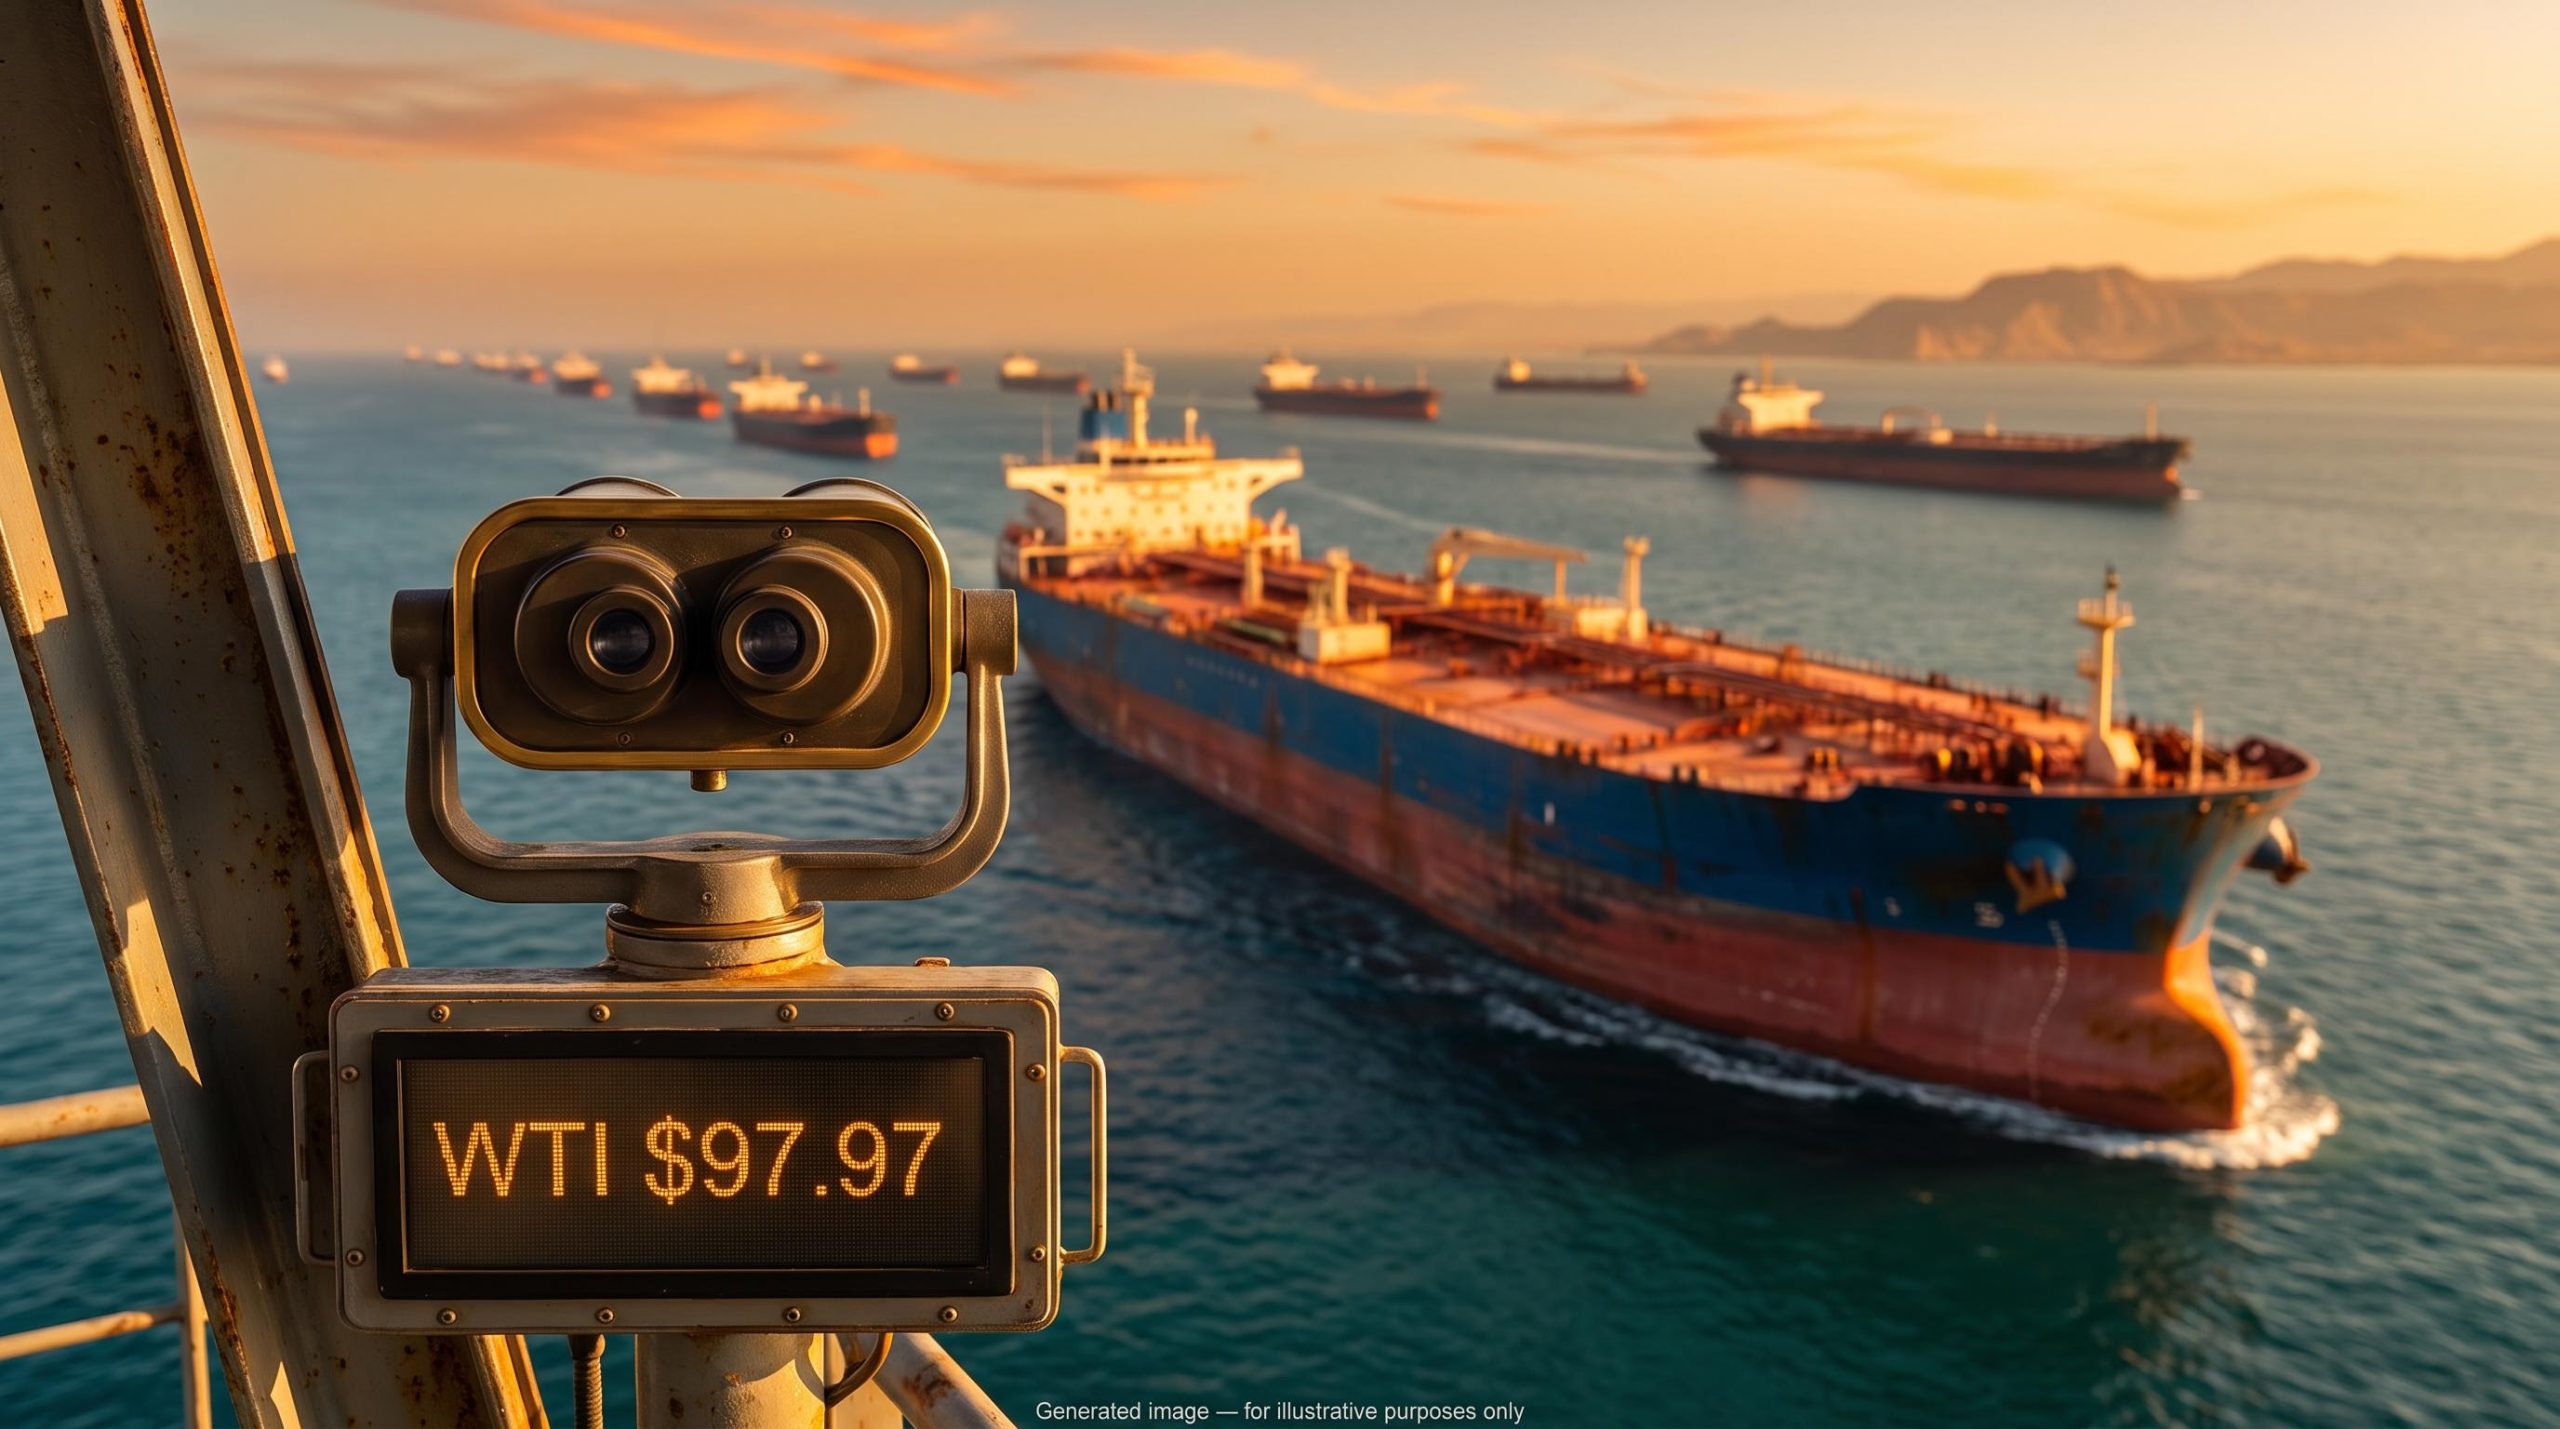
The answer sits in the price itself. WTI November futures settled at $97.97 on 15 October 2026 and were up roughly 5.8% for the week by Friday.
That premium is not a bet on a closed strait. It is a bet that today’s reopening might not last, which means the next big move in crude depends on signals you can learn to read before the headlines catch up.
This piece sets out which developments would shrink that premium, which would rebuild it, and how the chart levels traders are watching fit alongside them.
Why is the WTI crude oil price still pricing in a premium?
Start with the numbers, because they look slightly inconsistent at first glance:
- $97.97: WTI November futures settlement on 15 October (CNBC)
- 5.81%: weekly gain through 16 October (Pakistan Today)
- $96.10: Asian trading on 16 October (Mitrade)
- $96.00: Friday’s European session, holding weekly gains (FXStreet)
The spread between $96 and $98 is not a conflict. Each figure captures a different session or contract snapshot, and Friday’s trade simply gave back part of Thursday’s jump.
The more interesting gap is between the price and the traffic. Warren Patterson and Ewa Manthey at ING wrote on 16 October that doubt over the Middle East and over whether Hormuz flows can be sustained is keeping a “significant risk premium” in prices.
ING’s condition for full reversal Patterson and Manthey argue that complete removal of the premium would require a US-Iran agreement that lifts confidence in continued flows.
A risk premium is the extra amount buyers pay above what current supply and demand alone would justify, as protection against a future disruption. It can disappear without a single extra barrel arriving.
Goldman Sachs has estimated that roughly $14 a barrel of crude’s price at the time was a pure geopolitical risk premium, a figure that shows how much of the market’s pricing can vanish on a credible de-escalation signal alone.
That distinction matters for you. A quiet week of shipping headlines does not mean the premium has gone; the market is paying for insurance against the strait closing again, and that insurance only gets cheaper as confidence builds.
What the technical picture says
FXStreet’s AI-assisted chart analysis puts WTI at $96.11 with a bullish near-term bias on the daily chart. The 20-day exponential moving average (EMA), a trend line that gives more weight to recent prices, sits at $92.29 and marks first support on any pullback.
The 14-period relative strength index (RSI), a gauge of momentum on a 0-100 scale, reads near 60. That signals firm buying without the stretched conditions that often precede a sharp reversal.
Treat these as reference points rather than forecasts. Technicals describe momentum, not cause, but a sustained break below $92.29 would be one early sign that the premium is starting to leak.
When big ASX news breaks, our subscribers know first
What do Hormuz flows, attacks and stock releases actually show?
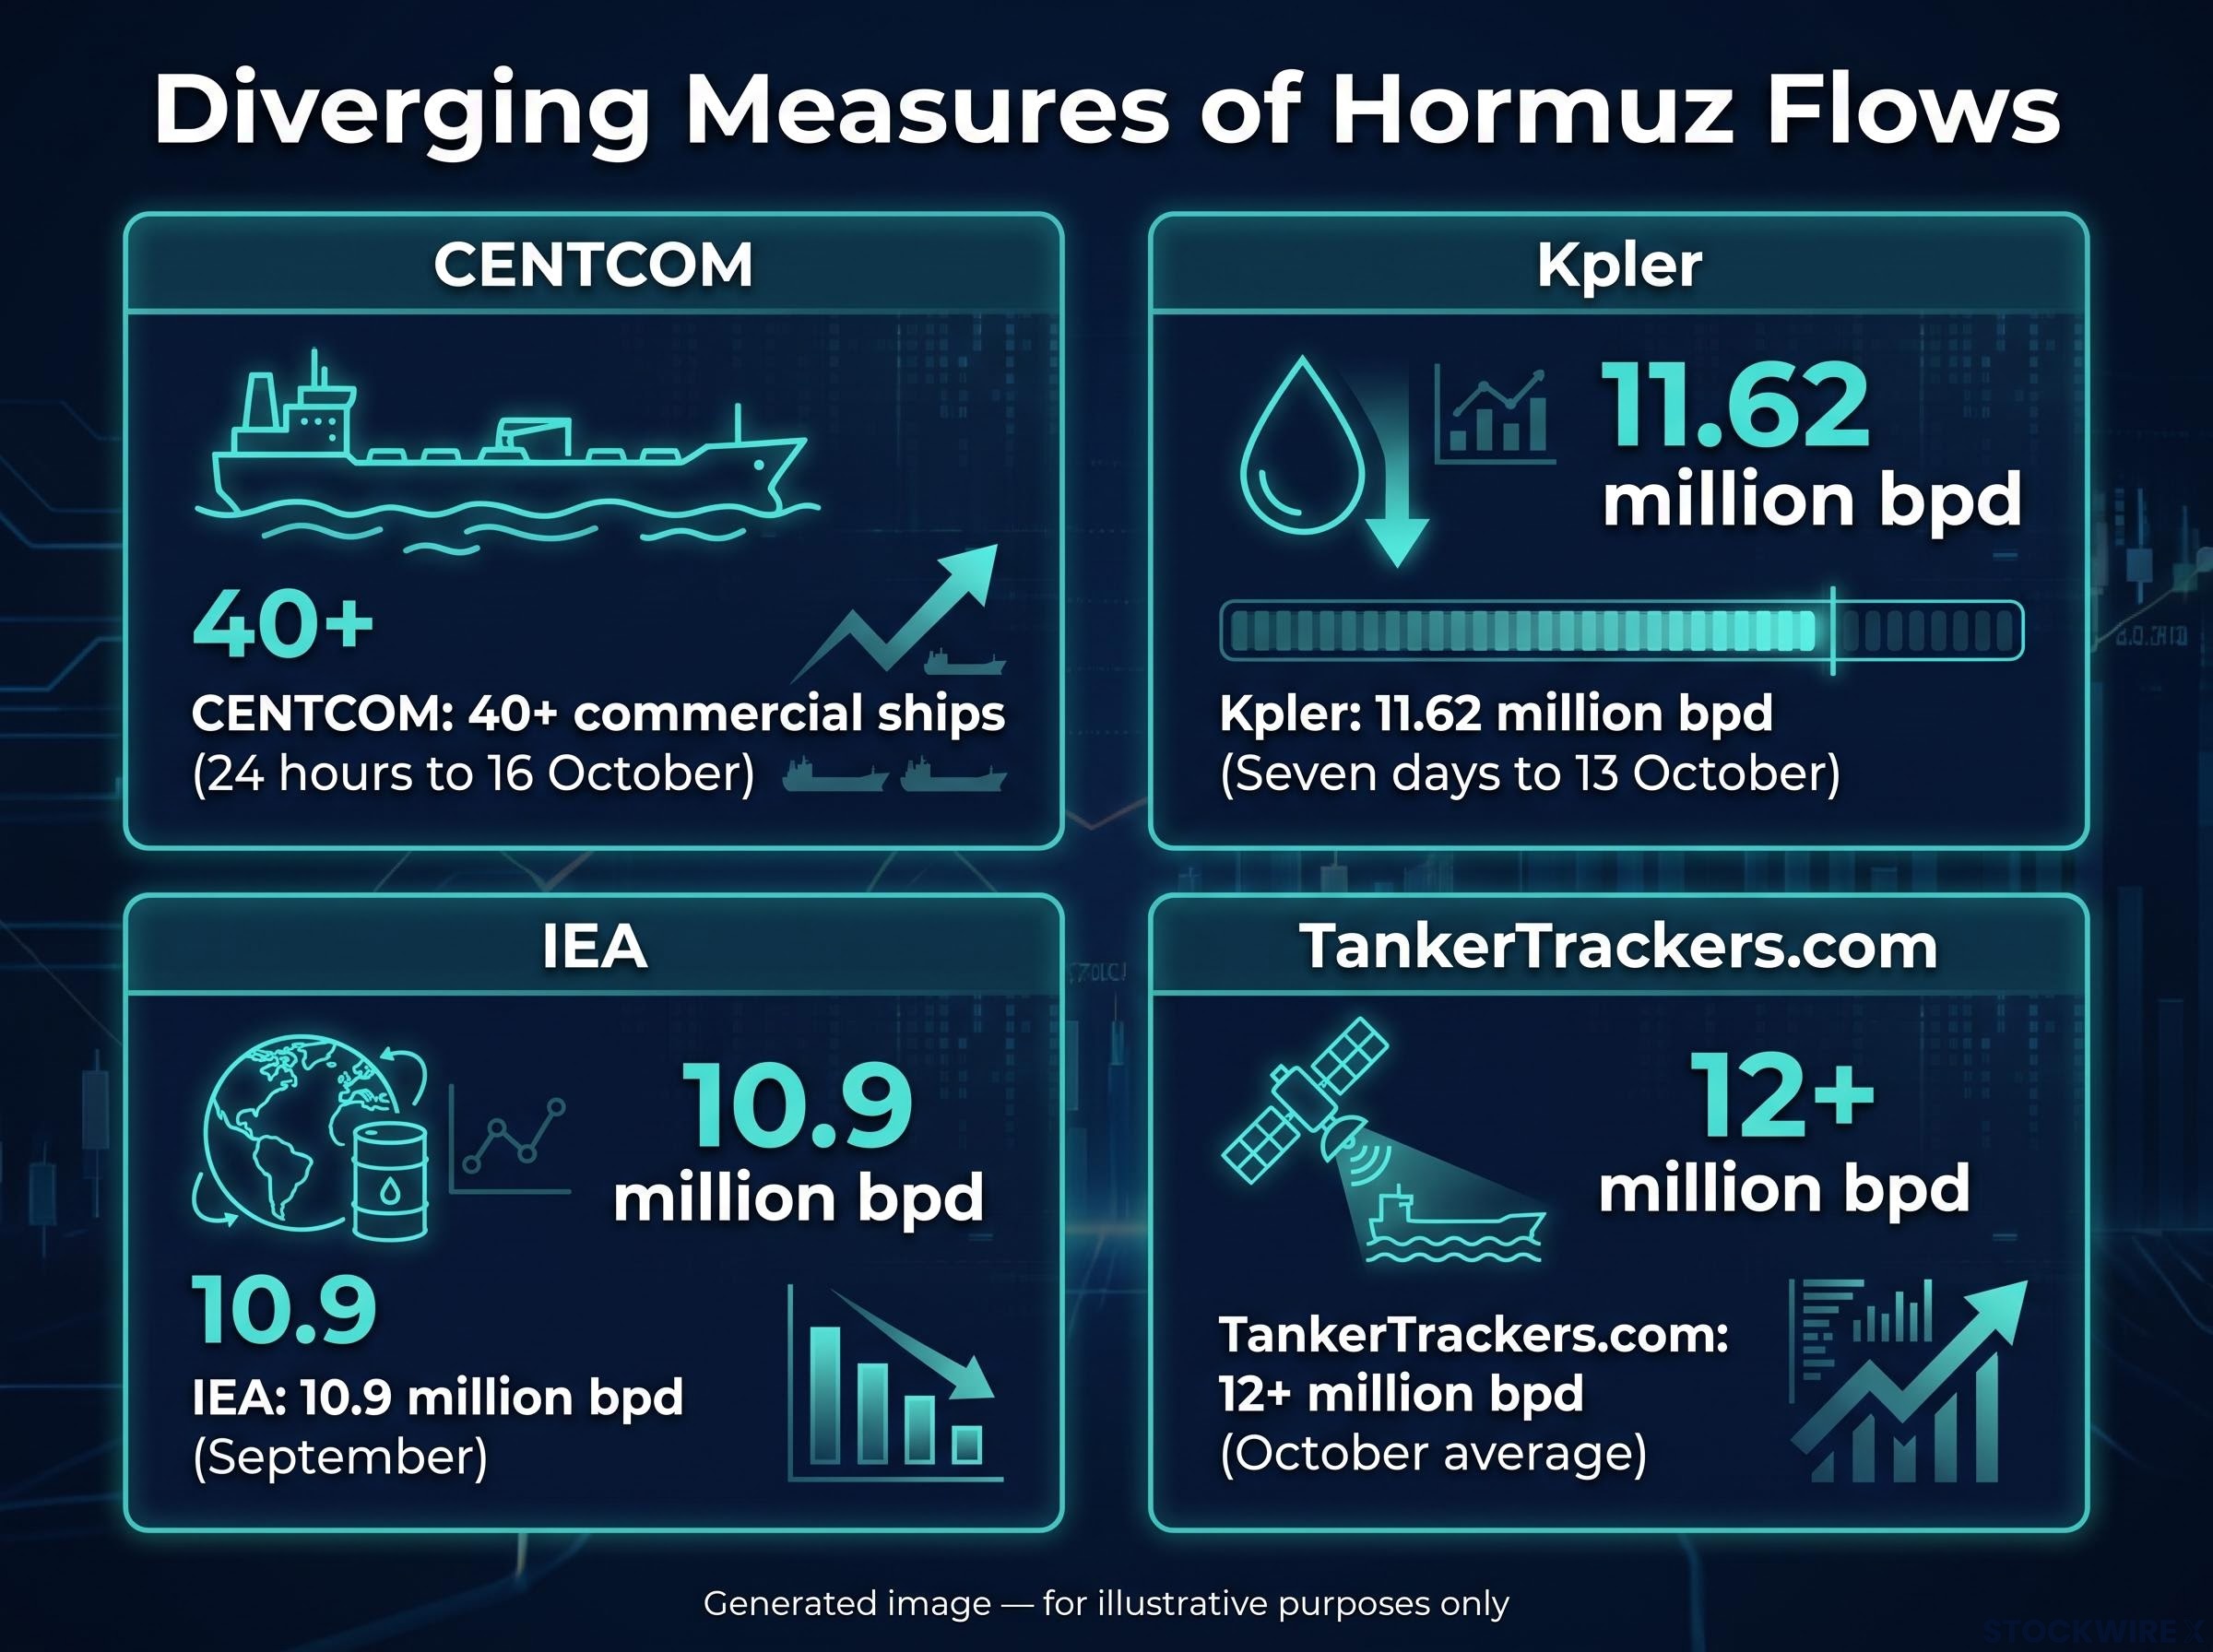
If the premium rests on durability, the physical evidence should tell you how durable things look. It does, but the readings diverge.
| Source | Period | Reported flow | Key caveat |
|---|---|---|---|
| CENTCOM | 24 hours to 16 October | 40+ commercial ships | Vessel count, not barrels |
| Kpler | Seven days to 13 October | 11.62 million bpd | About 68% of a 17.15 million bpd baseline |
| IEA | September | 10.9 million bpd | Includes ship-to-ship transfers in the Gulf of Oman |
| TankerTrackers.com | October average | 12+ million bpd | Different window and cargo definitions |
The figures differ because they measure different things over different dates. A ship-to-ship transfer, where cargo moves between two tankers at sea, can lift a monthly total without signalling normal export logistics.
Read together, the data puts flows at roughly two-thirds to three-quarters of normal. The route works, but “ships are moving” headlines overstate how settled it is, so check the source, the date range and whether transfers are counted before you react.
Security incidents
Traffic has recovered alongside continuing violence, not after it. Maritime monitors counted 26 vessels targeted in October as of 15 October, and two merchant ships, the Singapore-flagged GFS Pride and the Cape Dao, were reported sunk after projectile strikes.
Commerzbank analysts still described transit as resilient, with main crude routes largely uninterrupted. Both readings are true at once.
Iranian military limits on passage add another layer. They let the market price disruption without any formal closure, which is exactly the kind of fragility a premium is built to cover.
The final stock release
On 15 October, members of the International Energy Agency (IEA) agreed to complete the remaining 100 million barrels of the 400 million barrel emergency programme launched in March. About 330 million barrels had already been released, and the outstanding volume includes more than 20 million barrels of diesel.
The final US tranche from the Strategic Petroleum Reserve (SPR) is reported at up to 40 million barrels, structured as an exchange, meaning the oil is lent and later returned, with deliveries in November and December.
That timing adds near-term supply, but the cushion is finite. Reuters reporting put the whole intervention at only about 20 days of disrupted supply, so it buys time rather than fixing anything.
What could erode the premium, and what could rebuild it?
The evidence supports several readings at once, and the forecasters do not agree on all of them.
| Interpretation | Key evidence | Implication for WTI |
|---|---|---|
| Structural supply risk | IEA puts cumulative Hormuz export losses near 2.8 billion barrels | Prices may stay elevated as stocks deplete |
| Temporary disruption | EIA expects most shut-in output back by Q1 2027 | Premium could unwind quickly with de-escalation |
| Replacement capacity | Non-Gulf producers added about 2.3 million bpd; bypass routes offset 500+ million barrels | Physical deficit may be smaller than the headline outage |
| Demand destruction | 2026 demand seen down 1.1 million bpd (EIA) or about 2.6 million bpd (IEA) | Weaker demand caps the upside |
| Persistent tightness | US commercial crude fell 8.6 million barrels to 415.6 million | Ongoing draws leave the market exposed to fresh disruption |
The demand split deserves attention. The US Energy Information Administration (EIA) and the IEA, both reporting in October, sit more than a million barrels a day apart on 2026, and that gap alone could change how much upside the market tolerates.
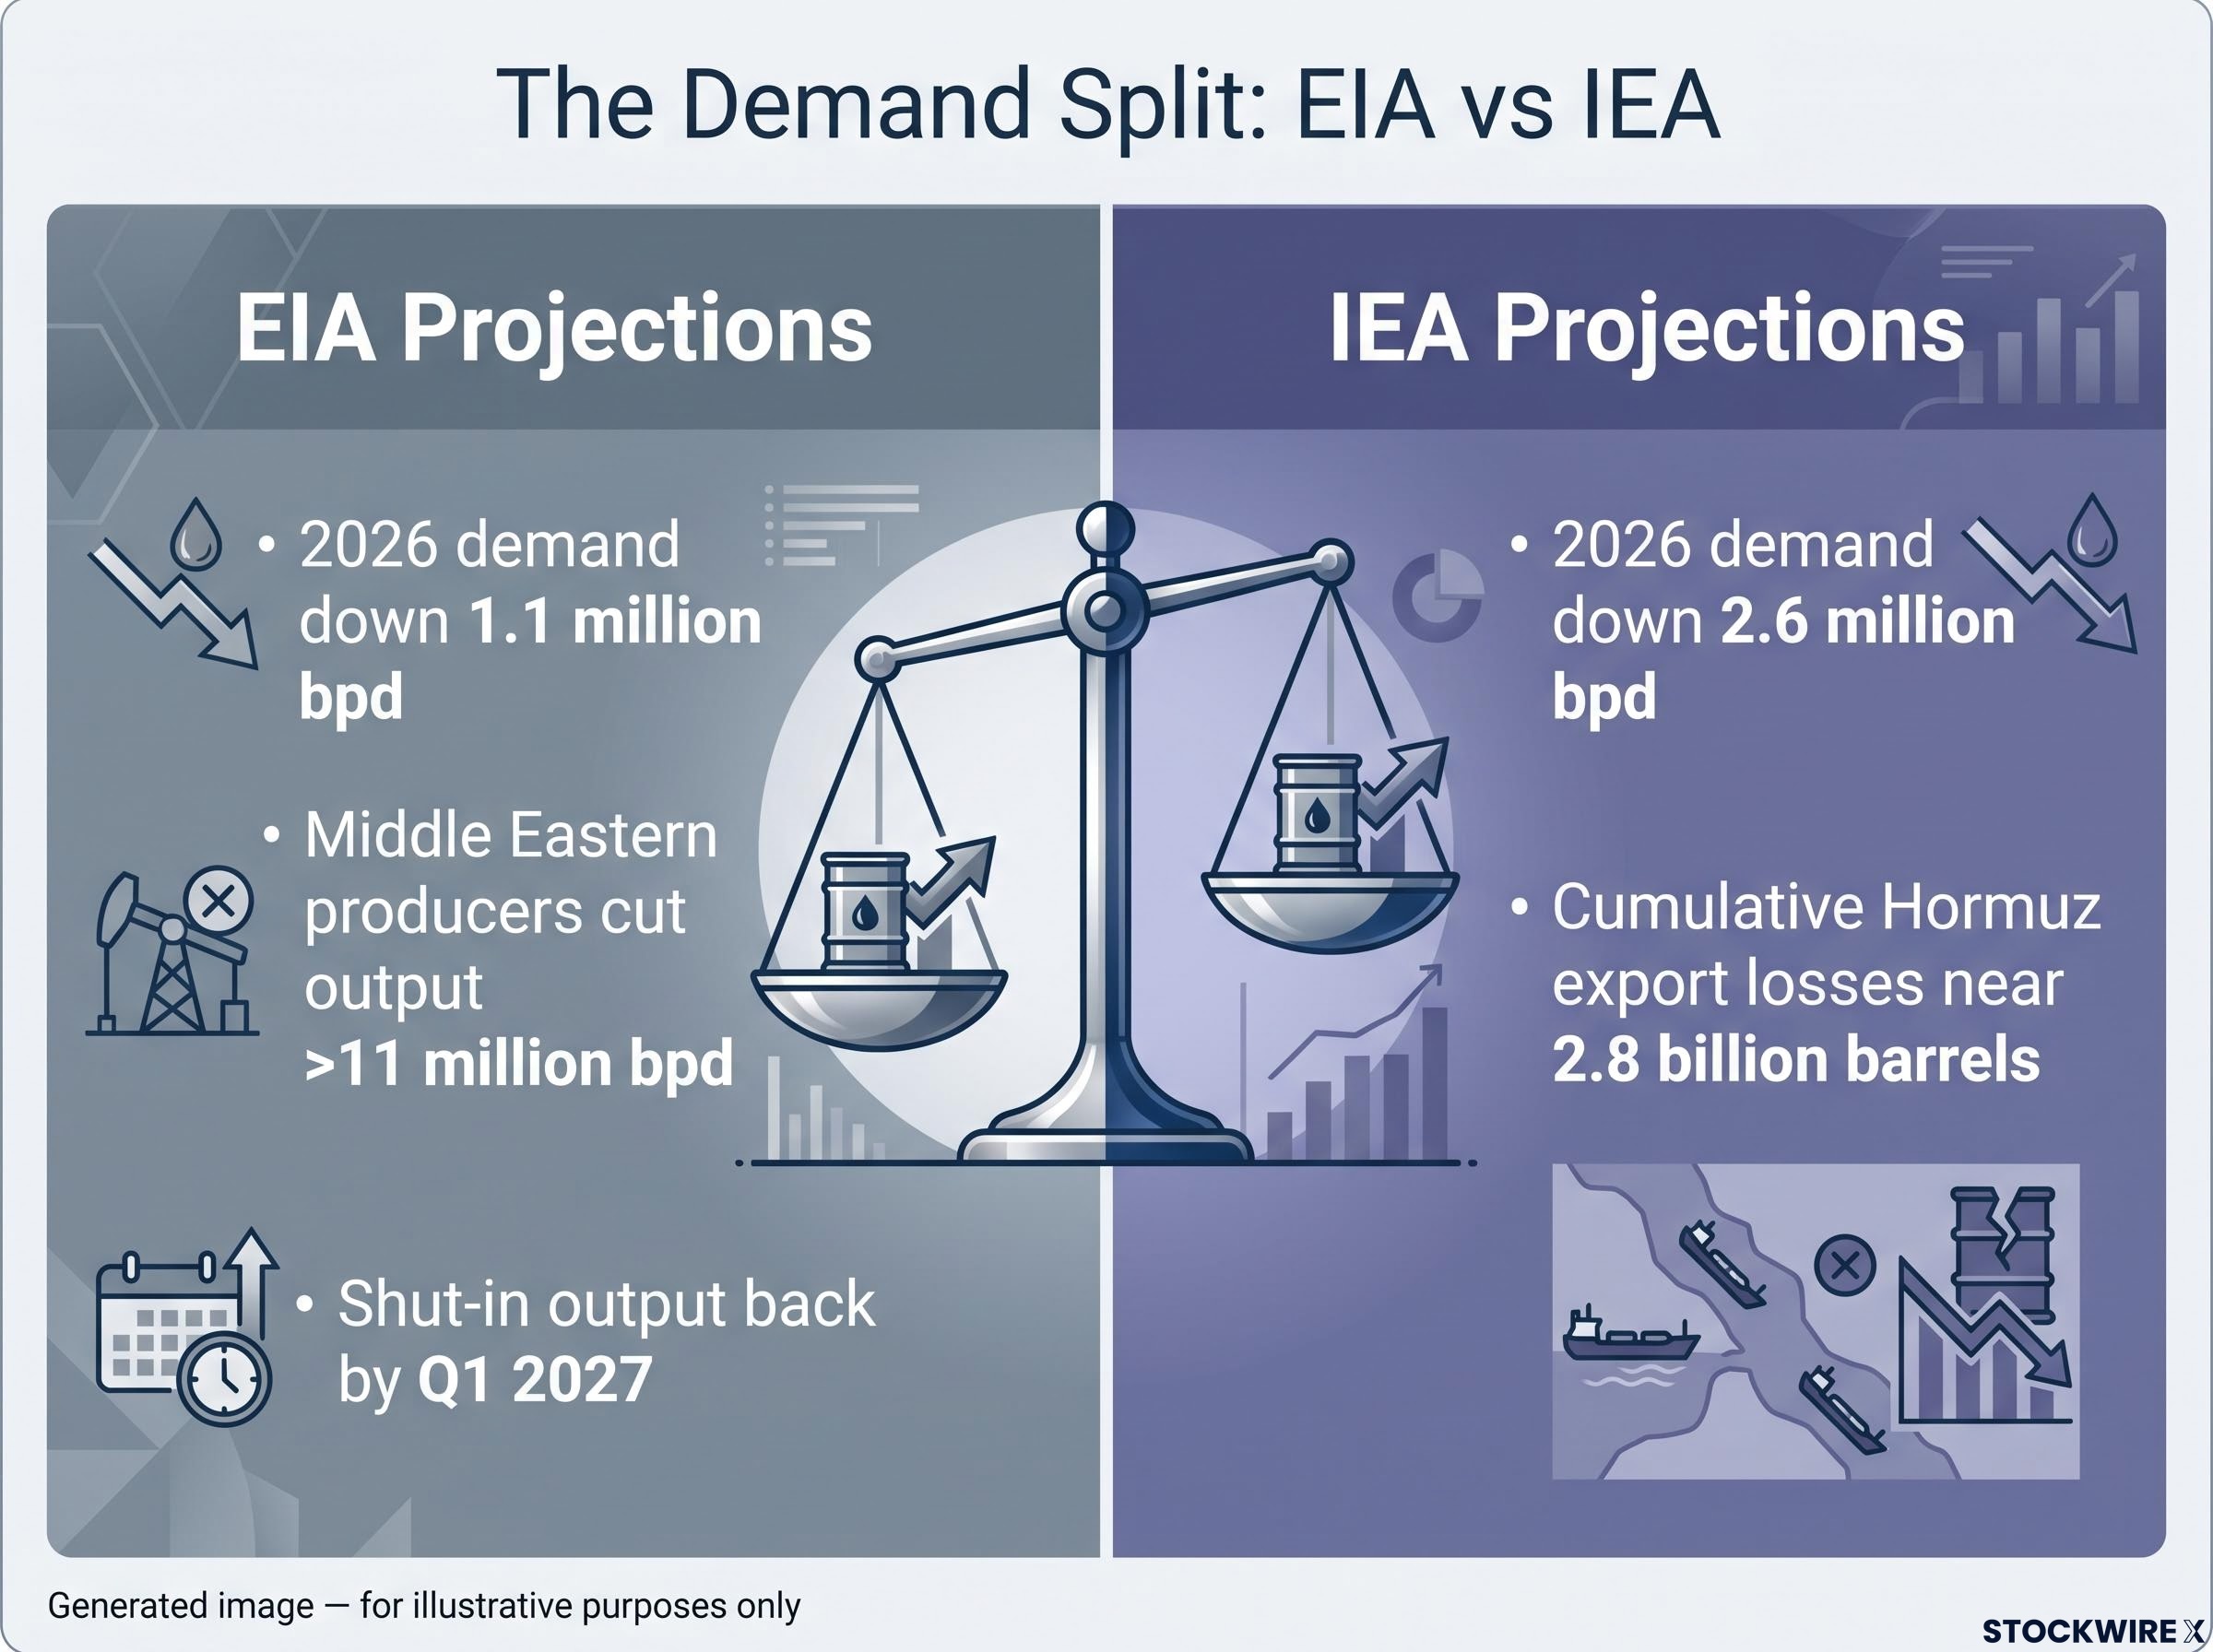
The EIA also estimates Middle Eastern producers have cut output by more than 11 million bpd, while forecasting 2027 demand to rise 2.5 million bpd as prices ease. Its view leans towards a disruption that weaker demand partly absorbs.
History offers loose context rather than a timetable. Premiums from the 1990 Gulf War, the 2019 Abqaiq attack, Russia’s 2022 invasion and the June 2025 Israel-Iran escalation all faded once supply fears proved smaller or slower than expected, though data on how long each took to decay was not available.
Signals that would shrink the premium:
- A US-Iran agreement that restores confidence in continued flows
- Restoration of Gulf production towards pre-conflict levels
- Further supply growth from the Americas and Atlantic Basin
- Evidence of demand destruction from high prices
- The remaining IEA and SPR barrels reaching the market
Signals that would rebuild it:
- Fresh attacks on tankers, terminals, pipelines or escorts
- Rising war-risk insurance and freight costs
- Tighter Iranian restrictions on passage
- Continued inventory draws as the finite release runs out
The deciding condition ING’s analysts note that the longer flows stay elevated, the more premium the market is likely to give back, but full removal hinges on a US-Iran deal.
If you hold or watch oil exposure, the most useful combination is sustained low-incident traffic plus diplomatic progress. A temporary traffic uptick has not been enough so far. Note that no recent commentary from Goldman Sachs or Morgan Stanley on this episode was found, so the attributable views come from ING, Commerzbank, the EIA and the IEA.
Earlier framework signals show why a deal headline is not enough: markets have learned to wait for specific verification steps, including a signed agreement, independent monitoring, mine clearance and a resumption of insurance underwriting.
Past performance does not guarantee future results. Forecasts and scenarios are subject to market conditions and various risk factors.
What drives the WTI crude oil price, and how do you read the next move?
When the next oil headline lands, a short checklist helps you place it:
- Flow data: which source, which dates, and are transfers included?
- Inventories: did weekly stocks draw or build?
- OPEC+ stance: any change to production targets?
- The dollar: stronger or weaker on the day?
- Technical levels: is price holding above the $92.29 20-day EMA?
WTI is a light, sweet US crude, meaning it is low in density and sulphur and easy to refine. It is delivered at Cushing, Oklahoma, and sits alongside Brent and Dubai as one of the three main global benchmarks.
Supply policy is the first lever. The Organization of the Petroleum Exporting Countries (OPEC) has 12 members and meets twice a year, while OPEC+ adds ten non-OPEC producers including Russia; quota cuts tighten supply and lift prices. On 4 October, OPEC+ kept November targets unchanged with about 2 million bpd of cuts still in place.
The frozen OPEC+ output targets look minor beside the physical picture, since Saudi Arabia, Iraq and Kuwait are already about 7.9 million bpd below pre-war production, which dwarfs any quota lever the group can pull.
| Driver | Direction of effect | Current reading |
|---|---|---|
| OPEC+ policy | Cuts lift price; increases weigh | November targets unchanged, about 2 million bpd of cuts |
| Inventories | Draws support; builds weigh | 8.6 million barrel draw, week to 9 October |
| US dollar | Weaker dollar supports demand | Secondary to geopolitics this week |
| Geopolitics | Disruption risk lifts the premium | 26 vessels targeted in October |
Inventories and the dollar
The American Petroleum Institute (API) publishes weekly stock estimates on Tuesdays and the EIA follows on Wednesdays. The two land within 1% of each other about 75% of the time, but the EIA figure, as a government release, carries more weight.
The latest EIA report showed commercial crude falling 8.6 million barrels to 415.6 million, even as Cushing stocks rose 1.9 million. A draw that size feeds the persistent-tightness argument, so a run of further draws would tell you the cushion is thinning.
The dollar works more quietly. Because oil is priced in US dollars, a weaker dollar makes each barrel cheaper for non-US buyers and can support demand, though right now it ranks behind Hormuz in moving price.
Reading the next move: signals that matter more than headlines
The premium in crude rests on doubt about durability, not on today’s traffic count. A credible US-Iran agreement, followed by weeks of quiet transit, remains the clearest path to removing it.
Until then, keep a short watch-list:
- Weekly Hormuz transit counts, checked by source and date range
- New vessel incidents or Iranian restrictions
- Wednesday’s EIA inventory figures
- Price relative to the $92.29 20-day EMA
- Diplomatic news between Washington and Tehran
The final stock releases arrive in November and December, adding supply just as the programme’s limits come into view. This analysis reflects information available as of 16 October 2026, and conditions in the strait can change quickly.
This article is for informational purposes only and should not be considered financial advice. Investors should conduct their own research and consult with financial professionals before making investment decisions.